| Param | Original file | Final file |
|---|---|---|
| Filename | modeM0/AS1A12_037T01_9000005652cztM0_level2.fits | modeM0/AS1A12_037T01_9000005652cztM0_level2_quad_clean.evt |
| Size (bytes) | 416,119,680 | 402,402,240 |
| Size | 396.8 MB | 383.8 MB |
| Events in quadrant A | 2,514,282 | 2,381,070 |
| Events in quadrant B | 2,413,718 | 2,386,998 |
| Events in quadrant C | 2,395,842 | 2,219,761 |
| Events in quadrant D | 2,092,906 | 2,013,650 |
| Mode SS | |||
|---|---|---|---|
| Quadrant | BADHDUFLAG | Total packets | Discarded packets |
| A | 0 | 950 | 0 |
| B | 0 | 950 | 0 |
| C | 0 | 950 | 0 |
| D | 0 | 950 | 0 |
| Mode M9 | |||
|---|---|---|---|
| Quadrant | BADHDUFLAG | Total packets | Discarded packets |
| A | 0 | 184 | 0 |
| B | 0 | 184 | 0 |
| C | 0 | 184 | 0 |
| D | 0 | 184 | 0 |
| Mode M0 | |||
|---|---|---|---|
| Quadrant | BADHDUFLAG | Total packets | Discarded packets |
| A | 0 | 99449 | 0 |
| B | 0 | 99299 | 0 |
| C | 0 | 103185 | 0 |
| D | 0 | 118405 | 0 |
| Quadrant | Total seconds | Saturated seconds | Saturation percentage |
|---|---|---|---|
| A | 46394 | 81 | 0.174592% |
| B | 46394 | 261 | 0.562573% |
| C | 46394 | 1292 | 2.784843% |
| D | 46394 | 1212 | 2.612407% |
Noise dominated data is calculated using 1-second bins in cleaned event files. If a bin has >2000 counts, and if more than 50% of those come from <1% of pixels, then it is considered to be noise-dominated and hence unusable.
| Quadrant | # 1 sec bins | Bins with >0 counts | Bins with >2000 counts | High rate bins dominated by noise | Noise dominated (total time) | Noise dominated (detector-on time) | Marked lightcurve |
|---|---|---|---|---|---|---|---|
| A | 64829 | 46394 | 0 | 0 | 0.00% | 0.00% |  |
| B | 64829 | 46393 | 0 | 0 | 0.00% | 0.00% | 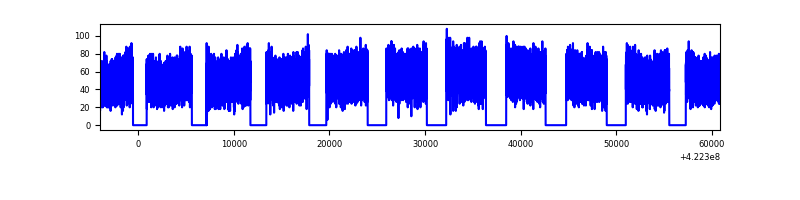 |
| C | 64829 | 46207 | 0 | 0 | 0.00% | 0.00% |  |
| D | 64829 | 46351 | 0 | 0 | 0.00% | 0.00% |  |
Top three noisy pixels from each quadrant. If the there are fewer than three noisy pixels in the level2.evt file, extra rows are filled as -1
| Pixel properties | Quadrant properties | ||||||
|---|---|---|---|---|---|---|---|
| Quadrant | DetID | PixID | Counts | Sigma | Mean | Median | Sigma |
| A | 7 | 110 | 2112 | 8.99 | 655 | 611 | 167.0 |
| A | 0 | 29 | 2030 | 8.5 | 655 | 611 | 167.0 |
| A | 9 | 19 | 2017 | 8.42 | 655 | 611 | 167.0 |
| B | 2 | 9 | 2097 | 11.6 | 637 | 605 | 128.6 |
| B | 3 | 80 | 1773 | 9.08 | 637 | 605 | 128.6 |
| B | 5 | 128 | 1647 | 8.1 | 637 | 605 | 128.6 |
| C | 1 | 81 | 1930 | 8.15 | 632 | 589 | 164.5 |
| C | 1 | 80 | 1909 | 8.02 | 632 | 589 | 164.5 |
| C | 3 | 203 | 1852 | 7.68 | 632 | 589 | 164.5 |
| D | 4 | 160 | 1566 | 6.37 | 598 | 546 | 160.2 |
| D | 7 | 3 | 1556 | 6.31 | 598 | 546 | 160.2 |
| D | 10 | 189 | 1554 | 6.29 | 598 | 546 | 160.2 |
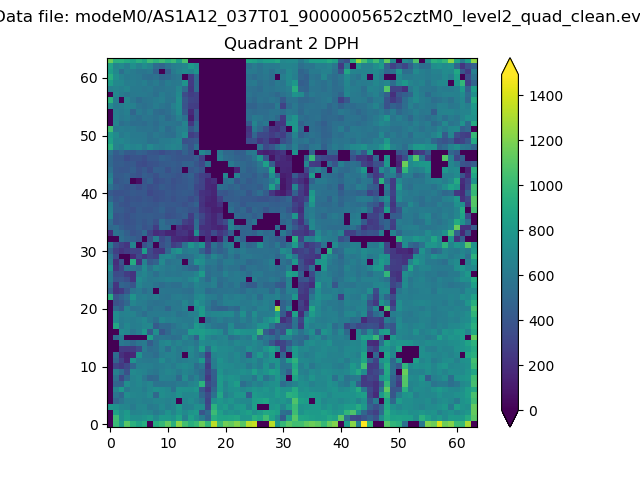
Histogram calculated using DETX and DETY for each event in the final _common_clean file
| Quadrant A |  |
 |
Quadrant B |
|---|---|---|---|
| Quadrant D |  |
 |
Quadrant C |
| Plot type | Count rate plots | Images |
|---|---|---|
| Comparison with Poisson distribution Blue bars denote a histogram of data divided into 1 sec bins. Red curve is a Poisson curve with rate = median count rate of data. |
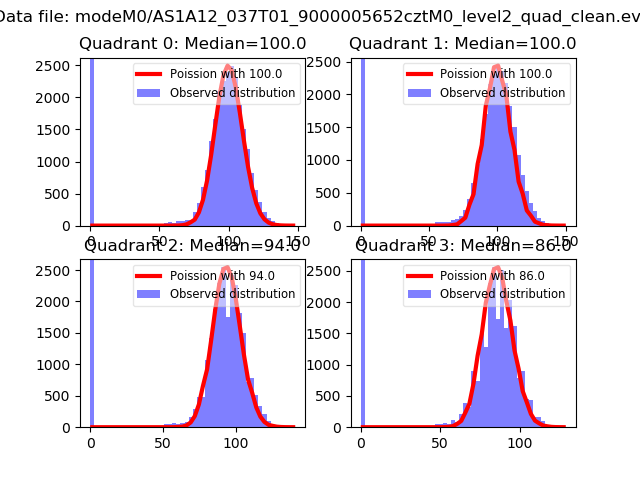 |
 |
| Quadrant-wise count rates Data is divided into 100 sec bins |
 |
|
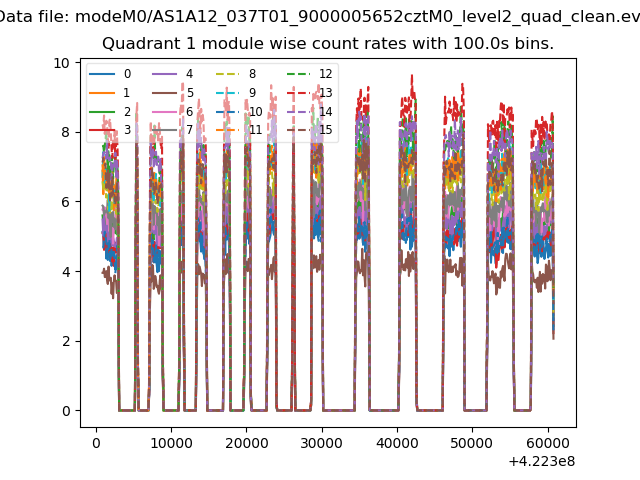
| Module-wise count rates for Quadrant A Data is divided into 100 sec bins |
 |
 |
| Module-wise count rates for Quadrant B Data is divided into 100 sec bins |
 |
 |
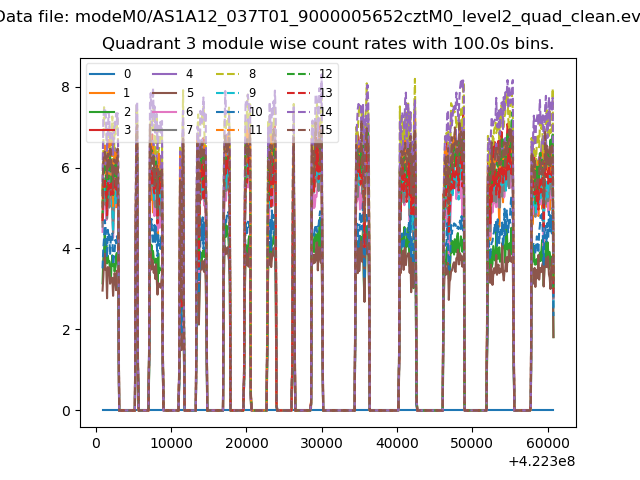
| Module-wise count rates for Quadrant C Data is divided into 100 sec bins |
 |
 |
| Module-wise count rates for Quadrant D Data is divided into 100 sec bins |
 |
 |
| Parameter | Plot |
|---|---|
| CZT HV Monitor |  |
| D_VDD | 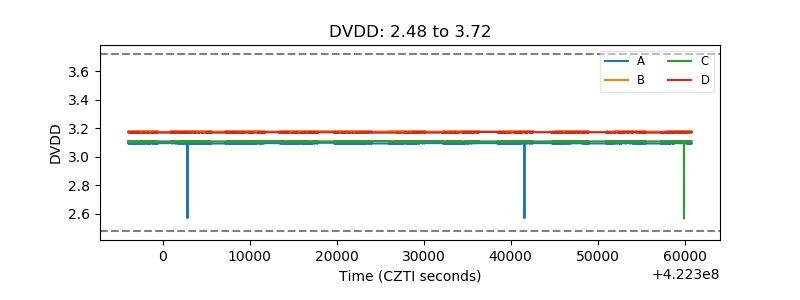 |
| Temperature 1 |  |
| Veto HV Monitor |  |
| Veto LLD |  |
| Alpha Counter | 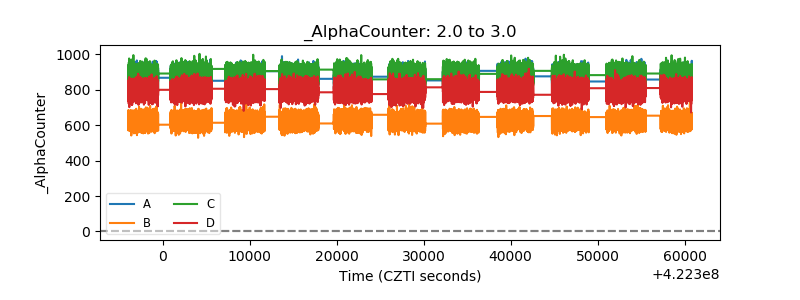 |
| _CPM_Rate |  |
| CZT Counter | 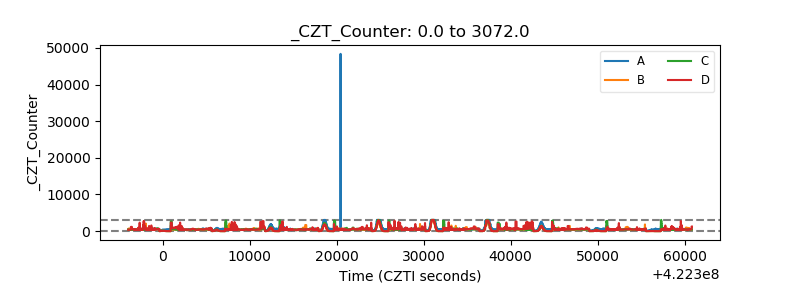 |
| +2.5 Volts monitor |  |
| +5 Volts monitor | 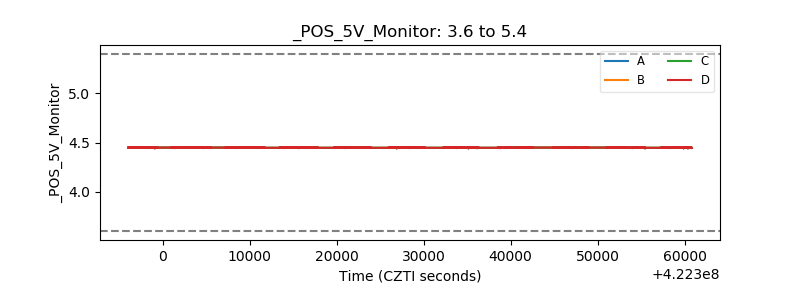 |
| _ROLL_ROT |  |
| _Roll_DEC | 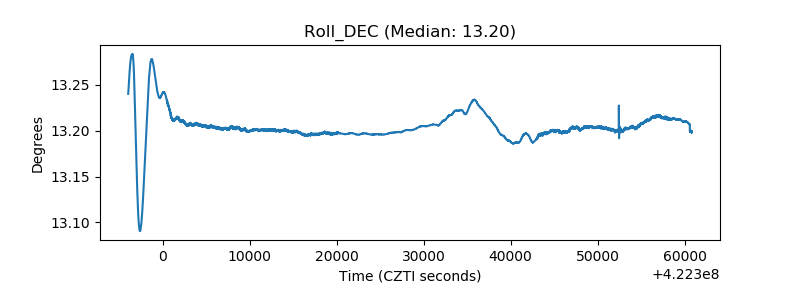 |
| _Roll_RA |  |
| Veto Counter |  |