| Param | Original file | Final file |
|---|---|---|
| Filename | modeM0/AS1A12_025T16_9000005650cztM0_level2.fits | modeM0/AS1A12_025T16_9000005650cztM0_level2_quad_clean.evt |
| Size (bytes) | 112,677,120 | 121,688,640 |
| Size | 107.5 MB | 116.1 MB |
| Events in quadrant A | 671,086 | 742,529 |
| Events in quadrant B | 639,726 | 737,083 |
| Events in quadrant C | 649,584 | 679,413 |
| Events in quadrant D | 563,822 | 637,604 |
| Mode M0 | |||
|---|---|---|---|
| Quadrant | BADHDUFLAG | Total packets | Discarded packets |
| A | 0 | 27389 | 0 |
| B | 0 | 28639 | 0 |
| C | 0 | 27932 | 0 |
| D | 0 | 33454 | 0 |
| Mode M9 | |||
|---|---|---|---|
| Quadrant | BADHDUFLAG | Total packets | Discarded packets |
| A | 0 | 40 | 0 |
| B | 0 | 40 | 0 |
| C | 0 | 40 | 0 |
| D | 0 | 40 | 0 |
| Mode SS | |||
|---|---|---|---|
| Quadrant | BADHDUFLAG | Total packets | Discarded packets |
| A | 0 | 262 | 0 |
| B | 0 | 262 | 0 |
| C | 0 | 262 | 0 |
| D | 0 | 262 | 0 |
| Quadrant | Total seconds | Saturated seconds | Saturation percentage |
|---|---|---|---|
| A | 12855 | 23 | 0.178919% |
| B | 12855 | 176 | 1.369117% |
| C | 12855 | 307 | 2.388176% |
| D | 12855 | 305 | 2.372618% |
Noise dominated data is calculated using 1-second bins in cleaned event files. If a bin has >2000 counts, and if more than 50% of those come from <1% of pixels, then it is considered to be noise-dominated and hence unusable.
| Quadrant | # 1 sec bins | Bins with >0 counts | Bins with >2000 counts | High rate bins dominated by noise | Noise dominated (total time) | Noise dominated (detector-on time) | Marked lightcurve |
|---|---|---|---|---|---|---|---|
| A | 16822 | 12855 | 0 | 0 | 0.00% | 0.00% |  |
| B | 16822 | 12855 | 0 | 0 | 0.00% | 0.00% |  |
| C | 16822 | 12838 | 0 | 0 | 0.00% | 0.00% |  |
| D | 16822 | 12852 | 0 | 0 | 0.00% | 0.00% |  |
Top three noisy pixels from each quadrant. If the there are fewer than three noisy pixels in the level2.evt file, extra rows are filled as -1
| Pixel properties | Quadrant properties | ||||||
|---|---|---|---|---|---|---|---|
| Quadrant | DetID | PixID | Counts | Sigma | Mean | Median | Sigma |
| A | 0 | 29 | 551 | 8.27 | 174 | 162 | 47.0 |
| A | 15 | 236 | 526 | 7.74 | 174 | 162 | 47.0 |
| A | 7 | 110 | 526 | 7.74 | 174 | 162 | 47.0 |
| B | 2 | 9 | 570 | 11.38 | 169 | 160 | 36.0 |
| B | 3 | 17 | 463 | 8.41 | 169 | 160 | 36.0 |
| B | 3 | 80 | 459 | 8.3 | 169 | 160 | 36.0 |
| C | 3 | 202 | 540 | 8.24 | 171 | 160 | 46.1 |
| C | 1 | 80 | 529 | 8.0 | 171 | 160 | 46.1 |
| C | 1 | 81 | 509 | 7.57 | 171 | 160 | 46.1 |
| D | 7 | 3 | 426 | 6.1 | 161 | 146 | 45.9 |
| D | 15 | 46 | 423 | 6.04 | 161 | 146 | 45.9 |
| D | 6 | 38 | 416 | 5.89 | 161 | 146 | 45.9 |
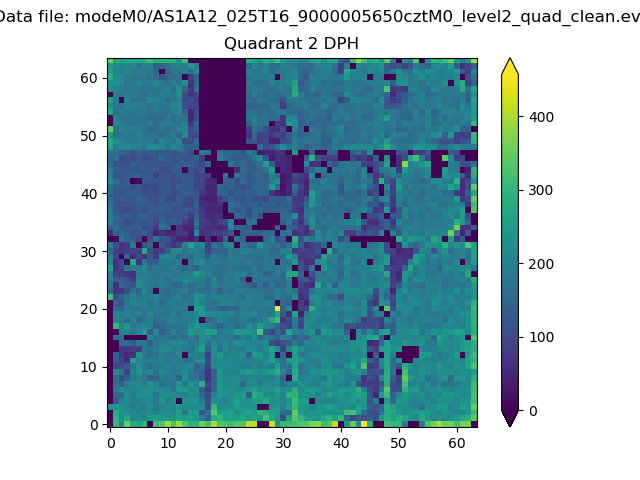
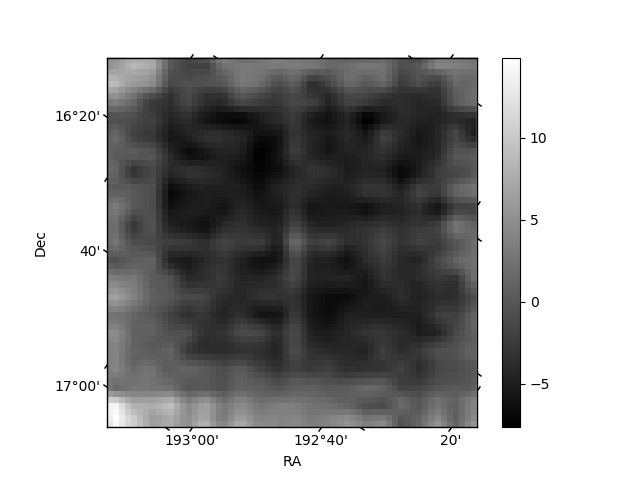
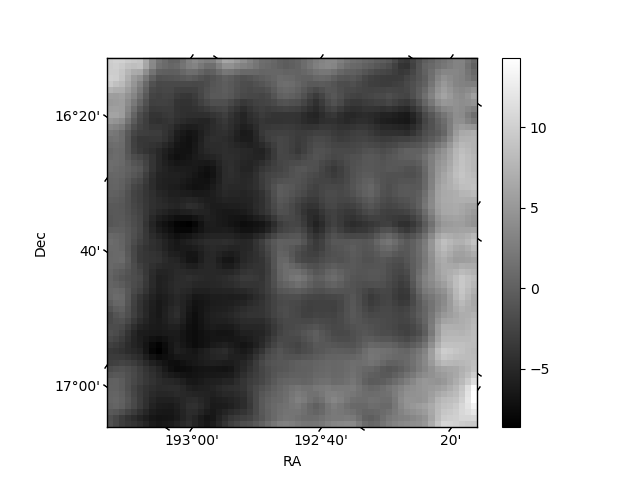
Histogram calculated using DETX and DETY for each event in the final _common_clean file
| Quadrant A | 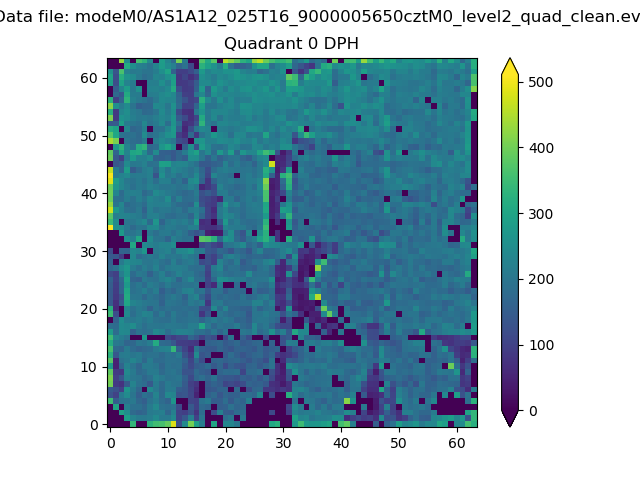 |
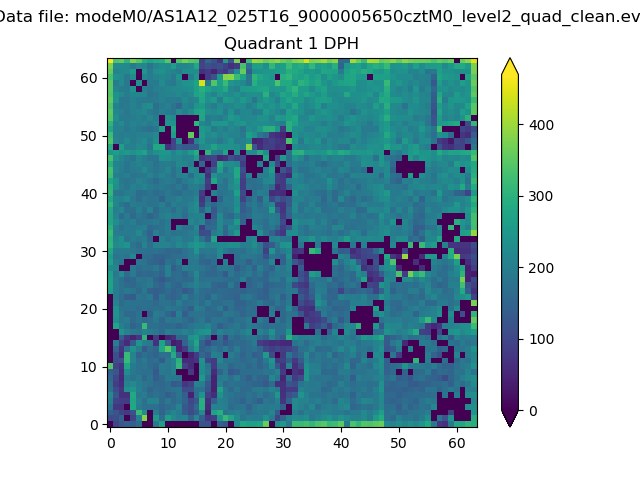 |
Quadrant B |
|---|---|---|---|
| Quadrant D | 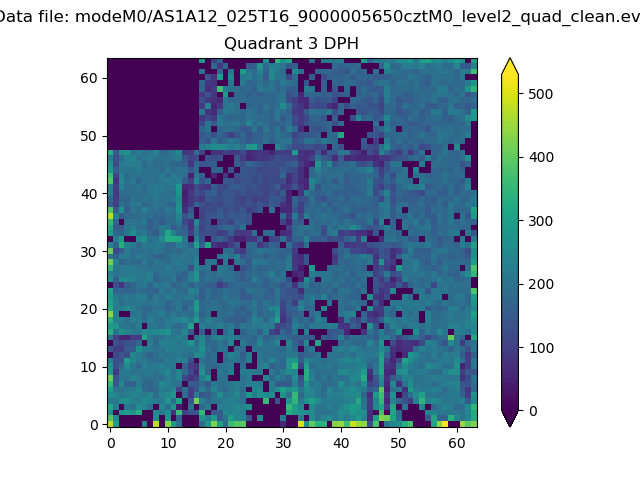 |
 |
Quadrant C |
| Plot type | Count rate plots | Images |
|---|---|---|
| Comparison with Poisson distribution Blue bars denote a histogram of data divided into 1 sec bins. Red curve is a Poisson curve with rate = median count rate of data. |
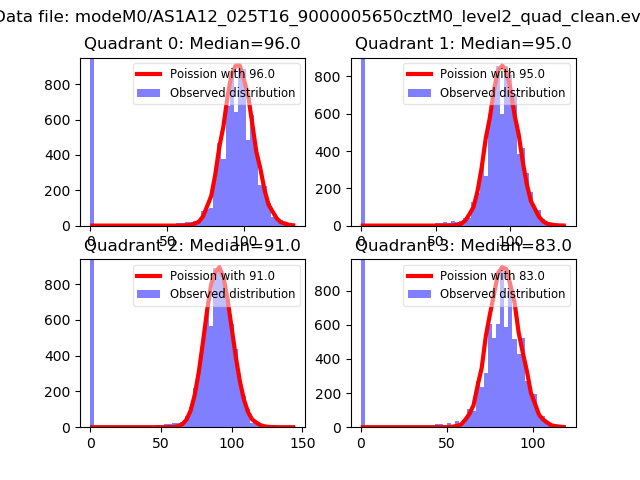 |
 |
| Quadrant-wise count rates Data is divided into 100 sec bins |
 |
|
| Module-wise count rates for Quadrant A Data is divided into 100 sec bins |
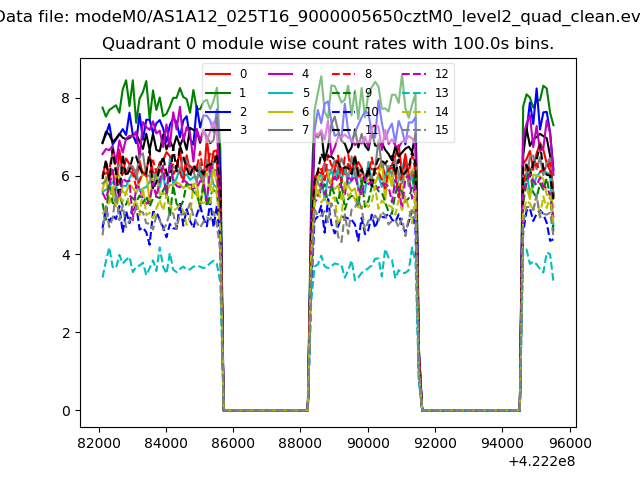 |
 |
| Module-wise count rates for Quadrant B Data is divided into 100 sec bins |
 |
 |
| Module-wise count rates for Quadrant C Data is divided into 100 sec bins |
 |
 |
| Module-wise count rates for Quadrant D Data is divided into 100 sec bins |
 |
 |
| Parameter | Plot |
|---|---|
| CZT HV Monitor | 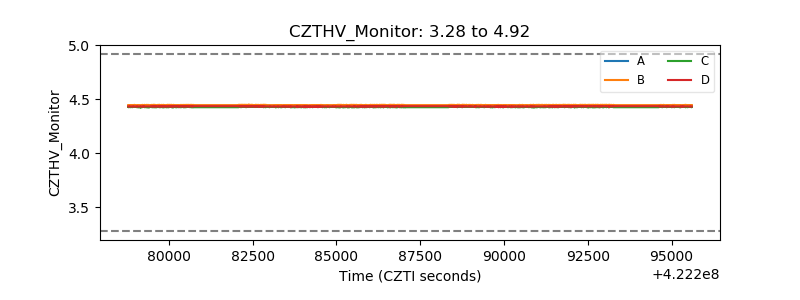 |
| D_VDD | 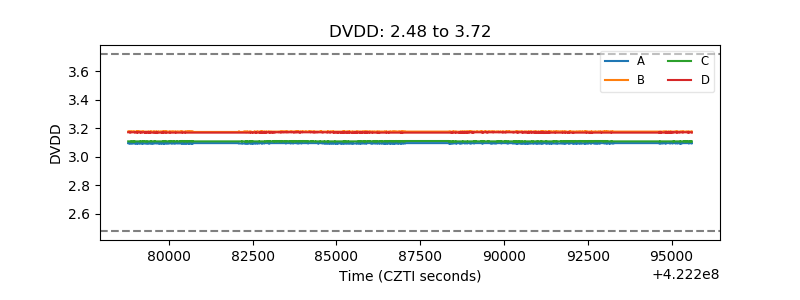 |
| Temperature 1 | 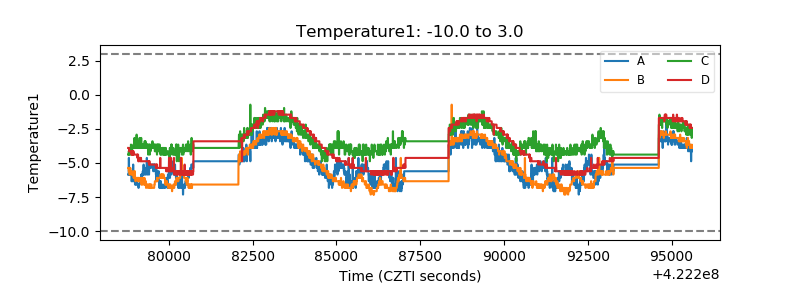 |
| Veto HV Monitor |  |
| Veto LLD | 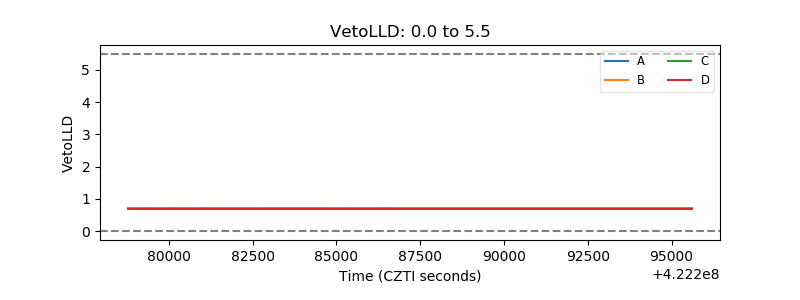 |
| Alpha Counter |  |
| _CPM_Rate | 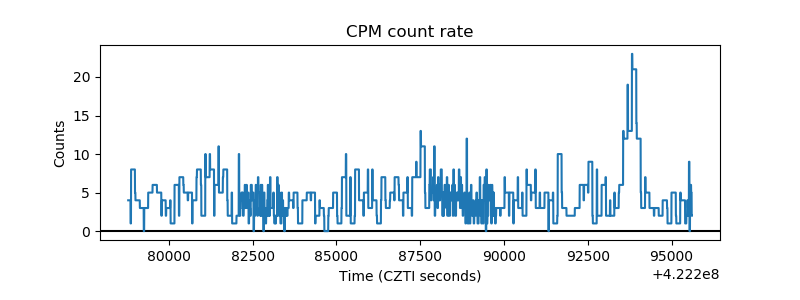 |
| CZT Counter |  |
| +2.5 Volts monitor |  |
| +5 Volts monitor |  |
| _ROLL_ROT | 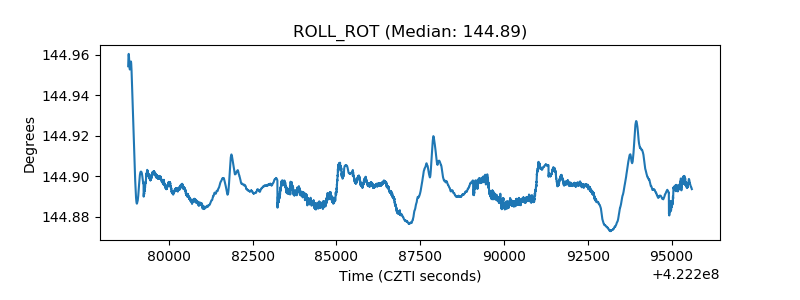 |
| _Roll_DEC |  |
| _Roll_RA |  |
| Veto Counter |  |