| Param | Original file | Final file |
|---|---|---|
| Filename | modeM0/AS1A12_025T15_9000005648cztM0_level2.fits | modeM0/AS1A12_025T15_9000005648cztM0_level2_quad_clean.evt |
| Size (bytes) | 104,345,280 | 127,592,640 |
| Size | 99.5 MB | 121.7 MB |
| Events in quadrant A | 625,460 | 799,186 |
| Events in quadrant B | 598,466 | 805,411 |
| Events in quadrant C | 595,030 | 757,737 |
| Events in quadrant D | 527,108 | 687,440 |
| Mode M0 | |||
|---|---|---|---|
| Quadrant | BADHDUFLAG | Total packets | Discarded packets |
| A | 0 | 25081 | 0 |
| B | 0 | 24847 | 0 |
| C | 0 | 26407 | 0 |
| D | 0 | 29683 | 0 |
| Mode M9 | |||
|---|---|---|---|
| Quadrant | BADHDUFLAG | Total packets | Discarded packets |
| A | 0 | 56 | 0 |
| B | 0 | 56 | 0 |
| C | 0 | 56 | 0 |
| D | 0 | 56 | 0 |
| Mode SS | |||
|---|---|---|---|
| Quadrant | BADHDUFLAG | Total packets | Discarded packets |
| A | 0 | 242 | 0 |
| B | 0 | 242 | 0 |
| C | 0 | 242 | 0 |
| D | 0 | 242 | 0 |
| Quadrant | Total seconds | Saturated seconds | Saturation percentage |
|---|---|---|---|
| A | 11767 | 24 | 0.203960% |
| B | 11767 | 21 | 0.178465% |
| C | 11767 | 399 | 3.390839% |
| D | 11767 | 284 | 2.413529% |
Noise dominated data is calculated using 1-second bins in cleaned event files. If a bin has >2000 counts, and if more than 50% of those come from <1% of pixels, then it is considered to be noise-dominated and hence unusable.
| Quadrant | # 1 sec bins | Bins with >0 counts | Bins with >2000 counts | High rate bins dominated by noise | Noise dominated (total time) | Noise dominated (detector-on time) | Marked lightcurve |
|---|---|---|---|---|---|---|---|
| A | 17355 | 11766 | 0 | 0 | 0.00% | 0.00% |  |
| B | 17356 | 11767 | 0 | 0 | 0.00% | 0.00% |  |
| C | 17356 | 11702 | 0 | 0 | 0.00% | 0.00% |  |
| D | 17356 | 11749 | 0 | 0 | 0.00% | 0.00% |  |
Top three noisy pixels from each quadrant. If the there are fewer than three noisy pixels in the level2.evt file, extra rows are filled as -1
| Pixel properties | Quadrant properties | ||||||
|---|---|---|---|---|---|---|---|
| Quadrant | DetID | PixID | Counts | Sigma | Mean | Median | Sigma |
| A | 7 | 110 | 563 | 9.49 | 163 | 152 | 43.3 |
| A | 0 | 29 | 510 | 8.27 | 163 | 152 | 43.3 |
| A | 9 | 19 | 492 | 7.85 | 163 | 152 | 43.3 |
| B | 2 | 9 | 508 | 10.64 | 158 | 150 | 33.6 |
| B | 3 | 80 | 426 | 8.21 | 158 | 150 | 33.6 |
| B | 5 | 128 | 424 | 8.15 | 158 | 150 | 33.6 |
| C | 1 | 81 | 472 | 7.77 | 157 | 147 | 41.8 |
| C | 1 | 80 | 459 | 7.46 | 157 | 147 | 41.8 |
| C | 9 | 233 | 438 | 6.96 | 157 | 147 | 41.8 |
| D | 4 | 160 | 413 | 6.71 | 150 | 137 | 41.1 |
| D | 10 | 189 | 411 | 6.66 | 150 | 137 | 41.1 |
| D | 6 | 231 | 403 | 6.47 | 150 | 137 | 41.1 |
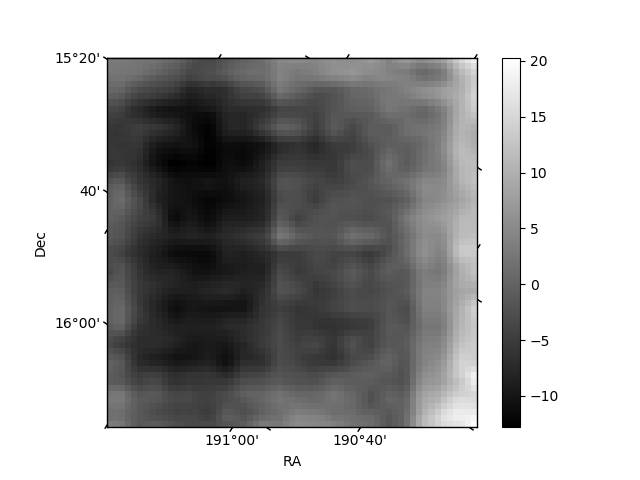
Histogram calculated using DETX and DETY for each event in the final _common_clean file
| Quadrant A |  |
 |
Quadrant B |
|---|---|---|---|
| Quadrant D |  |
 |
Quadrant C |
| Plot type | Count rate plots | Images |
|---|---|---|
| Comparison with Poisson distribution Blue bars denote a histogram of data divided into 1 sec bins. Red curve is a Poisson curve with rate = median count rate of data. |
 |
 |
| Quadrant-wise count rates Data is divided into 100 sec bins |
 |
|
| Module-wise count rates for Quadrant A Data is divided into 100 sec bins |
 |
 |
| Module-wise count rates for Quadrant B Data is divided into 100 sec bins |
 |
 |
| Module-wise count rates for Quadrant C Data is divided into 100 sec bins |
 |
 |
| Module-wise count rates for Quadrant D Data is divided into 100 sec bins |
 |
 |
| Parameter | Plot |
|---|---|
| CZT HV Monitor | 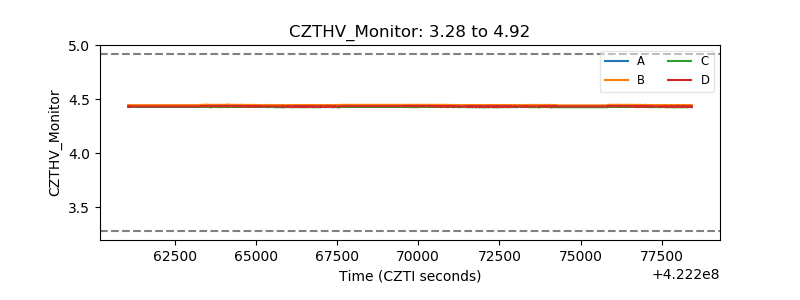 |
| D_VDD |  |
| Temperature 1 |  |
| Veto HV Monitor |  |
| Veto LLD |  |
| Alpha Counter |  |
| _CPM_Rate |  |
| CZT Counter |  |
| +2.5 Volts monitor |  |
| +5 Volts monitor |  |
| _ROLL_ROT |  |
| _Roll_DEC | 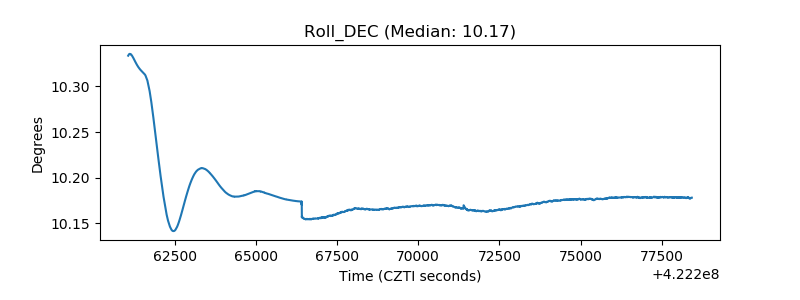 |
| _Roll_RA |  |
| Veto Counter |  |