| Param | Original file | Final file |
|---|---|---|
| Filename | modeM0/AS1T05_106T01_9000005642cztM0_level2.fits | modeM0/AS1T05_106T01_9000005642cztM0_level2_quad_clean.evt |
| Size (bytes) | 536,875,200 | 606,052,800 |
| Size | 512.0 MB | 578.0 MB |
| Events in quadrant A | 3,179,874 | 3,732,657 |
| Events in quadrant B | 3,167,686 | 3,897,884 |
| Events in quadrant C | 3,172,346 | 3,633,146 |
| Events in quadrant D | 2,526,386 | 2,884,349 |
| Mode M0 | |||
|---|---|---|---|
| Quadrant | BADHDUFLAG | Total packets | Discarded packets |
| A | 0 | 151857 | 0 |
| B | 0 | 127681 | 0 |
| C | 0 | 135441 | 0 |
| D | 0 | 221254 | 0 |
| Mode SS | |||
|---|---|---|---|
| Quadrant | BADHDUFLAG | Total packets | Discarded packets |
| A | 0 | 1256 | 0 |
| B | 0 | 1256 | 0 |
| C | 0 | 1256 | 0 |
| D | 0 | 1256 | 0 |
| Mode M9 | |||
|---|---|---|---|
| Quadrant | BADHDUFLAG | Total packets | Discarded packets |
| A | 0 | 238 | 0 |
| B | 0 | 238 | 0 |
| C | 0 | 238 | 0 |
| D | 0 | 238 | 0 |
| Quadrant | Total seconds | Saturated seconds | Saturation percentage |
|---|---|---|---|
| A | 61323 | 2584 | 4.213753% |
| B | 61323 | 112 | 0.182639% |
| C | 61323 | 1707 | 2.783621% |
| D | 61323 | 10305 | 16.804462% |
Noise dominated data is calculated using 1-second bins in cleaned event files. If a bin has >2000 counts, and if more than 50% of those come from <1% of pixels, then it is considered to be noise-dominated and hence unusable.
| Quadrant | # 1 sec bins | Bins with >0 counts | Bins with >2000 counts | High rate bins dominated by noise | Noise dominated (total time) | Noise dominated (detector-on time) | Marked lightcurve |
|---|---|---|---|---|---|---|---|
| A | 85223 | 61280 | 0 | 0 | 0.00% | 0.00% |  |
| B | 85223 | 61323 | 0 | 0 | 0.00% | 0.00% |  |
| C | 85222 | 61092 | 0 | 0 | 0.00% | 0.00% |  |
| D | 85223 | 61094 | 0 | 0 | 0.00% | 0.00% |  |
Top three noisy pixels from each quadrant. If the there are fewer than three noisy pixels in the level2.evt file, extra rows are filled as -1
| Pixel properties | Quadrant properties | ||||||
|---|---|---|---|---|---|---|---|
| Quadrant | DetID | PixID | Counts | Sigma | Mean | Median | Sigma |
| A | 9 | 19 | 2549 | 8.52 | 829 | 778 | 208.0 |
| A | 7 | 110 | 2546 | 8.5 | 829 | 778 | 208.0 |
| A | 0 | 29 | 2431 | 7.95 | 829 | 778 | 208.0 |
| B | 2 | 9 | 2669 | 11.51 | 837 | 797 | 162.7 |
| B | 3 | 80 | 2275 | 9.09 | 837 | 797 | 162.7 |
| B | 2 | 8 | 2238 | 8.86 | 837 | 797 | 162.7 |
| C | 1 | 81 | 2579 | 8.28 | 839 | 786 | 216.6 |
| C | 3 | 203 | 2477 | 7.81 | 839 | 786 | 216.6 |
| C | 3 | 202 | 2475 | 7.8 | 839 | 786 | 216.6 |
| D | 10 | 189 | 1961 | 6.71 | 724 | 660 | 194.0 |
| D | 7 | 3 | 1868 | 6.23 | 724 | 660 | 194.0 |
| D | 6 | 67 | 1864 | 6.21 | 724 | 660 | 194.0 |
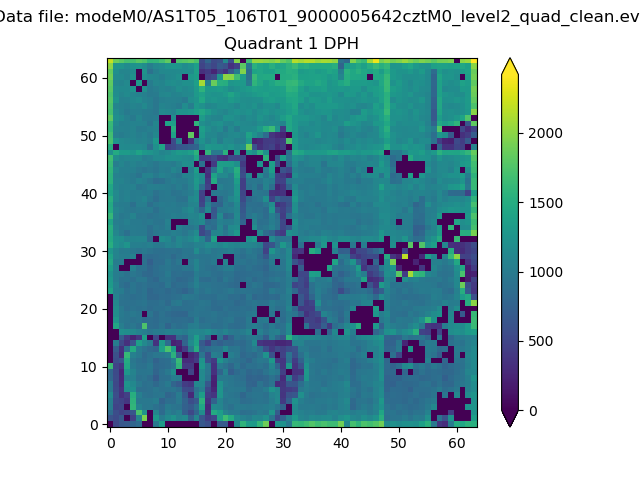
Histogram calculated using DETX and DETY for each event in the final _common_clean file
| Quadrant A |  |
 |
Quadrant B |
|---|---|---|---|
| Quadrant D | 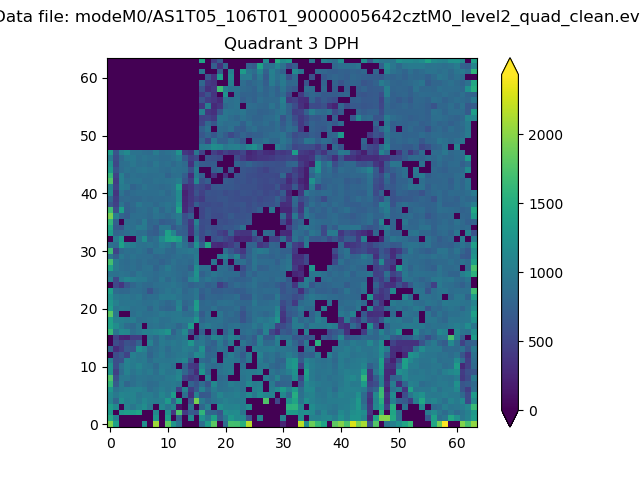 |
 |
Quadrant C |
| Plot type | Count rate plots | Images |
|---|---|---|
| Comparison with Poisson distribution Blue bars denote a histogram of data divided into 1 sec bins. Red curve is a Poisson curve with rate = median count rate of data. |
 |
 |
| Quadrant-wise count rates Data is divided into 100 sec bins |
 |
|
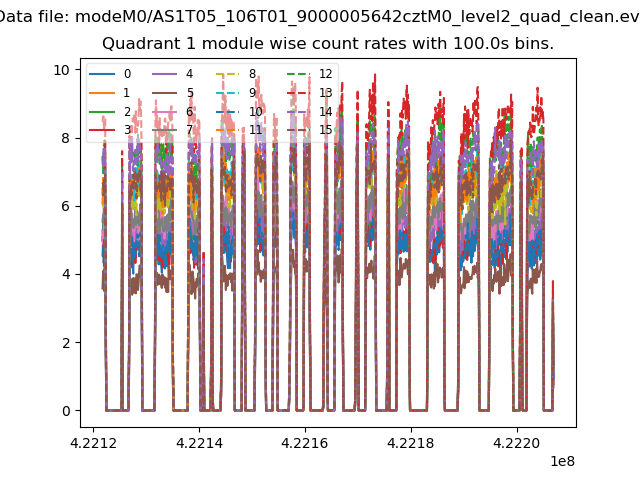
| Module-wise count rates for Quadrant A Data is divided into 100 sec bins |
 |
 |
| Module-wise count rates for Quadrant B Data is divided into 100 sec bins |
 |
 |
| Module-wise count rates for Quadrant C Data is divided into 100 sec bins |
 |
 |
| Module-wise count rates for Quadrant D Data is divided into 100 sec bins |
 |
 |
| Parameter | Plot |
|---|---|
| CZT HV Monitor |  |
| D_VDD |  |
| Temperature 1 |  |
| Veto HV Monitor | 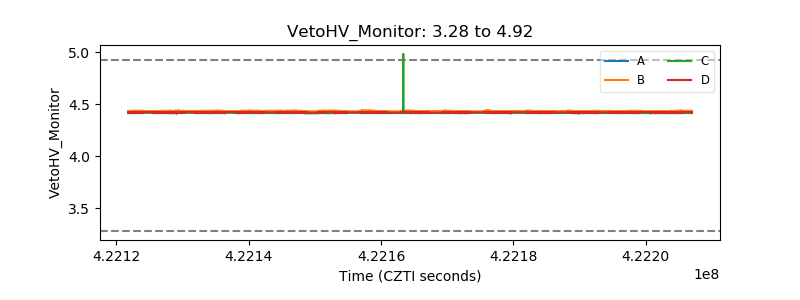 |
| Veto LLD |  |
| Alpha Counter |  |
| _CPM_Rate |  |
| CZT Counter |  |
| +2.5 Volts monitor |  |
| +5 Volts monitor | 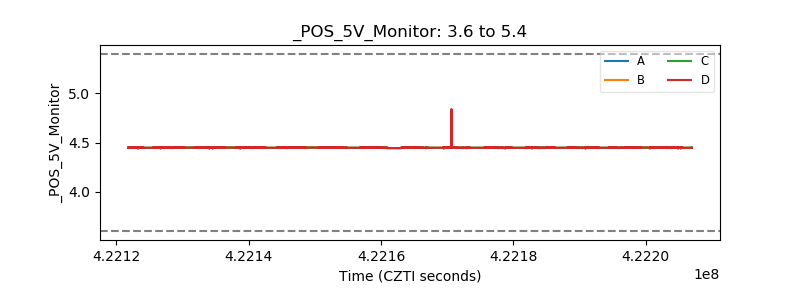 |
| _ROLL_ROT |  |
| _Roll_DEC | 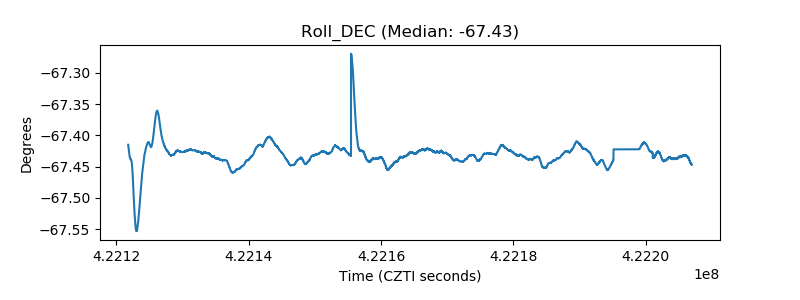 |
| _Roll_RA | 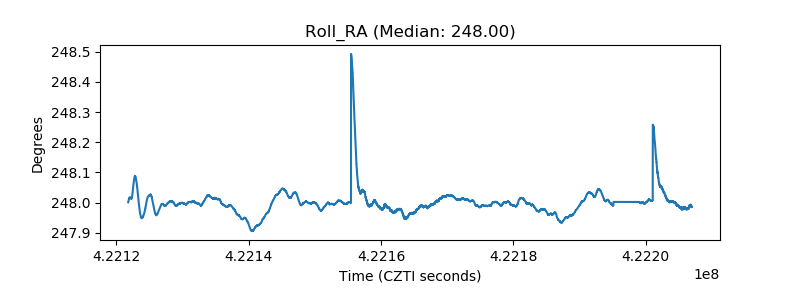 |
| Veto Counter | 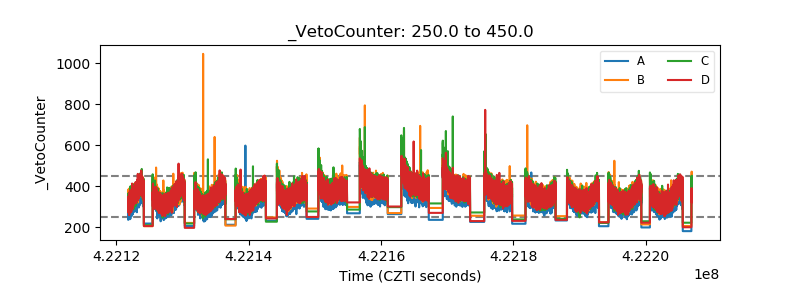 |