| Param | Original file | Final file |
|---|---|---|
| Filename | modeM0/AS1T05_102T01_9000005634cztM0_level2.fits | modeM0/AS1T05_102T01_9000005634cztM0_level2_quad_clean.evt |
| Size (bytes) | 668,203,200 | 619,963,200 |
| Size | 637.2 MB | 591.2 MB |
| Events in quadrant A | 3,963,260 | 3,460,207 |
| Events in quadrant B | 3,852,476 | 3,628,038 |
| Events in quadrant C | 3,936,772 | 3,468,149 |
| Events in quadrant D | 3,435,330 | 3,172,557 |
| Mode M9 | |||
|---|---|---|---|
| Quadrant | BADHDUFLAG | Total packets | Discarded packets |
| A | 0 | 280 | 0 |
| B | 0 | 280 | 0 |
| C | 0 | 280 | 0 |
| D | 0 | 280 | 0 |
| Mode M0 | |||
|---|---|---|---|
| Quadrant | BADHDUFLAG | Total packets | Discarded packets |
| A | 0 | 202061 | 0 |
| B | 0 | 170907 | 0 |
| C | 0 | 175174 | 0 |
| D | 0 | 177393 | 0 |
| Mode SS | |||
|---|---|---|---|
| Quadrant | BADHDUFLAG | Total packets | Discarded packets |
| A | 0 | 1506 | 0 |
| B | 0 | 1506 | 0 |
| C | 0 | 1506 | 0 |
| D | 0 | 1506 | 0 |
| Quadrant | Total seconds | Saturated seconds | Saturation percentage |
|---|---|---|---|
| A | 73582 | 3390 | 4.607105% |
| B | 73583 | 1621 | 2.202954% |
| C | 73583 | 1322 | 1.796611% |
| D | 73583 | 2126 | 2.889254% |
Noise dominated data is calculated using 1-second bins in cleaned event files. If a bin has >2000 counts, and if more than 50% of those come from <1% of pixels, then it is considered to be noise-dominated and hence unusable.
| Quadrant | # 1 sec bins | Bins with >0 counts | Bins with >2000 counts | High rate bins dominated by noise | Noise dominated (total time) | Noise dominated (detector-on time) | Marked lightcurve |
|---|---|---|---|---|---|---|---|
| A | 101705 | 73537 | 0 | 0 | 0.00% | 0.00% |  |
| B | 101705 | 73578 | 0 | 0 | 0.00% | 0.00% |  |
| C | 101705 | 73542 | 0 | 0 | 0.00% | 0.00% |  |
| D | 101705 | 73464 | 0 | 0 | 0.00% | 0.00% | 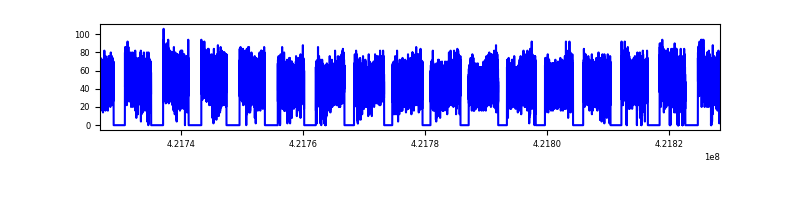 |
Top three noisy pixels from each quadrant. If the there are fewer than three noisy pixels in the level2.evt file, extra rows are filled as -1
| Pixel properties | Quadrant properties | ||||||
|---|---|---|---|---|---|---|---|
| Quadrant | DetID | PixID | Counts | Sigma | Mean | Median | Sigma |
| A | 0 | 29 | 3167 | 8.59 | 1034 | 968 | 256.1 |
| A | 7 | 110 | 3161 | 8.56 | 1034 | 968 | 256.1 |
| A | 9 | 19 | 3158 | 8.55 | 1034 | 968 | 256.1 |
| B | 2 | 9 | 3383 | 12.09 | 1017 | 968 | 199.8 |
| B | 3 | 80 | 2762 | 8.98 | 1017 | 968 | 199.8 |
| B | 3 | 17 | 2749 | 8.92 | 1017 | 968 | 199.8 |
| C | 1 | 81 | 3312 | 8.73 | 1039 | 972 | 268.0 |
| C | 3 | 203 | 3122 | 8.02 | 1039 | 972 | 268.0 |
| C | 1 | 80 | 3103 | 7.95 | 1039 | 972 | 268.0 |
| D | 7 | 3 | 2545 | 6.31 | 982 | 895 | 261.4 |
| D | 10 | 189 | 2538 | 6.29 | 982 | 895 | 261.4 |
| D | 4 | 160 | 2456 | 5.97 | 982 | 895 | 261.4 |
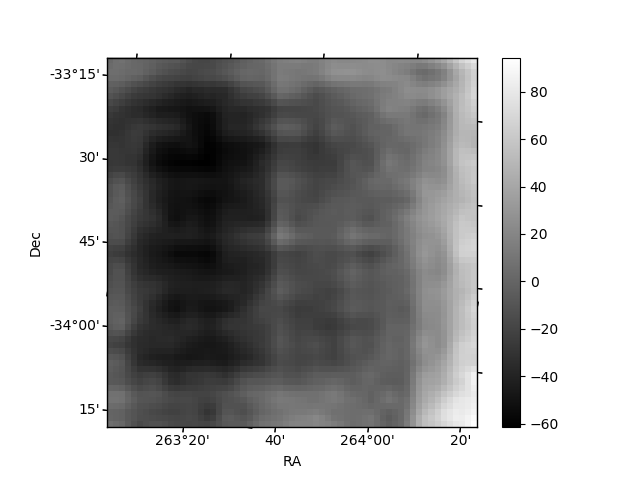
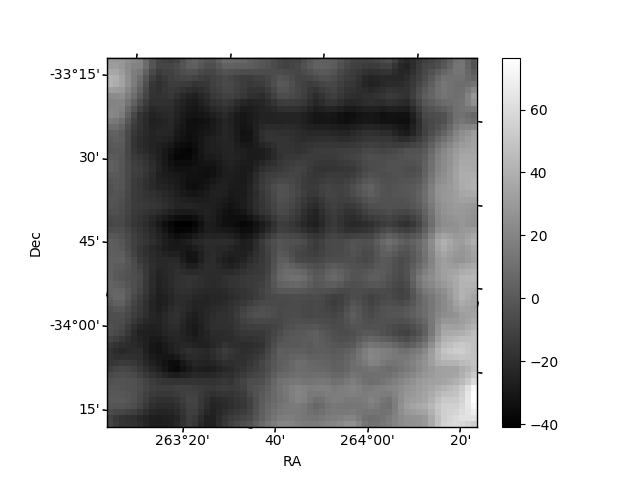
Histogram calculated using DETX and DETY for each event in the final _common_clean file
| Quadrant A |  |
 |
Quadrant B |
|---|---|---|---|
| Quadrant D |  |
 |
Quadrant C |
| Plot type | Count rate plots | Images |
|---|---|---|
| Comparison with Poisson distribution Blue bars denote a histogram of data divided into 1 sec bins. Red curve is a Poisson curve with rate = median count rate of data. |
 |
 |
| Quadrant-wise count rates Data is divided into 100 sec bins |
 |
|
| Module-wise count rates for Quadrant A Data is divided into 100 sec bins |
 |
 |
| Module-wise count rates for Quadrant B Data is divided into 100 sec bins |
 |
 |
| Module-wise count rates for Quadrant C Data is divided into 100 sec bins |
 |
 |
| Module-wise count rates for Quadrant D Data is divided into 100 sec bins |
 |
 |
| Parameter | Plot |
|---|---|
| CZT HV Monitor |  |
| D_VDD |  |
| Temperature 1 |  |
| Veto HV Monitor |  |
| Veto LLD |  |
| Alpha Counter | 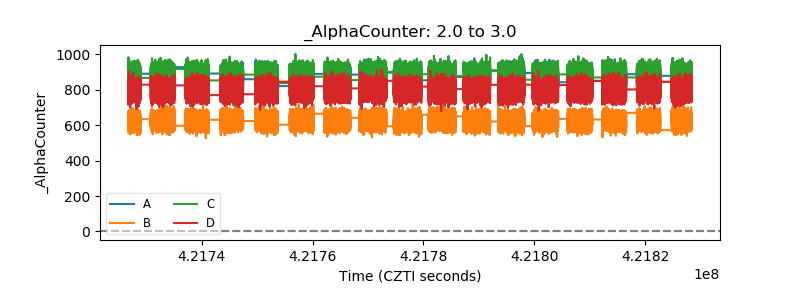 |
| _CPM_Rate |  |
| CZT Counter |  |
| +2.5 Volts monitor |  |
| +5 Volts monitor | 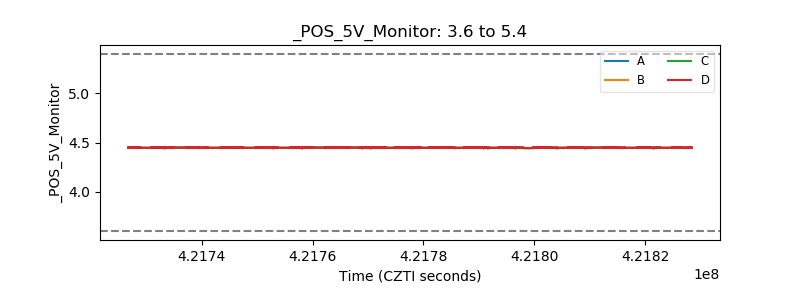 |
| _ROLL_ROT |  |
| _Roll_DEC | 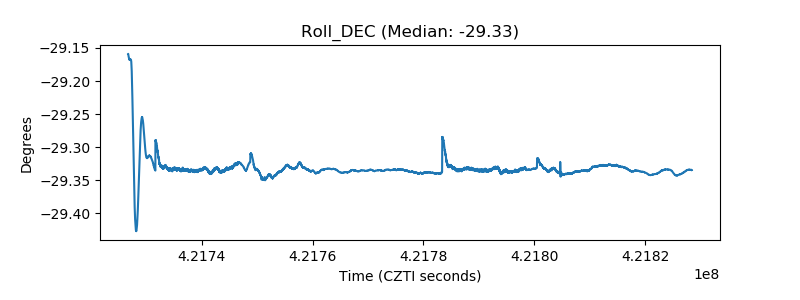 |
| _Roll_RA | 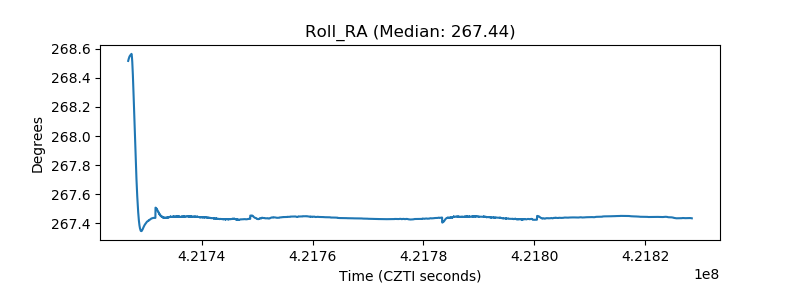 |
| Veto Counter |  |