| Param | Original file | Final file |
|---|---|---|
| Filename | modeM0/AS1A12_089T09_9000005630cztM0_level2.fits | modeM0/AS1A12_089T09_9000005630cztM0_level2_quad_clean.evt |
| Size (bytes) | 50,163,840 | 54,311,040 |
| Size | 47.8 MB | 51.8 MB |
| Events in quadrant A | 294,098 | 321,123 |
| Events in quadrant B | 281,348 | 324,185 |
| Events in quadrant C | 290,284 | 308,339 |
| Events in quadrant D | 251,934 | 288,468 |
| Mode M0 | |||
|---|---|---|---|
| Quadrant | BADHDUFLAG | Total packets | Discarded packets |
| A | 0 | 12165 | 0 |
| B | 0 | 13643 | 0 |
| C | 0 | 11881 | 0 |
| D | 0 | 13649 | 0 |
| Mode M9 | |||
|---|---|---|---|
| Quadrant | BADHDUFLAG | Total packets | Discarded packets |
| A | 0 | 14 | 0 |
| B | 0 | 14 | 0 |
| C | 0 | 14 | 0 |
| D | 0 | 14 | 0 |
| Mode SS | |||
|---|---|---|---|
| Quadrant | BADHDUFLAG | Total packets | Discarded packets |
| A | 0 | 118 | 0 |
| B | 0 | 118 | 0 |
| C | 0 | 118 | 0 |
| D | 0 | 118 | 0 |
| Quadrant | Total seconds | Saturated seconds | Saturation percentage |
|---|---|---|---|
| A | 5743 | 10 | 0.174125% |
| B | 5743 | 89 | 1.549713% |
| C | 5743 | 40 | 0.696500% |
| D | 5743 | 48 | 0.835800% |
Noise dominated data is calculated using 1-second bins in cleaned event files. If a bin has >2000 counts, and if more than 50% of those come from <1% of pixels, then it is considered to be noise-dominated and hence unusable.
| Quadrant | # 1 sec bins | Bins with >0 counts | Bins with >2000 counts | High rate bins dominated by noise | Noise dominated (total time) | Noise dominated (detector-on time) | Marked lightcurve |
|---|---|---|---|---|---|---|---|
| A | 7146 | 5743 | 0 | 0 | 0.00% | 0.00% |  |
| B | 7146 | 5743 | 0 | 0 | 0.00% | 0.00% |  |
| C | 7146 | 5743 | 0 | 0 | 0.00% | 0.00% | 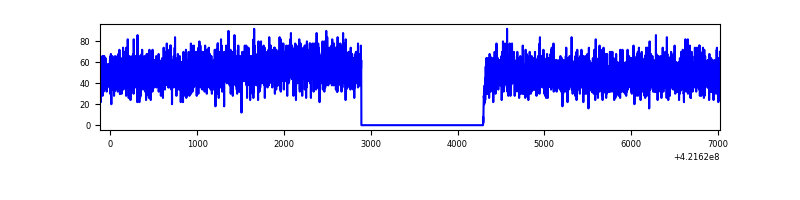 |
| D | 7146 | 5743 | 0 | 0 | 0.00% | 0.00% |  |
Top three noisy pixels from each quadrant. If the there are fewer than three noisy pixels in the level2.evt file, extra rows are filled as -1
| Pixel properties | Quadrant properties | ||||||
|---|---|---|---|---|---|---|---|
| Quadrant | DetID | PixID | Counts | Sigma | Mean | Median | Sigma |
| A | 14 | 95 | 255 | 8.43 | 76 | 72 | 21.7 |
| A | 7 | 110 | 244 | 7.92 | 76 | 72 | 21.7 |
| A | 9 | 19 | 237 | 7.6 | 76 | 72 | 21.7 |
| B | 2 | 9 | 246 | 10.03 | 74 | 70 | 17.5 |
| B | 5 | 232 | 207 | 7.81 | 74 | 70 | 17.5 |
| B | 5 | 128 | 202 | 7.52 | 74 | 70 | 17.5 |
| C | 3 | 202 | 254 | 8.42 | 76 | 72 | 21.6 |
| C | 1 | 81 | 251 | 8.28 | 76 | 72 | 21.6 |
| C | 1 | 80 | 244 | 7.96 | 76 | 72 | 21.6 |
| D | 10 | 189 | 199 | 6.36 | 71 | 65 | 21.1 |
| D | 15 | 47 | 192 | 6.02 | 71 | 65 | 21.1 |
| D | 6 | 8 | 188 | 5.84 | 71 | 65 | 21.1 |
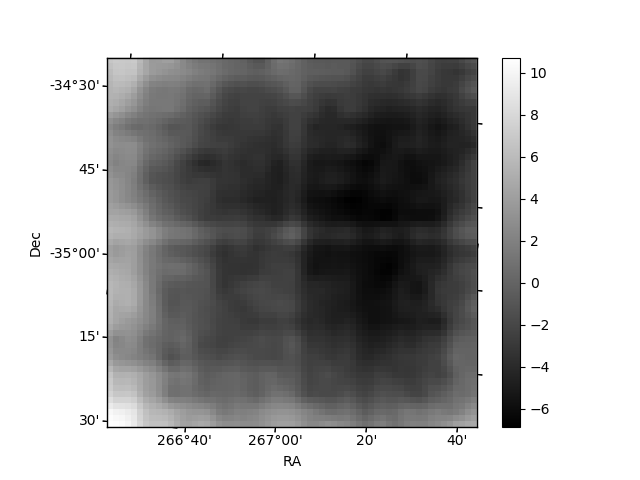
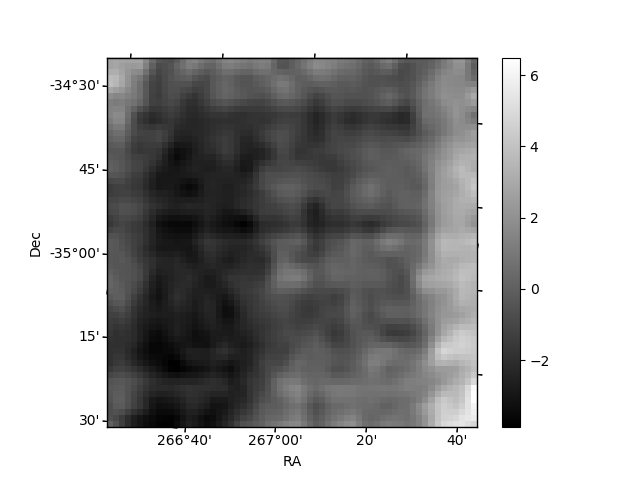
Histogram calculated using DETX and DETY for each event in the final _common_clean file
| Quadrant A |  |
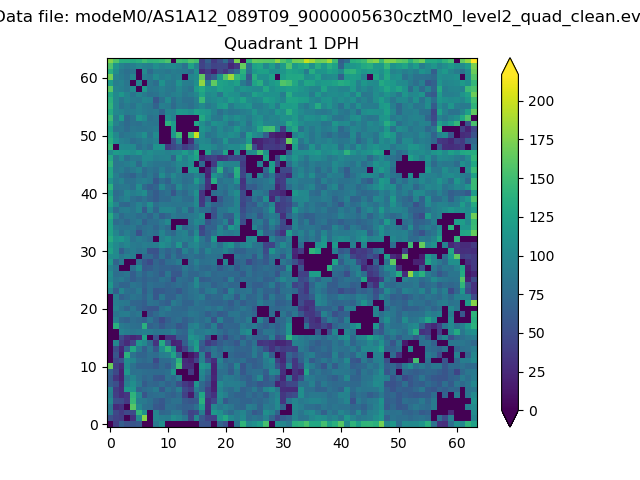 |
Quadrant B |
|---|---|---|---|
| Quadrant D |  |
 |
Quadrant C |
| Plot type | Count rate plots | Images |
|---|---|---|
| Comparison with Poisson distribution Blue bars denote a histogram of data divided into 1 sec bins. Red curve is a Poisson curve with rate = median count rate of data. |
 |
 |
| Quadrant-wise count rates Data is divided into 100 sec bins |
 |
|
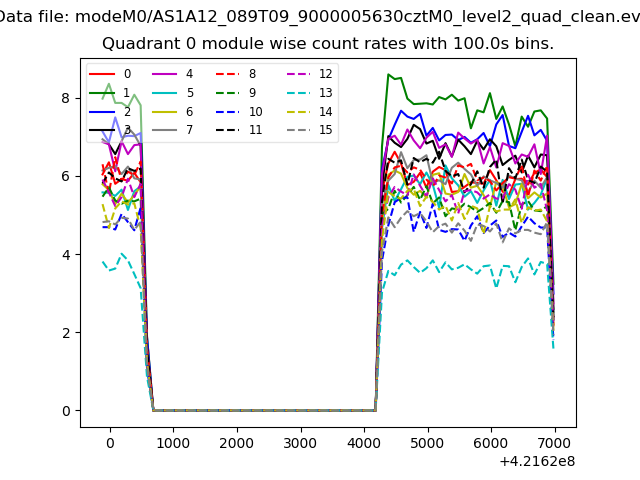
| Module-wise count rates for Quadrant A Data is divided into 100 sec bins |
 |
 |
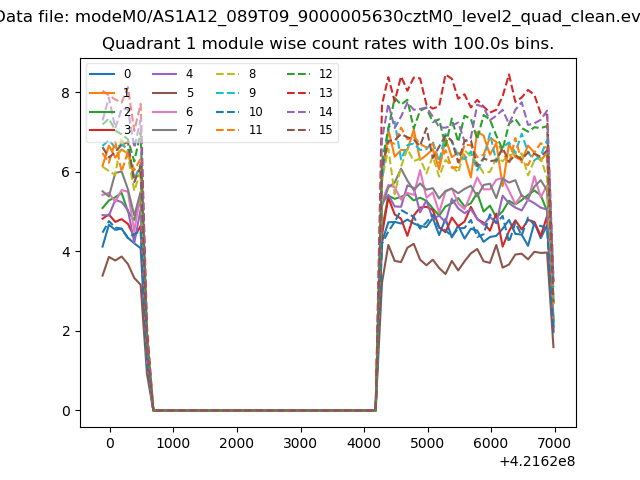
| Module-wise count rates for Quadrant B Data is divided into 100 sec bins |
 |
 |
| Module-wise count rates for Quadrant C Data is divided into 100 sec bins |
 |
 |
| Module-wise count rates for Quadrant D Data is divided into 100 sec bins |
 |
 |
| Parameter | Plot |
|---|---|
| CZT HV Monitor | 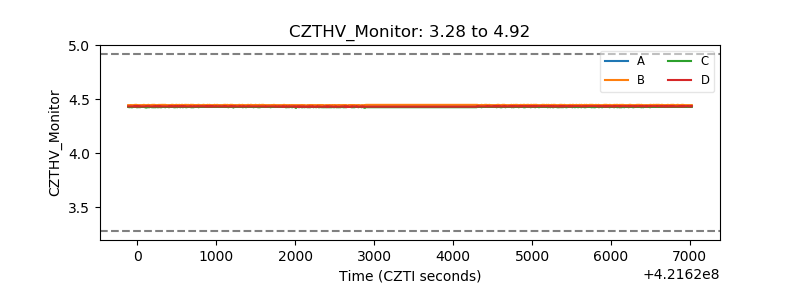 |
| D_VDD | 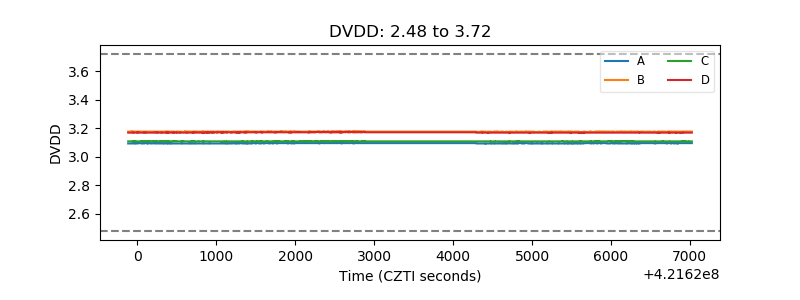 |
| Temperature 1 |  |
| Veto HV Monitor |  |
| Veto LLD |  |
| Alpha Counter |  |
| _CPM_Rate |  |
| CZT Counter | 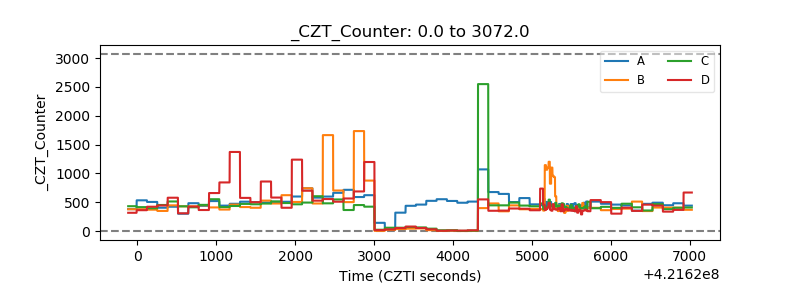 |
| +2.5 Volts monitor |  |
| +5 Volts monitor |  |
| _ROLL_ROT |  |
| _Roll_DEC |  |
| _Roll_RA |  |
| Veto Counter |  |