| Param | Original file | Final file |
|---|---|---|
| Filename | modeM0/AS1A12_052T04_9000005602cztM0_level2.fits | modeM0/AS1A12_052T04_9000005602cztM0_level2_quad_clean.evt |
| Size (bytes) | 1,431,339,840 | 1,532,940,480 |
| Size | 1.3 GB | 1.4 GB |
| Events in quadrant A | 8,672,132 | 9,464,385 |
| Events in quadrant B | 8,022,698 | 9,033,727 |
| Events in quadrant C | 8,437,214 | 8,823,958 |
| Events in quadrant D | 7,290,388 | 8,186,824 |
| Mode M0 | |||
|---|---|---|---|
| Quadrant | BADHDUFLAG | Total packets | Discarded packets |
| A | 0 | 344060 | 0 |
| B | 0 | 443923 | 0 |
| C | 0 | 347403 | 0 |
| D | 0 | 417452 | 0 |
| Mode M9 | |||
|---|---|---|---|
| Quadrant | BADHDUFLAG | Total packets | Discarded packets |
| A | 0 | 618 | 0 |
| B | 0 | 618 | 0 |
| C | 0 | 618 | 0 |
| D | 0 | 618 | 0 |
| Mode SS | |||
|---|---|---|---|
| Quadrant | BADHDUFLAG | Total packets | Discarded packets |
| A | 0 | 3260 | 0 |
| B | 0 | 3260 | 0 |
| C | 0 | 3260 | 0 |
| D | 0 | 3260 | 0 |
| Quadrant | Total seconds | Saturated seconds | Saturation percentage |
|---|---|---|---|
| A | 159363 | 369 | 0.231547% |
| B | 159370 | 11782 | 7.392859% |
| C | 159375 | 1349 | 0.846431% |
| D | 159379 | 5620 | 3.526186% |
Noise dominated data is calculated using 1-second bins in cleaned event files. If a bin has >2000 counts, and if more than 50% of those come from <1% of pixels, then it is considered to be noise-dominated and hence unusable.
| Quadrant | # 1 sec bins | Bins with >0 counts | Bins with >2000 counts | High rate bins dominated by noise | Noise dominated (total time) | Noise dominated (detector-on time) | Marked lightcurve |
|---|---|---|---|---|---|---|---|
| A | 219621 | 159384 | 0 | 0 | 0.00% | 0.00% |  |
| B | 219621 | 159375 | 0 | 0 | 0.00% | 0.00% | 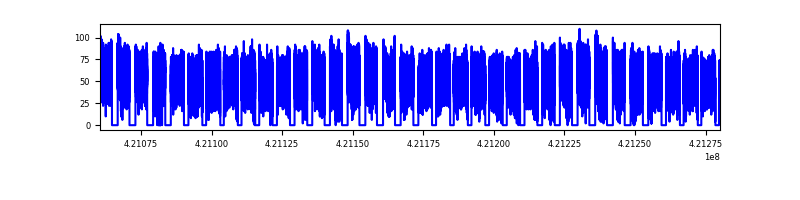 |
| C | 219621 | 159367 | 0 | 0 | 0.00% | 0.00% |  |
| D | 219621 | 159271 | 0 | 0 | 0.00% | 0.00% |  |
Top three noisy pixels from each quadrant. If the there are fewer than three noisy pixels in the level2.evt file, extra rows are filled as -1
| Pixel properties | Quadrant properties | ||||||
|---|---|---|---|---|---|---|---|
| Quadrant | DetID | PixID | Counts | Sigma | Mean | Median | Sigma |
| A | 7 | 110 | 7280 | 9.25 | 2266 | 2128 | 557.0 |
| A | 9 | 19 | 7138 | 8.99 | 2266 | 2128 | 557.0 |
| A | 0 | 29 | 6936 | 8.63 | 2266 | 2128 | 557.0 |
| B | 2 | 9 | 6773 | 11.5 | 2120 | 2018 | 413.6 |
| B | 3 | 80 | 5726 | 8.97 | 2120 | 2018 | 413.6 |
| B | 3 | 17 | 5509 | 8.44 | 2120 | 2018 | 413.6 |
| C | 1 | 81 | 6997 | 8.66 | 2228 | 2086 | 567.3 |
| C | 1 | 80 | 6684 | 8.1 | 2228 | 2086 | 567.3 |
| C | 3 | 202 | 6654 | 8.05 | 2228 | 2086 | 567.3 |
| D | 10 | 113 | 5353 | 6.27 | 2085 | 1899 | 551.3 |
| D | 7 | 3 | 5317 | 6.2 | 2085 | 1899 | 551.3 |
| D | 6 | 231 | 5314 | 6.19 | 2085 | 1899 | 551.3 |
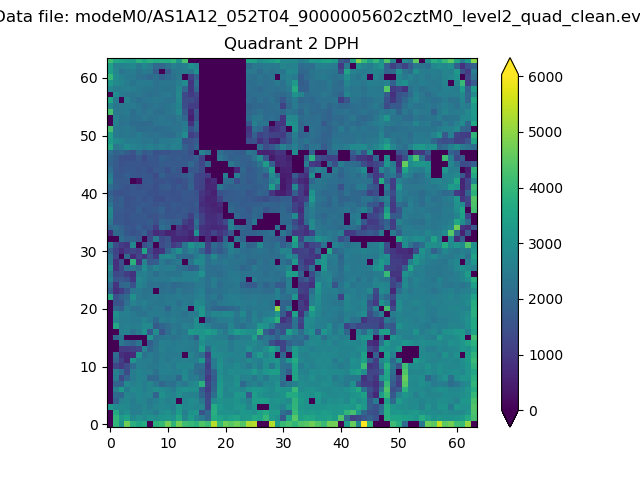
Histogram calculated using DETX and DETY for each event in the final _common_clean file
| Quadrant A |  |
 |
Quadrant B |
|---|---|---|---|
| Quadrant D |  |
 |
Quadrant C |
| Plot type | Count rate plots | Images |
|---|---|---|
| Comparison with Poisson distribution Blue bars denote a histogram of data divided into 1 sec bins. Red curve is a Poisson curve with rate = median count rate of data. |
 |
 |
| Quadrant-wise count rates Data is divided into 100 sec bins |
 |
|
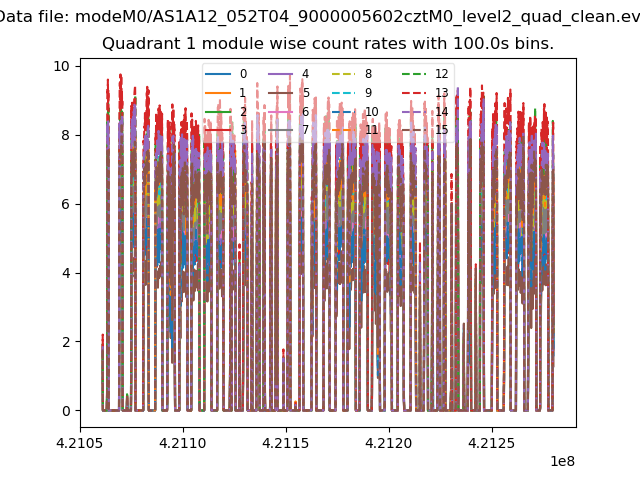
| Module-wise count rates for Quadrant A Data is divided into 100 sec bins |
 |
 |
| Module-wise count rates for Quadrant B Data is divided into 100 sec bins |
 |
 |
| Module-wise count rates for Quadrant C Data is divided into 100 sec bins |
 |
 |
| Module-wise count rates for Quadrant D Data is divided into 100 sec bins |
 |
 |
| Parameter | Plot |
|---|---|
| CZT HV Monitor | 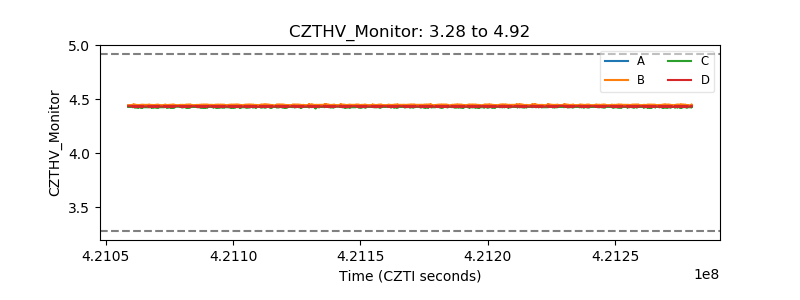 |
| D_VDD |  |
| Temperature 1 |  |
| Veto HV Monitor |  |
| Veto LLD |  |
| Alpha Counter | 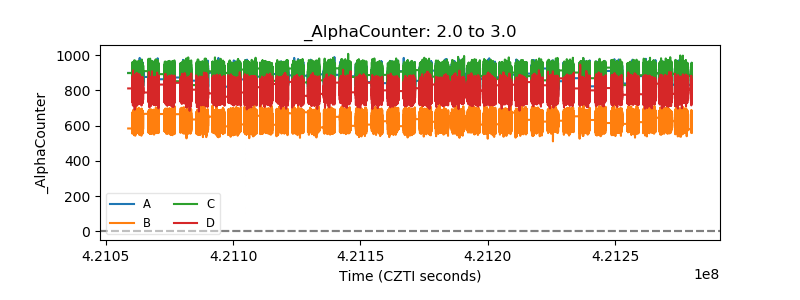 |
| _CPM_Rate |  |
| CZT Counter |  |
| +2.5 Volts monitor | 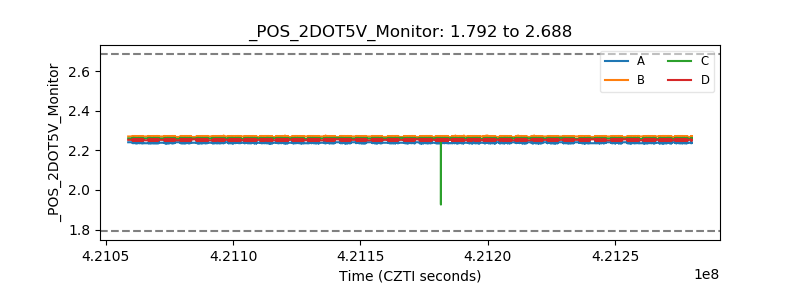 |
| +5 Volts monitor |  |
| _ROLL_ROT |  |
| _Roll_DEC |  |
| _Roll_RA |  |
| Veto Counter | 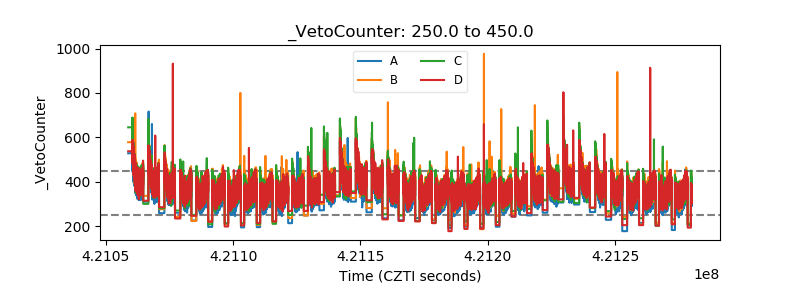 |