| Param | Original file | Final file |
|---|---|---|
| Filename | modeM0/AS1A12_044T19_9000005600cztM0_level2.fits | modeM0/AS1A12_044T19_9000005600cztM0_level2_quad_clean.evt |
| Size (bytes) | 449,487,360 | 467,904,960 |
| Size | 428.7 MB | 446.2 MB |
| Events in quadrant A | 2,719,980 | 2,878,512 |
| Events in quadrant B | 2,567,886 | 2,717,694 |
| Events in quadrant C | 2,643,610 | 2,711,071 |
| Events in quadrant D | 2,245,616 | 2,429,667 |
| Mode SS | |||
|---|---|---|---|
| Quadrant | BADHDUFLAG | Total packets | Discarded packets |
| A | 0 | 1022 | 0 |
| B | 0 | 1022 | 0 |
| C | 0 | 1022 | 0 |
| D | 0 | 1022 | 0 |
| Mode M0 | |||
|---|---|---|---|
| Quadrant | BADHDUFLAG | Total packets | Discarded packets |
| A | 0 | 110081 | 0 |
| B | 0 | 124602 | 0 |
| C | 0 | 107399 | 0 |
| D | 0 | 136863 | 0 |
| Mode M9 | |||
|---|---|---|---|
| Quadrant | BADHDUFLAG | Total packets | Discarded packets |
| A | 0 | 173 | 0 |
| B | 0 | 173 | 0 |
| C | 0 | 173 | 0 |
| D | 0 | 173 | 0 |
| Quadrant | Total seconds | Saturated seconds | Saturation percentage |
|---|---|---|---|
| A | 50028 | 234 | 0.467738% |
| B | 50028 | 2160 | 4.317582% |
| C | 50028 | 401 | 0.801551% |
| D | 50028 | 3526 | 7.048053% |
Noise dominated data is calculated using 1-second bins in cleaned event files. If a bin has >2000 counts, and if more than 50% of those come from <1% of pixels, then it is considered to be noise-dominated and hence unusable.
| Quadrant | # 1 sec bins | Bins with >0 counts | Bins with >2000 counts | High rate bins dominated by noise | Noise dominated (total time) | Noise dominated (detector-on time) | Marked lightcurve |
|---|---|---|---|---|---|---|---|
| A | 65945 | 50028 | 0 | 0 | 0.00% | 0.00% | 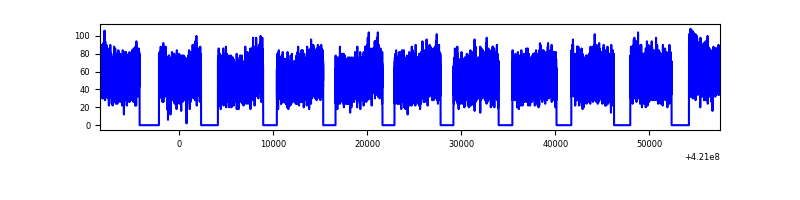 |
| B | 65945 | 50025 | 0 | 0 | 0.00% | 0.00% | 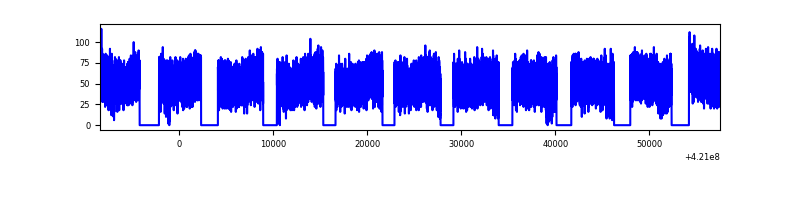 |
| C | 65945 | 50023 | 0 | 0 | 0.00% | 0.00% | 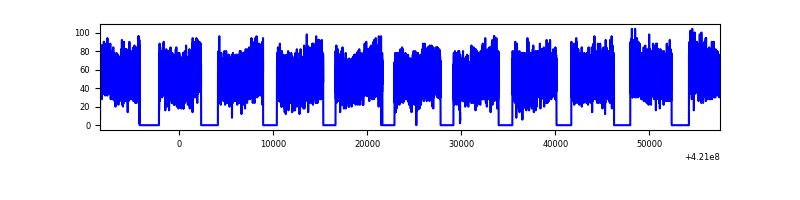 |
| D | 65945 | 49990 | 0 | 0 | 0.00% | 0.00% |  |
Top three noisy pixels from each quadrant. If the there are fewer than three noisy pixels in the level2.evt file, extra rows are filled as -1
| Pixel properties | Quadrant properties | ||||||
|---|---|---|---|---|---|---|---|
| Quadrant | DetID | PixID | Counts | Sigma | Mean | Median | Sigma |
| A | 7 | 110 | 2315 | 9.26 | 709 | 665 | 178.1 |
| A | 0 | 29 | 2183 | 8.52 | 709 | 665 | 178.1 |
| A | 9 | 19 | 2181 | 8.51 | 709 | 665 | 178.1 |
| B | 2 | 9 | 2189 | 11.44 | 677 | 644 | 135.0 |
| B | 3 | 80 | 1813 | 8.66 | 677 | 644 | 135.0 |
| B | 3 | 17 | 1774 | 8.37 | 677 | 644 | 135.0 |
| C | 1 | 81 | 2079 | 7.98 | 697 | 649 | 179.2 |
| C | 1 | 80 | 2046 | 7.8 | 697 | 649 | 179.2 |
| C | 3 | 202 | 2041 | 7.77 | 697 | 649 | 179.2 |
| D | 15 | 46 | 1678 | 6.3 | 642 | 584 | 173.7 |
| D | 10 | 189 | 1675 | 6.28 | 642 | 584 | 173.7 |
| D | 7 | 3 | 1642 | 6.09 | 642 | 584 | 173.7 |
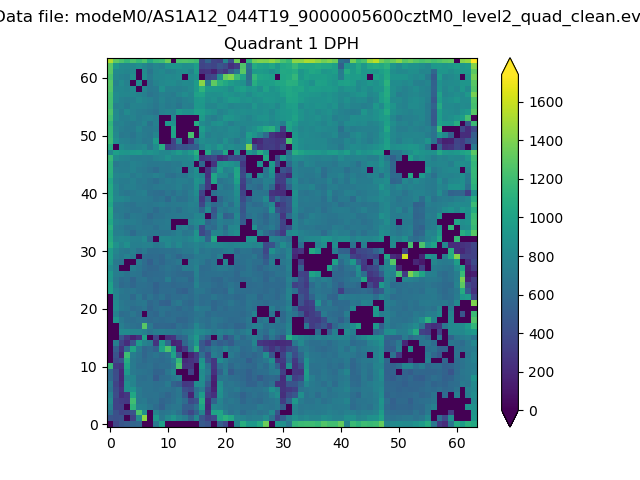
Histogram calculated using DETX and DETY for each event in the final _common_clean file
| Quadrant A | 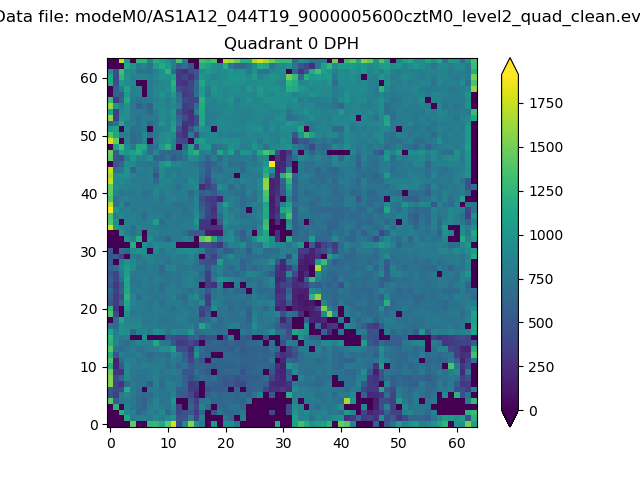 |
 |
Quadrant B |
|---|---|---|---|
| Quadrant D |  |
 |
Quadrant C |
| Plot type | Count rate plots | Images |
|---|---|---|
| Comparison with Poisson distribution Blue bars denote a histogram of data divided into 1 sec bins. Red curve is a Poisson curve with rate = median count rate of data. |
 |
 |
| Quadrant-wise count rates Data is divided into 100 sec bins |
 |
|
| Module-wise count rates for Quadrant A Data is divided into 100 sec bins |
 |
 |
| Module-wise count rates for Quadrant B Data is divided into 100 sec bins |
 |
 |
| Module-wise count rates for Quadrant C Data is divided into 100 sec bins |
 |
 |
| Module-wise count rates for Quadrant D Data is divided into 100 sec bins |
 |
 |
| Parameter | Plot |
|---|---|
| CZT HV Monitor |  |
| D_VDD |  |
| Temperature 1 |  |
| Veto HV Monitor | 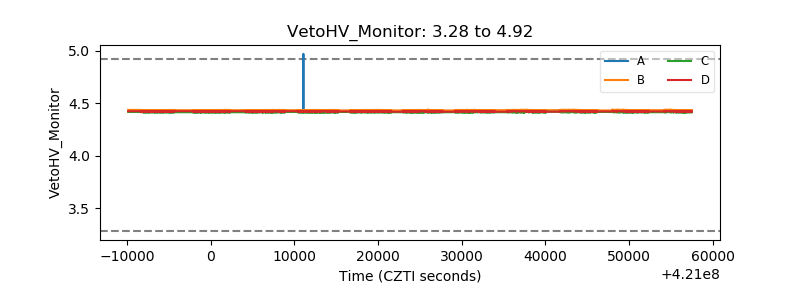 |
| Veto LLD |  |
| Alpha Counter |  |
| _CPM_Rate |  |
| CZT Counter |  |
| +2.5 Volts monitor |  |
| +5 Volts monitor | 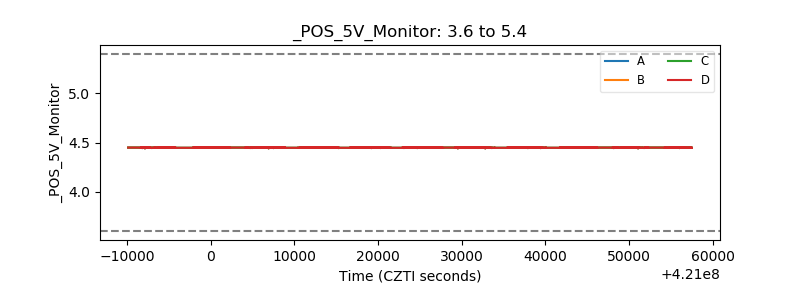 |
| _ROLL_ROT |  |
| _Roll_DEC |  |
| _Roll_RA |  |
| Veto Counter |  |