| Param | Original file | Final file |
|---|---|---|
| Filename | modeM0/AS1A12_093T02_9000005594cztM0_level2.fits | modeM0/AS1A12_093T02_9000005594cztM0_level2_quad_clean.evt |
| Size (bytes) | 200,237,760 | 206,948,160 |
| Size | 191.0 MB | 197.4 MB |
| Events in quadrant A | 1,236,028 | 1,271,065 |
| Events in quadrant B | 1,180,398 | 1,280,117 |
| Events in quadrant C | 1,192,884 | 1,199,071 |
| Events in quadrant D | 1,030,440 | 1,091,814 |
| Mode M0 | |||
|---|---|---|---|
| Quadrant | BADHDUFLAG | Total packets | Discarded packets |
| A | 0 | 46841 | 0 |
| B | 0 | 42963 | 0 |
| C | 0 | 43314 | 0 |
| D | 0 | 54452 | 0 |
| Mode SS | |||
|---|---|---|---|
| Quadrant | BADHDUFLAG | Total packets | Discarded packets |
| A | 0 | 424 | 0 |
| B | 0 | 424 | 0 |
| C | 0 | 424 | 0 |
| D | 0 | 424 | 0 |
| Mode M9 | |||
|---|---|---|---|
| Quadrant | BADHDUFLAG | Total packets | Discarded packets |
| A | 0 | 105 | 0 |
| B | 0 | 105 | 0 |
| C | 0 | 105 | 0 |
| D | 0 | 105 | 0 |
| Quadrant | Total seconds | Saturated seconds | Saturation percentage |
|---|---|---|---|
| A | 20690 | 92 | 0.444659% |
| B | 20690 | 31 | 0.149831% |
| C | 20690 | 103 | 0.497825% |
| D | 20690 | 655 | 3.165781% |
Noise dominated data is calculated using 1-second bins in cleaned event files. If a bin has >2000 counts, and if more than 50% of those come from <1% of pixels, then it is considered to be noise-dominated and hence unusable.
| Quadrant | # 1 sec bins | Bins with >0 counts | Bins with >2000 counts | High rate bins dominated by noise | Noise dominated (total time) | Noise dominated (detector-on time) | Marked lightcurve |
|---|---|---|---|---|---|---|---|
| A | 33516 | 20691 | 0 | 0 | 0.00% | 0.00% | 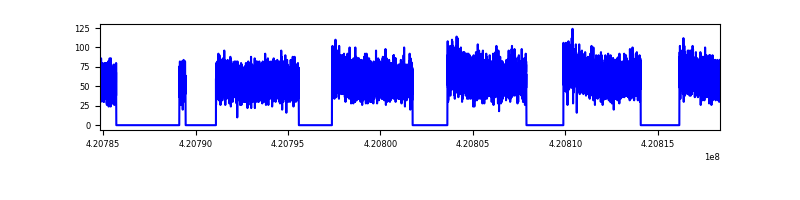 |
| B | 33516 | 20690 | 0 | 0 | 0.00% | 0.00% | 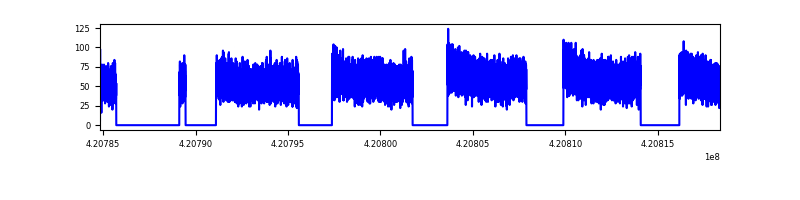 |
| C | 33516 | 20689 | 0 | 0 | 0.00% | 0.00% |  |
| D | 33516 | 20688 | 0 | 0 | 0.00% | 0.00% |  |
Top three noisy pixels from each quadrant. If the there are fewer than three noisy pixels in the level2.evt file, extra rows are filled as -1
| Pixel properties | Quadrant properties | ||||||
|---|---|---|---|---|---|---|---|
| Quadrant | DetID | PixID | Counts | Sigma | Mean | Median | Sigma |
| A | 9 | 19 | 1028 | 8.89 | 322 | 302 | 81.7 |
| A | 7 | 110 | 976 | 8.25 | 322 | 302 | 81.7 |
| A | 14 | 95 | 944 | 7.86 | 322 | 302 | 81.7 |
| B | 2 | 9 | 1004 | 11.22 | 311 | 297 | 63.0 |
| B | 3 | 17 | 815 | 8.22 | 311 | 297 | 63.0 |
| B | 3 | 80 | 813 | 8.19 | 311 | 297 | 63.0 |
| C | 1 | 80 | 970 | 8.2 | 315 | 295 | 82.3 |
| C | 1 | 81 | 967 | 8.17 | 315 | 295 | 82.3 |
| C | 3 | 202 | 915 | 7.53 | 315 | 295 | 82.3 |
| D | 7 | 3 | 797 | 6.69 | 294 | 269 | 79.0 |
| D | 6 | 38 | 741 | 5.98 | 294 | 269 | 79.0 |
| D | 4 | 160 | 738 | 5.94 | 294 | 269 | 79.0 |
Histogram calculated using DETX and DETY for each event in the final _common_clean file
| Quadrant A |  |
 |
Quadrant B |
|---|---|---|---|
| Quadrant D |  |
 |
Quadrant C |
| Plot type | Count rate plots | Images |
|---|---|---|
| Comparison with Poisson distribution Blue bars denote a histogram of data divided into 1 sec bins. Red curve is a Poisson curve with rate = median count rate of data. |
 |
 |
| Quadrant-wise count rates Data is divided into 100 sec bins |
 |
|
| Module-wise count rates for Quadrant A Data is divided into 100 sec bins |
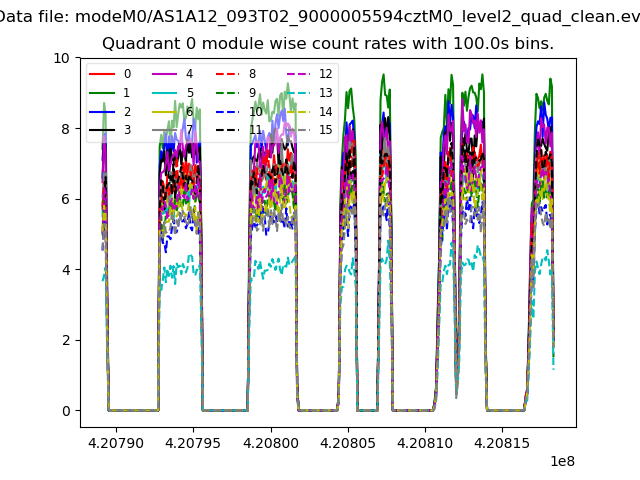 |
 |
| Module-wise count rates for Quadrant B Data is divided into 100 sec bins |
 |
 |
| Module-wise count rates for Quadrant C Data is divided into 100 sec bins |
 |
 |
| Module-wise count rates for Quadrant D Data is divided into 100 sec bins |
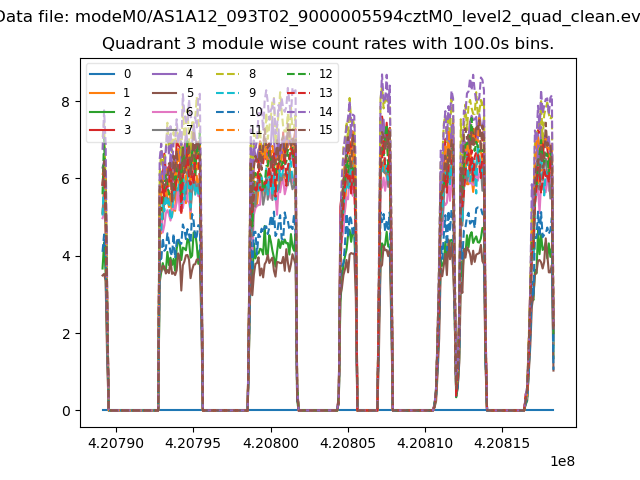 |
 |
| Parameter | Plot |
|---|---|
| CZT HV Monitor | 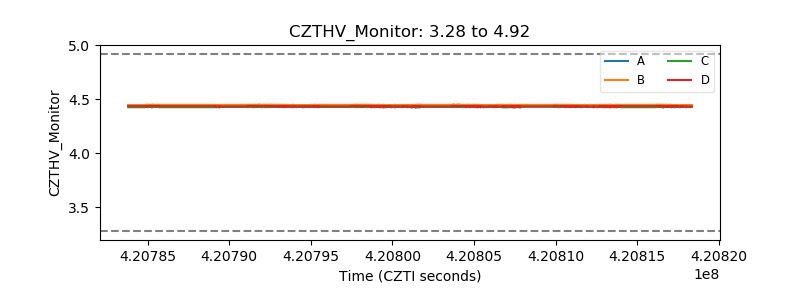 |
| D_VDD |  |
| Temperature 1 |  |
| Veto HV Monitor |  |
| Veto LLD |  |
| Alpha Counter | 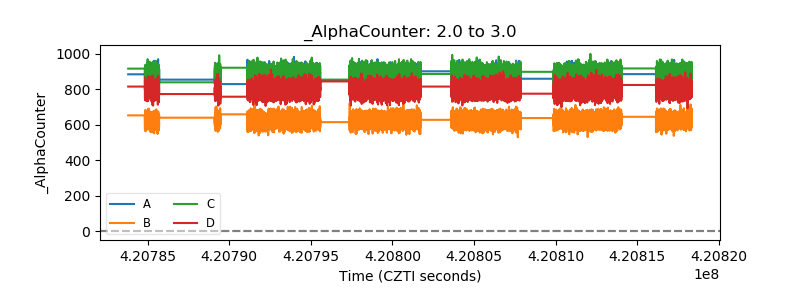 |
| _CPM_Rate |  |
| CZT Counter |  |
| +2.5 Volts monitor | 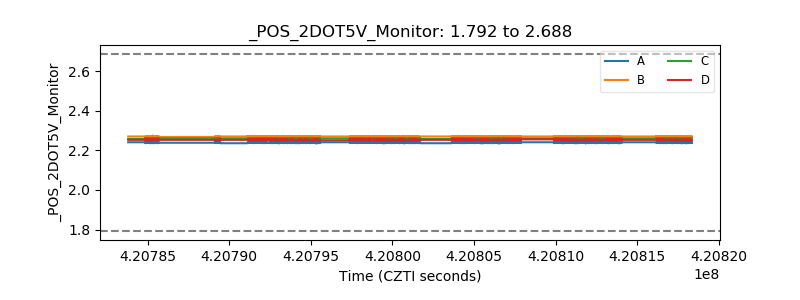 |
| +5 Volts monitor |  |
| _ROLL_ROT |  |
| _Roll_DEC | 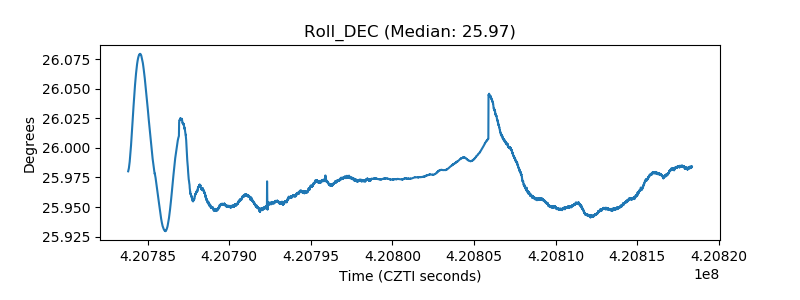 |
| _Roll_RA |  |
| Veto Counter |  |