| Param | Original file | Final file |
|---|---|---|
| Filename | modeM0/AS1A12_042T01_9000005588cztM0_level2.fits | modeM0/AS1A12_042T01_9000005588cztM0_level2_quad_clean.evt |
| Size (bytes) | 222,382,080 | 302,978,880 |
| Size | 212.1 MB | 288.9 MB |
| Events in quadrant A | 1,336,918 | 1,964,182 |
| Events in quadrant B | 1,278,732 | 1,974,064 |
| Events in quadrant C | 1,298,210 | 1,849,977 |
| Events in quadrant D | 1,128,000 | 1,694,863 |
| Mode SS | |||
|---|---|---|---|
| Quadrant | BADHDUFLAG | Total packets | Discarded packets |
| A | 0 | 506 | 0 |
| B | 0 | 506 | 0 |
| C | 0 | 506 | 0 |
| D | 0 | 506 | 0 |
| Mode M0 | |||
|---|---|---|---|
| Quadrant | BADHDUFLAG | Total packets | Discarded packets |
| A | 0 | 52984 | 0 |
| B | 0 | 50622 | 0 |
| C | 0 | 53251 | 0 |
| D | 0 | 57069 | 0 |
| Mode M9 | |||
|---|---|---|---|
| Quadrant | BADHDUFLAG | Total packets | Discarded packets |
| A | 0 | 102 | 0 |
| B | 0 | 102 | 0 |
| C | 0 | 102 | 0 |
| D | 0 | 102 | 0 |
| Quadrant | Total seconds | Saturated seconds | Saturation percentage |
|---|---|---|---|
| A | 24609 | 36 | 0.146288% |
| B | 24609 | 58 | 0.235686% |
| C | 24609 | 81 | 0.329148% |
| D | 24609 | 410 | 1.666057% |
Noise dominated data is calculated using 1-second bins in cleaned event files. If a bin has >2000 counts, and if more than 50% of those come from <1% of pixels, then it is considered to be noise-dominated and hence unusable.
| Quadrant | # 1 sec bins | Bins with >0 counts | Bins with >2000 counts | High rate bins dominated by noise | Noise dominated (total time) | Noise dominated (detector-on time) | Marked lightcurve |
|---|---|---|---|---|---|---|---|
| A | 33482 | 24606 | 0 | 0 | 0.00% | 0.00% |  |
| B | 33483 | 24607 | 0 | 0 | 0.00% | 0.00% |  |
| C | 33482 | 24606 | 0 | 0 | 0.00% | 0.00% |  |
| D | 33483 | 24600 | 0 | 0 | 0.00% | 0.00% |  |
Top three noisy pixels from each quadrant. If the there are fewer than three noisy pixels in the level2.evt file, extra rows are filled as -1
| Pixel properties | Quadrant properties | ||||||
|---|---|---|---|---|---|---|---|
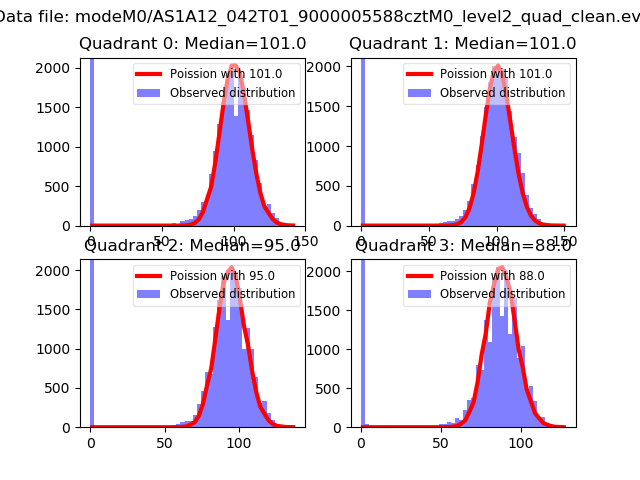
| Quadrant | DetID | PixID | Counts | Sigma | Mean | Median | Sigma |
| A | 7 | 110 | 1106 | 8.89 | 348 | 328 | 87.5 |
| A | 9 | 19 | 1087 | 8.67 | 348 | 328 | 87.5 |
| A | 0 | 29 | 1068 | 8.45 | 348 | 328 | 87.5 |
| B | 2 | 9 | 1084 | 11.33 | 338 | 323 | 67.2 |
| B | 3 | 80 | 901 | 8.6 | 338 | 323 | 67.2 |
| B | 3 | 17 | 896 | 8.53 | 338 | 323 | 67.2 |
| C | 1 | 81 | 1080 | 8.52 | 342 | 321 | 89.1 |
| C | 1 | 80 | 1052 | 8.21 | 342 | 321 | 89.1 |
| C | 1 | 65 | 908 | 6.59 | 342 | 321 | 89.1 |
| D | 6 | 62 | 848 | 6.4 | 322 | 295 | 86.4 |
| D | 7 | 3 | 829 | 6.18 | 322 | 295 | 86.4 |
| D | 10 | 189 | 826 | 6.15 | 322 | 295 | 86.4 |
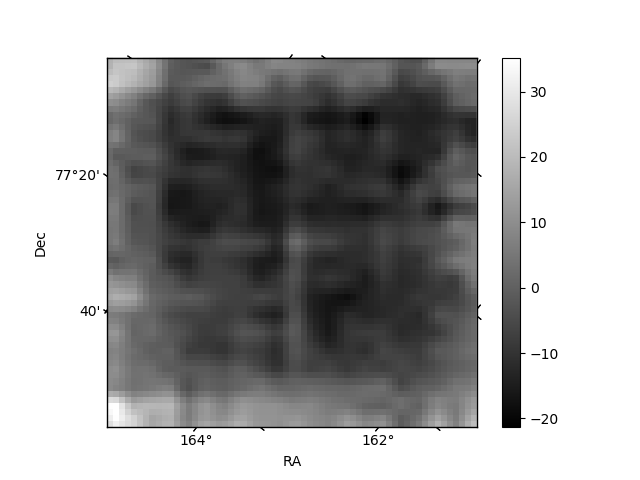
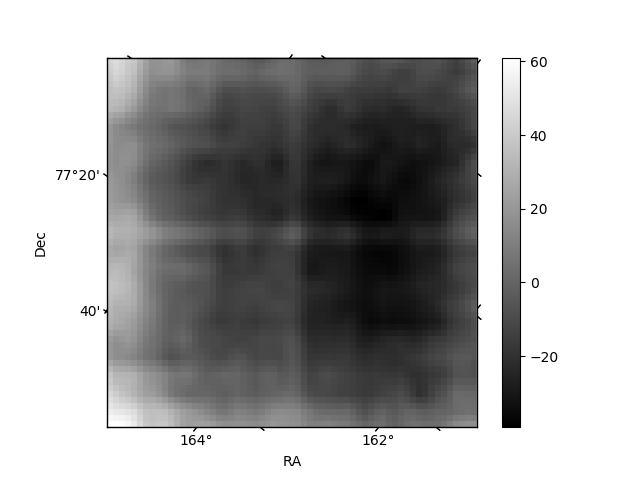
Histogram calculated using DETX and DETY for each event in the final _common_clean file
| Quadrant A |  |
 |
Quadrant B |
|---|---|---|---|
| Quadrant D |  |
 |
Quadrant C |
| Plot type | Count rate plots | Images |
|---|---|---|
| Comparison with Poisson distribution Blue bars denote a histogram of data divided into 1 sec bins. Red curve is a Poisson curve with rate = median count rate of data. |
 |
 |
| Quadrant-wise count rates Data is divided into 100 sec bins |
 |
|
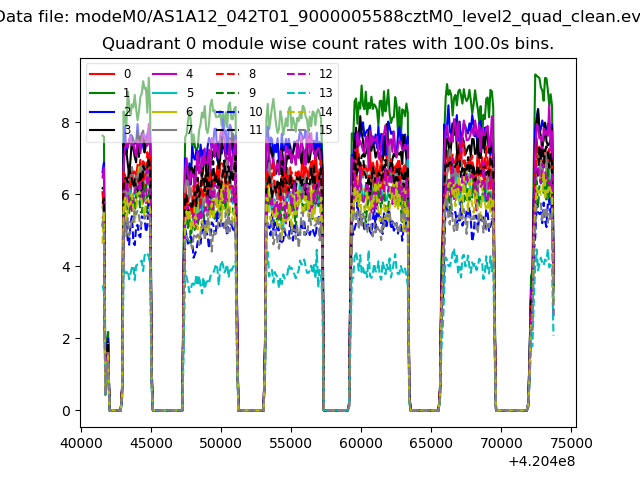
| Module-wise count rates for Quadrant A Data is divided into 100 sec bins |
 |
 |
| Module-wise count rates for Quadrant B Data is divided into 100 sec bins |
 |
 |
| Module-wise count rates for Quadrant C Data is divided into 100 sec bins |
 |
 |
| Module-wise count rates for Quadrant D Data is divided into 100 sec bins |
 |
 |
| Parameter | Plot |
|---|---|
| CZT HV Monitor |  |
| D_VDD |  |
| Temperature 1 |  |
| Veto HV Monitor |  |
| Veto LLD |  |
| Alpha Counter |  |
| _CPM_Rate | 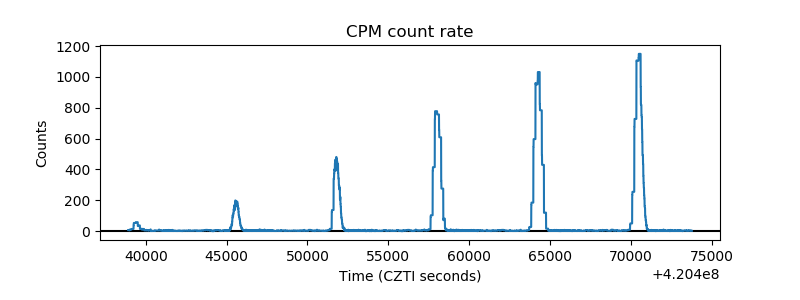 |
| CZT Counter | 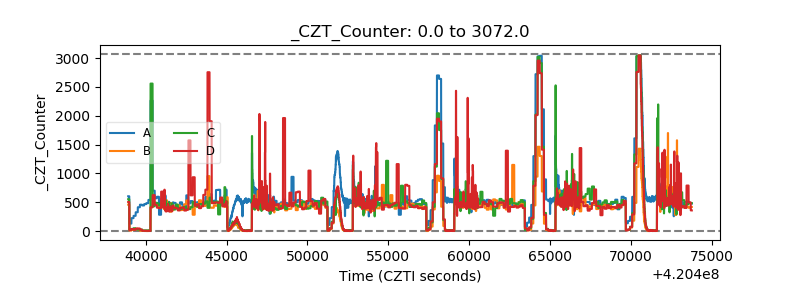 |
| +2.5 Volts monitor |  |
| +5 Volts monitor |  |
| _ROLL_ROT |  |
| _Roll_DEC |  |
| _Roll_RA |  |
| Veto Counter |  |