| Param | Original file | Final file |
|---|---|---|
| Filename | modeM0/AS1T05_101T01_9000005578cztM0_level2.fits | modeM0/AS1T05_101T01_9000005578cztM0_level2_quad_clean.evt |
| Size (bytes) | 147,444,480 | 219,499,200 |
| Size | 140.6 MB | 209.3 MB |
| Events in quadrant A | 872,024 | 1,425,025 |
| Events in quadrant B | 838,442 | 1,441,957 |
| Events in quadrant C | 855,480 | 1,376,462 |
| Events in quadrant D | 724,608 | 1,229,801 |
| Mode M9 | |||
|---|---|---|---|
| Quadrant | BADHDUFLAG | Total packets | Discarded packets |
| A | 0 | 51 | 0 |
| B | 0 | 51 | 0 |
| C | 0 | 51 | 0 |
| D | 0 | 51 | 0 |
| Mode SS | |||
|---|---|---|---|
| Quadrant | BADHDUFLAG | Total packets | Discarded packets |
| A | 0 | 346 | 0 |
| B | 0 | 346 | 0 |
| C | 0 | 346 | 0 |
| D | 0 | 346 | 0 |
| Mode M0 | |||
|---|---|---|---|
| Quadrant | BADHDUFLAG | Total packets | Discarded packets |
| A | 0 | 35740 | 0 |
| B | 0 | 35914 | 0 |
| C | 0 | 37464 | 0 |
| D | 0 | 44472 | 0 |
| Quadrant | Total seconds | Saturated seconds | Saturation percentage |
|---|---|---|---|
| A | 17039 | 21 | 0.123247% |
| B | 17039 | 72 | 0.422560% |
| C | 17039 | 244 | 1.432009% |
| D | 17039 | 690 | 4.049533% |
Noise dominated data is calculated using 1-second bins in cleaned event files. If a bin has >2000 counts, and if more than 50% of those come from <1% of pixels, then it is considered to be noise-dominated and hence unusable.
| Quadrant | # 1 sec bins | Bins with >0 counts | Bins with >2000 counts | High rate bins dominated by noise | Noise dominated (total time) | Noise dominated (detector-on time) | Marked lightcurve |
|---|---|---|---|---|---|---|---|
| A | 22118 | 17039 | 0 | 0 | 0.00% | 0.00% | 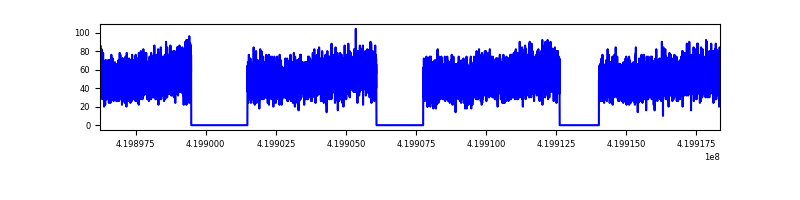 |
| B | 22118 | 17039 | 0 | 0 | 0.00% | 0.00% |  |
| C | 22118 | 17039 | 0 | 0 | 0.00% | 0.00% |  |
| D | 22118 | 17034 | 0 | 0 | 0.00% | 0.00% |  |
Top three noisy pixels from each quadrant. If the there are fewer than three noisy pixels in the level2.evt file, extra rows are filled as -1
| Pixel properties | Quadrant properties | ||||||
|---|---|---|---|---|---|---|---|
| Quadrant | DetID | PixID | Counts | Sigma | Mean | Median | Sigma |
| A | 9 | 19 | 759 | 9.3 | 227 | 214 | 58.6 |
| A | 0 | 29 | 747 | 9.09 | 227 | 214 | 58.6 |
| A | 0 | 30 | 692 | 8.16 | 227 | 214 | 58.6 |
| B | 2 | 9 | 749 | 11.81 | 222 | 212 | 45.5 |
| B | 3 | 17 | 611 | 8.77 | 222 | 212 | 45.5 |
| B | 3 | 80 | 602 | 8.57 | 222 | 212 | 45.5 |
| C | 1 | 80 | 717 | 8.5 | 226 | 212 | 59.4 |
| C | 1 | 81 | 698 | 8.18 | 226 | 212 | 59.4 |
| C | 3 | 203 | 695 | 8.13 | 226 | 212 | 59.4 |
| D | 7 | 3 | 588 | 6.95 | 207 | 188 | 57.5 |
| D | 10 | 189 | 560 | 6.46 | 207 | 188 | 57.5 |
| D | 4 | 160 | 548 | 6.26 | 207 | 188 | 57.5 |
Histogram calculated using DETX and DETY for each event in the final _common_clean file
| Quadrant A | 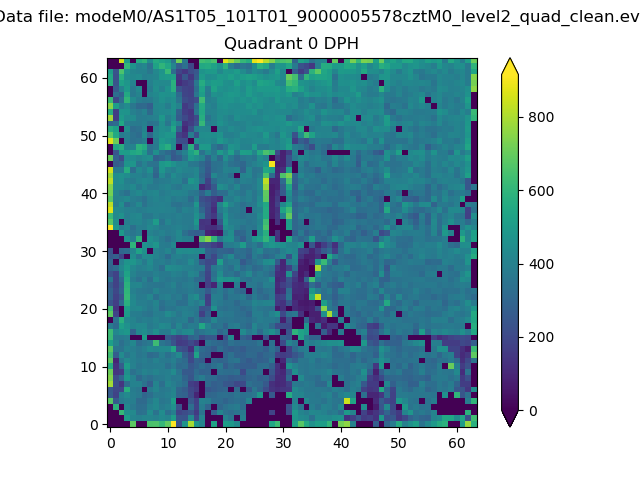 |
 |
Quadrant B |
|---|---|---|---|
| Quadrant D |  |
 |
Quadrant C |
| Plot type | Count rate plots | Images |
|---|---|---|
| Comparison with Poisson distribution Blue bars denote a histogram of data divided into 1 sec bins. Red curve is a Poisson curve with rate = median count rate of data. |
 |
 |
| Quadrant-wise count rates Data is divided into 100 sec bins |
 |
|
| Module-wise count rates for Quadrant A Data is divided into 100 sec bins |
 |
 |
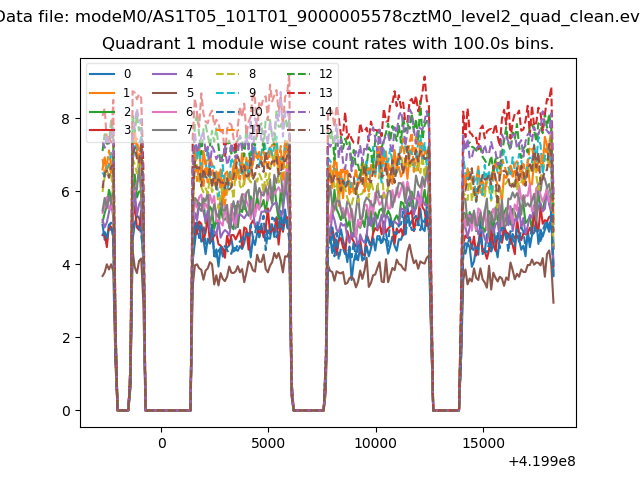
| Module-wise count rates for Quadrant B Data is divided into 100 sec bins |
 |
 |
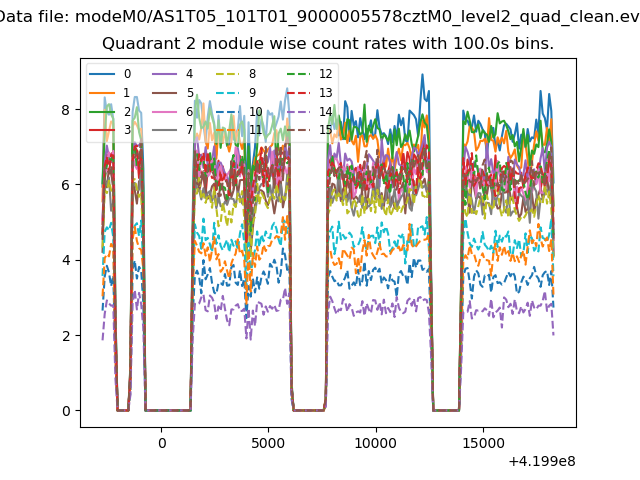
| Module-wise count rates for Quadrant C Data is divided into 100 sec bins |
 |
 |
| Module-wise count rates for Quadrant D Data is divided into 100 sec bins |
 |
 |
| Parameter | Plot |
|---|---|
| CZT HV Monitor |  |
| D_VDD |  |
| Temperature 1 |  |
| Veto HV Monitor | 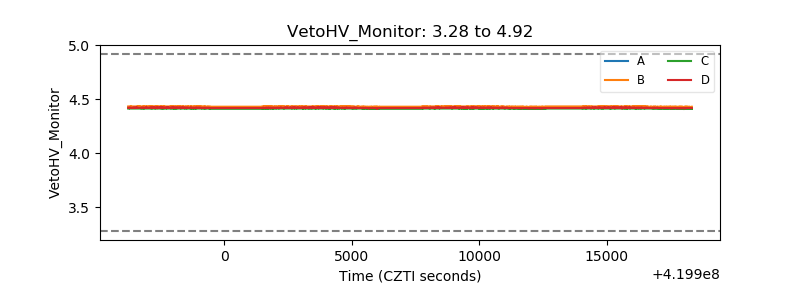 |
| Veto LLD |  |
| Alpha Counter | 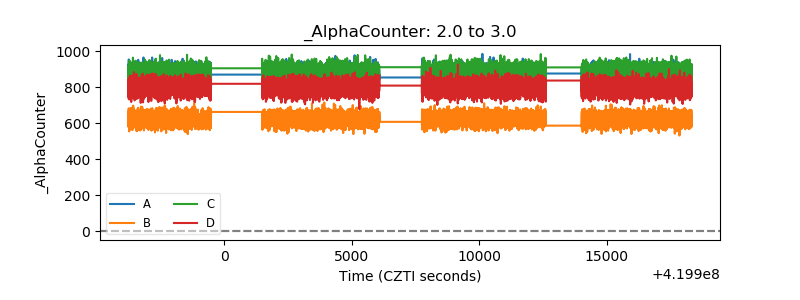 |
| _CPM_Rate |  |
| CZT Counter |  |
| +2.5 Volts monitor |  |
| +5 Volts monitor |  |
| _ROLL_ROT | 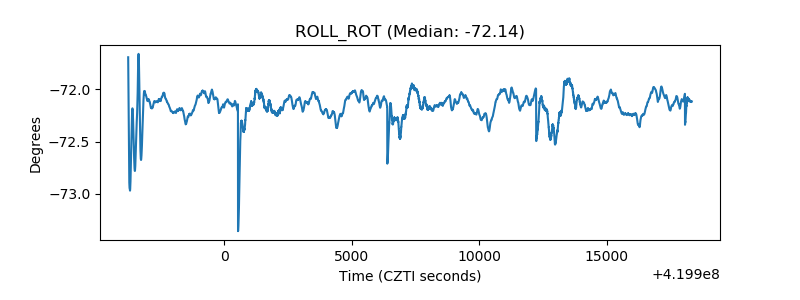 |
| _Roll_DEC | 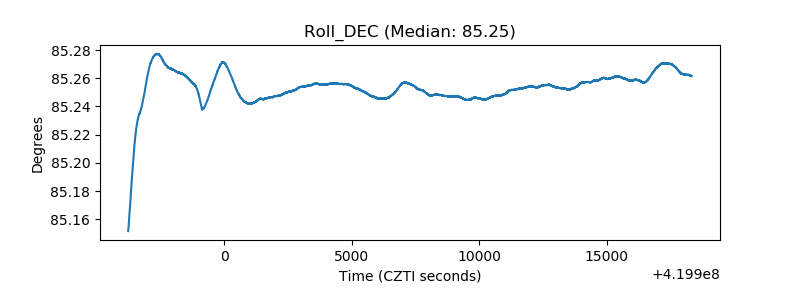 |
| _Roll_RA |  |
| Veto Counter |  |