| Param | Original file | Final file |
|---|---|---|
| Filename | modeM0/AS1A12_104T02_9000005572cztM0_level2.fits | modeM0/AS1A12_104T02_9000005572cztM0_level2_quad_clean.evt |
| Size (bytes) | 1,535,636,160 | 1,561,271,040 |
| Size | 1.4 GB | 1.5 GB |
| Events in quadrant A | 9,254,998 | 9,505,435 |
| Events in quadrant B | 8,917,050 | 9,489,725 |
| Events in quadrant C | 8,989,548 | 8,947,815 |
| Events in quadrant D | 7,446,994 | 7,451,563 |
| Mode M9 | |||
|---|---|---|---|
| Quadrant | BADHDUFLAG | Total packets | Discarded packets |
| A | 0 | 651 | 0 |
| B | 0 | 651 | 0 |
| C | 0 | 651 | 0 |
| D | 0 | 651 | 0 |
| Mode M0 | |||
|---|---|---|---|
| Quadrant | BADHDUFLAG | Total packets | Discarded packets |
| A | 0 | 383323 | 0 |
| B | 0 | 371275 | 0 |
| C | 0 | 388268 | 0 |
| D | 0 | 592746 | 0 |
| Mode SS | |||
|---|---|---|---|
| Quadrant | BADHDUFLAG | Total packets | Discarded packets |
| A | 0 | 3546 | 0 |
| B | 0 | 3546 | 0 |
| C | 0 | 3546 | 0 |
| D | 0 | 3546 | 0 |
| Quadrant | Total seconds | Saturated seconds | Saturation percentage |
|---|---|---|---|
| A | 173531 | 990 | 0.570503% |
| B | 173531 | 1792 | 1.032669% |
| C | 173531 | 3339 | 1.924152% |
| D | 173531 | 18545 | 10.686851% |
Noise dominated data is calculated using 1-second bins in cleaned event files. If a bin has >2000 counts, and if more than 50% of those come from <1% of pixels, then it is considered to be noise-dominated and hence unusable.
| Quadrant | # 1 sec bins | Bins with >0 counts | Bins with >2000 counts | High rate bins dominated by noise | Noise dominated (total time) | Noise dominated (detector-on time) | Marked lightcurve |
|---|---|---|---|---|---|---|---|
| A | 238795 | 173529 | 0 | 0 | 0.00% | 0.00% | 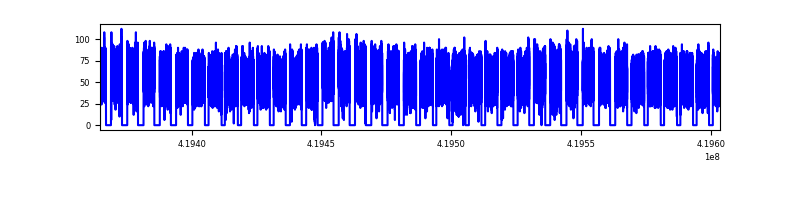 |
| B | 238795 | 173524 | 0 | 0 | 0.00% | 0.00% |  |
| C | 238795 | 173300 | 0 | 0 | 0.00% | 0.00% |  |
| D | 238795 | 173436 | 0 | 0 | 0.00% | 0.00% |  |
Top three noisy pixels from each quadrant. If the there are fewer than three noisy pixels in the level2.evt file, extra rows are filled as -1
| Pixel properties | Quadrant properties | ||||||
|---|---|---|---|---|---|---|---|
| Quadrant | DetID | PixID | Counts | Sigma | Mean | Median | Sigma |
| A | 7 | 110 | 7621 | 8.8 | 2414 | 2254 | 610.1 |
| A | 9 | 19 | 7543 | 8.67 | 2414 | 2254 | 610.1 |
| A | 0 | 29 | 7423 | 8.47 | 2414 | 2254 | 610.1 |
| B | 2 | 9 | 7758 | 12.04 | 2356 | 2242 | 458.3 |
| B | 3 | 80 | 6372 | 9.01 | 2356 | 2242 | 458.3 |
| B | 3 | 17 | 6188 | 8.61 | 2356 | 2242 | 458.3 |
| C | 1 | 81 | 7268 | 8.26 | 2375 | 2215 | 611.6 |
| C | 1 | 80 | 6946 | 7.74 | 2375 | 2215 | 611.6 |
| C | 3 | 202 | 6796 | 7.49 | 2375 | 2215 | 611.6 |
| D | 7 | 3 | 5504 | 6.24 | 2133 | 1935 | 572.2 |
| D | 4 | 160 | 5413 | 6.08 | 2133 | 1935 | 572.2 |
| D | 10 | 189 | 5401 | 6.06 | 2133 | 1935 | 572.2 |
Histogram calculated using DETX and DETY for each event in the final _common_clean file
| Quadrant A |  |
 |
Quadrant B |
|---|---|---|---|
| Quadrant D | 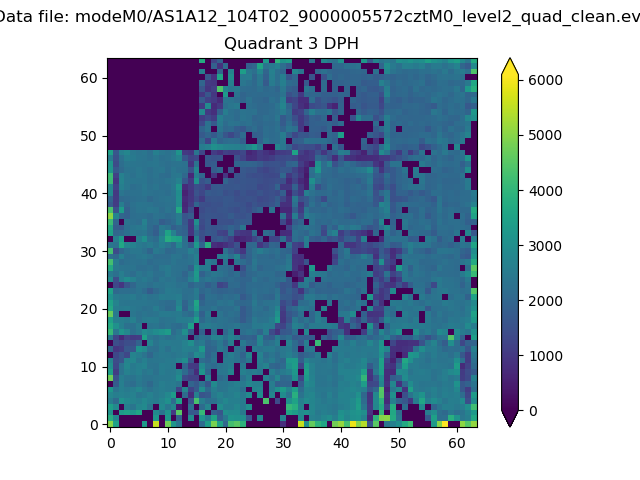 |
 |
Quadrant C |
| Plot type | Count rate plots | Images |
|---|---|---|
| Comparison with Poisson distribution Blue bars denote a histogram of data divided into 1 sec bins. Red curve is a Poisson curve with rate = median count rate of data. |
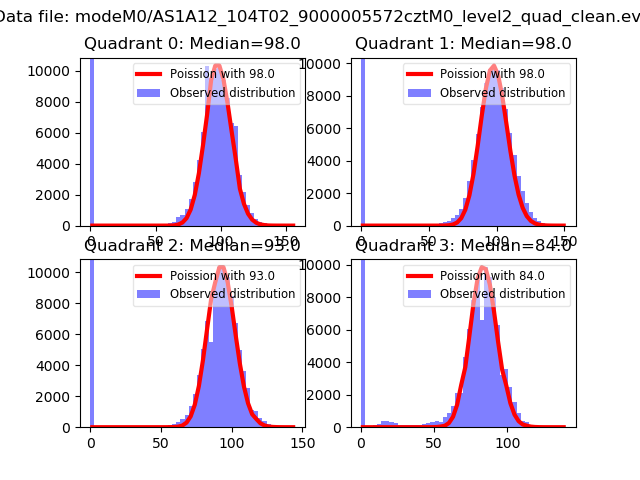 |
 |
| Quadrant-wise count rates Data is divided into 100 sec bins |
 |
|
| Module-wise count rates for Quadrant A Data is divided into 100 sec bins |
 |
 |
| Module-wise count rates for Quadrant B Data is divided into 100 sec bins |
 |
 |
| Module-wise count rates for Quadrant C Data is divided into 100 sec bins |
 |
 |
| Module-wise count rates for Quadrant D Data is divided into 100 sec bins |
 |
 |
| Parameter | Plot |
|---|---|
| CZT HV Monitor |  |
| D_VDD |  |
| Temperature 1 |  |
| Veto HV Monitor |  |
| Veto LLD |  |
| Alpha Counter |  |
| _CPM_Rate | 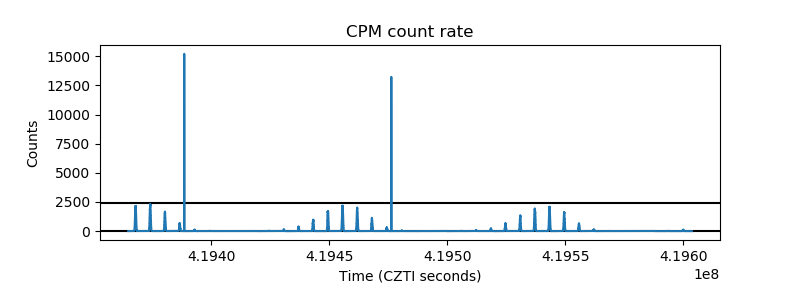 |
| CZT Counter | 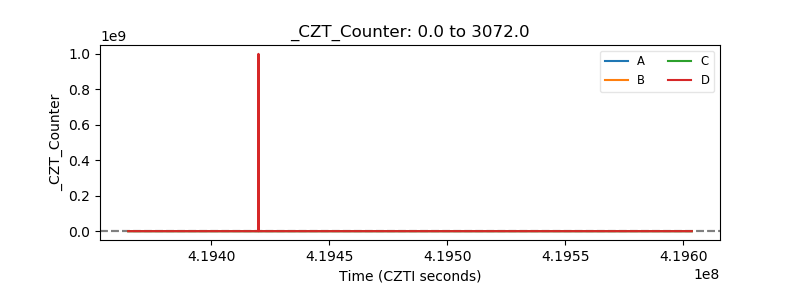 |
| +2.5 Volts monitor |  |
| +5 Volts monitor |  |
| _ROLL_ROT |  |
| _Roll_DEC |  |
| _Roll_RA |  |
| Veto Counter |  |