| Param | Original file | Final file |
|---|---|---|
| Filename | modeM0/AS1A12_099T03_9000005570cztM0_level2.fits | modeM0/AS1A12_099T03_9000005570cztM0_level2_quad_clean.evt |
| Size (bytes) | 875,499,840 | 939,173,760 |
| Size | 834.9 MB | 895.7 MB |
| Events in quadrant A | 5,221,702 | 5,598,911 |
| Events in quadrant B | 5,042,864 | 5,713,896 |
| Events in quadrant C | 5,138,308 | 5,495,414 |
| Events in quadrant D | 4,371,314 | 4,896,317 |
| Mode M0 | |||
|---|---|---|---|
| Quadrant | BADHDUFLAG | Total packets | Discarded packets |
| A | 0 | 215978 | 0 |
| B | 0 | 204331 | 0 |
| C | 0 | 203192 | 0 |
| D | 0 | 247611 | 0 |
| Mode SS | |||
|---|---|---|---|
| Quadrant | BADHDUFLAG | Total packets | Discarded packets |
| A | 0 | 2004 | 0 |
| B | 0 | 2004 | 0 |
| C | 0 | 2004 | 0 |
| D | 0 | 2004 | 0 |
| Mode M9 | |||
|---|---|---|---|
| Quadrant | BADHDUFLAG | Total packets | Discarded packets |
| A | 0 | 356 | 0 |
| B | 0 | 356 | 0 |
| C | 0 | 356 | 0 |
| D | 0 | 356 | 0 |
| Quadrant | Total seconds | Saturated seconds | Saturation percentage |
|---|---|---|---|
| A | 98332 | 568 | 0.577635% |
| B | 98333 | 458 | 0.465764% |
| C | 98333 | 418 | 0.425086% |
| D | 98333 | 2817 | 2.864755% |
Noise dominated data is calculated using 1-second bins in cleaned event files. If a bin has >2000 counts, and if more than 50% of those come from <1% of pixels, then it is considered to be noise-dominated and hence unusable.
| Quadrant | # 1 sec bins | Bins with >0 counts | Bins with >2000 counts | High rate bins dominated by noise | Noise dominated (total time) | Noise dominated (detector-on time) | Marked lightcurve |
|---|---|---|---|---|---|---|---|
| A | 132771 | 98324 | 0 | 0 | 0.00% | 0.00% |  |
| B | 132771 | 98330 | 0 | 0 | 0.00% | 0.00% | 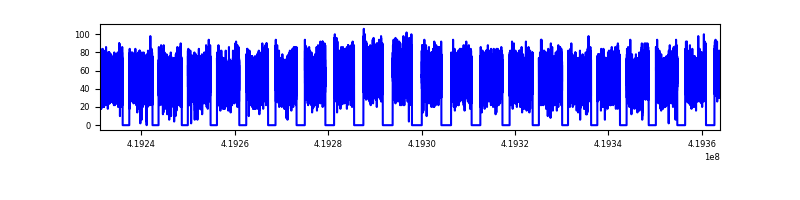 |
| C | 132772 | 98323 | 0 | 0 | 0.00% | 0.00% |  |
| D | 132771 | 98287 | 0 | 0 | 0.00% | 0.00% |  |
Top three noisy pixels from each quadrant. If the there are fewer than three noisy pixels in the level2.evt file, extra rows are filled as -1
| Pixel properties | Quadrant properties | ||||||
|---|---|---|---|---|---|---|---|
| Quadrant | DetID | PixID | Counts | Sigma | Mean | Median | Sigma |
| A | 7 | 110 | 4318 | 8.83 | 1361 | 1269 | 345.4 |
| A | 9 | 19 | 4233 | 8.58 | 1361 | 1269 | 345.4 |
| A | 0 | 29 | 4173 | 8.41 | 1361 | 1269 | 345.4 |
| B | 2 | 9 | 4325 | 11.65 | 1333 | 1268 | 262.5 |
| B | 5 | 128 | 3541 | 8.66 | 1333 | 1268 | 262.5 |
| B | 3 | 17 | 3481 | 8.43 | 1333 | 1268 | 262.5 |
| C | 1 | 81 | 4227 | 8.46 | 1356 | 1262 | 350.5 |
| C | 1 | 80 | 4209 | 8.41 | 1356 | 1262 | 350.5 |
| C | 3 | 203 | 4103 | 8.1 | 1356 | 1262 | 350.5 |
| D | 10 | 189 | 3263 | 6.35 | 1251 | 1137 | 334.9 |
| D | 4 | 160 | 3184 | 6.11 | 1251 | 1137 | 334.9 |
| D | 7 | 3 | 3150 | 6.01 | 1251 | 1137 | 334.9 |
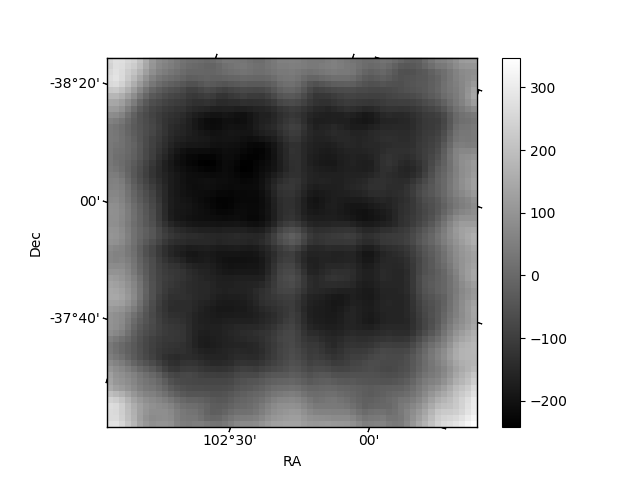
Histogram calculated using DETX and DETY for each event in the final _common_clean file
| Quadrant A | 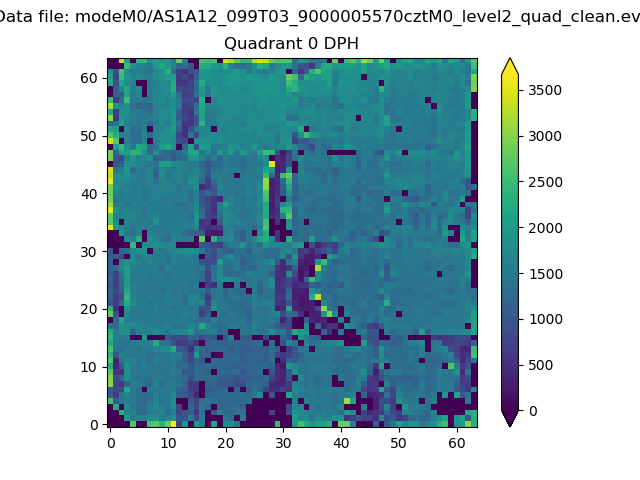 |
 |
Quadrant B |
|---|---|---|---|
| Quadrant D |  |
 |
Quadrant C |
| Plot type | Count rate plots | Images |
|---|---|---|
| Comparison with Poisson distribution Blue bars denote a histogram of data divided into 1 sec bins. Red curve is a Poisson curve with rate = median count rate of data. |
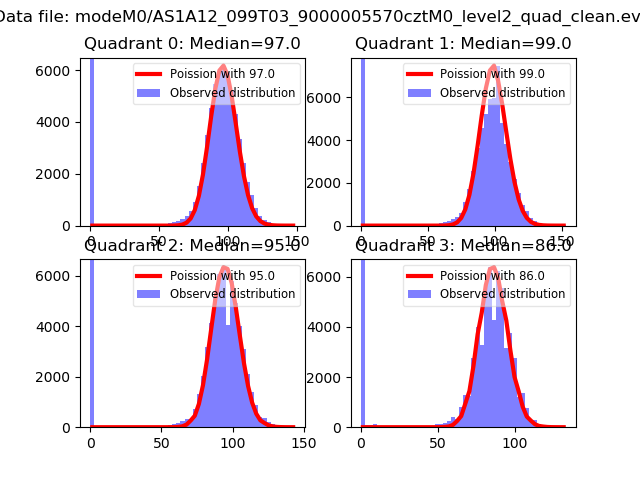 |
 |
| Quadrant-wise count rates Data is divided into 100 sec bins |
 |
|
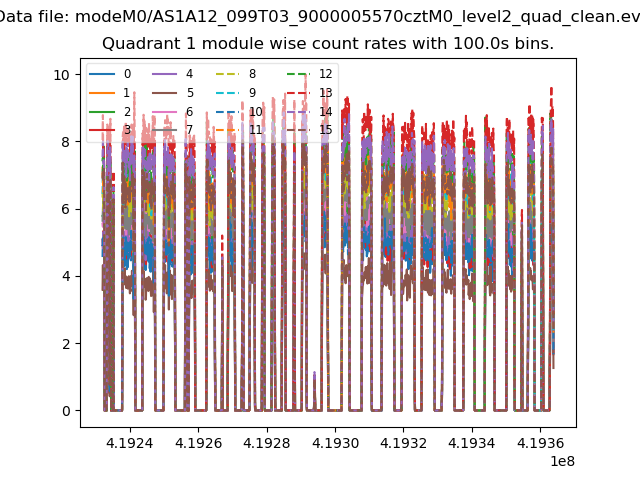
| Module-wise count rates for Quadrant A Data is divided into 100 sec bins |
 |
 |
| Module-wise count rates for Quadrant B Data is divided into 100 sec bins |
 |
 |
| Module-wise count rates for Quadrant C Data is divided into 100 sec bins |
 |
 |
| Module-wise count rates for Quadrant D Data is divided into 100 sec bins |
 |
 |
| Parameter | Plot |
|---|---|
| CZT HV Monitor | 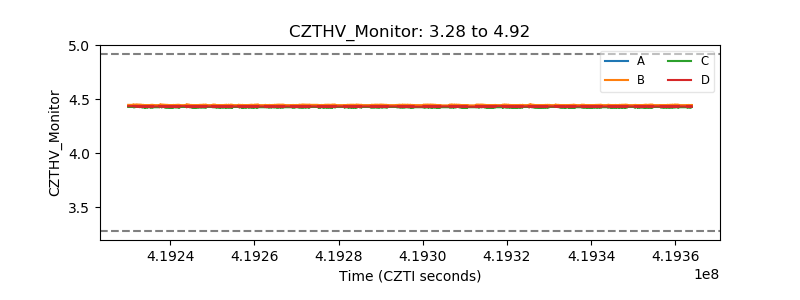 |
| D_VDD | 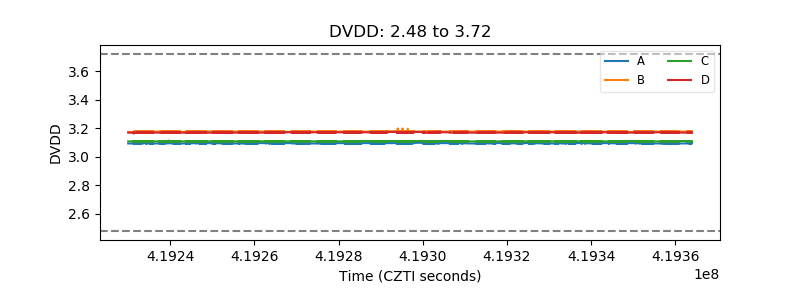 |
| Temperature 1 |  |
| Veto HV Monitor |  |
| Veto LLD |  |
| Alpha Counter | 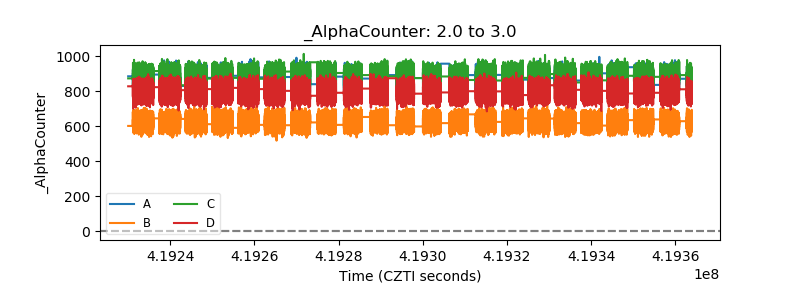 |
| _CPM_Rate | 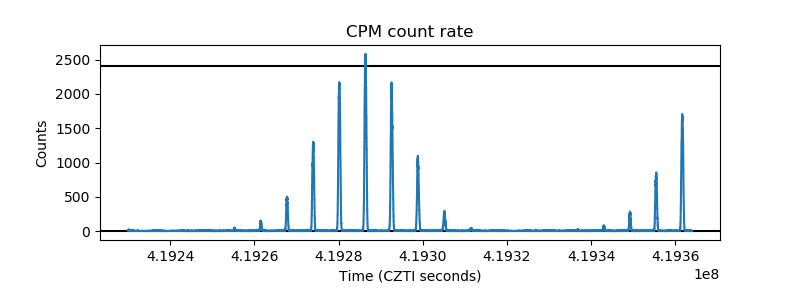 |
| CZT Counter |  |
| +2.5 Volts monitor |  |
| +5 Volts monitor | 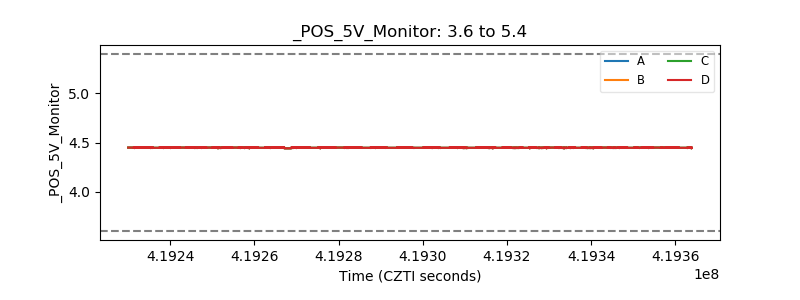 |
| _ROLL_ROT |  |
| _Roll_DEC |  |
| _Roll_RA | 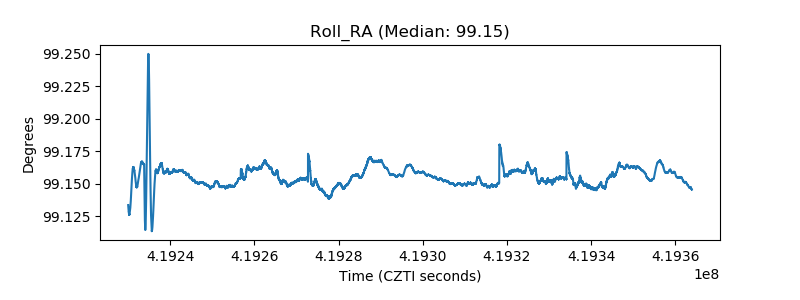 |
| Veto Counter |  |