| Param | Original file | Final file |
|---|---|---|
| Filename | modeM0/AS1C07_001T10_9000005566cztM0_level2.fits | modeM0/AS1C07_001T10_9000005566cztM0_level2_quad_clean.evt |
| Size (bytes) | 678,962,880 | 858,366,720 |
| Size | 647.5 MB | 818.6 MB |
| Events in quadrant A | 4,206,580 | 5,786,184 |
| Events in quadrant B | 4,050,818 | 5,819,780 |
| Events in quadrant C | 3,688,566 | 4,503,930 |
| Events in quadrant D | 3,125,816 | 4,410,679 |
| Mode M9 | |||
|---|---|---|---|
| Quadrant | BADHDUFLAG | Total packets | Discarded packets |
| A | 0 | 302 | 0 |
| B | 0 | 302 | 0 |
| C | 0 | 302 | 0 |
| D | 0 | 302 | 0 |
| Mode M0 | |||
|---|---|---|---|
| Quadrant | BADHDUFLAG | Total packets | Discarded packets |
| A | 0 | 174105 | 0 |
| B | 0 | 178616 | 0 |
| C | 0 | 321350 | 0 |
| D | 0 | 237714 | 0 |
| Mode SS | |||
|---|---|---|---|
| Quadrant | BADHDUFLAG | Total packets | Discarded packets |
| A | 0 | 1630 | 0 |
| B | 0 | 1630 | 0 |
| C | 0 | 1630 | 0 |
| D | 0 | 1630 | 0 |
| Quadrant | Total seconds | Saturated seconds | Saturation percentage |
|---|---|---|---|
| A | 79857 | 286 | 0.358140% |
| B | 79857 | 1513 | 1.894637% |
| C | 79857 | 17406 | 21.796461% |
| D | 79857 | 15987 | 20.019535% |
Noise dominated data is calculated using 1-second bins in cleaned event files. If a bin has >2000 counts, and if more than 50% of those come from <1% of pixels, then it is considered to be noise-dominated and hence unusable.
| Quadrant | # 1 sec bins | Bins with >0 counts | Bins with >2000 counts | High rate bins dominated by noise | Noise dominated (total time) | Noise dominated (detector-on time) | Marked lightcurve |
|---|---|---|---|---|---|---|---|
| A | 109940 | 79852 | 0 | 0 | 0.00% | 0.00% |  |
| B | 109940 | 79789 | 0 | 0 | 0.00% | 0.00% |  |
| C | 109939 | 79529 | 0 | 0 | 0.00% | 0.00% |  |
| D | 109939 | 79318 | 0 | 0 | 0.00% | 0.00% |  |
Top three noisy pixels from each quadrant. If the there are fewer than three noisy pixels in the level2.evt file, extra rows are filled as -1
| Pixel properties | Quadrant properties | ||||||
|---|---|---|---|---|---|---|---|
| Quadrant | DetID | PixID | Counts | Sigma | Mean | Median | Sigma |
| A | 9 | 19 | 3528 | 8.94 | 1097 | 1028 | 279.7 |
| A | 7 | 110 | 3403 | 8.49 | 1097 | 1028 | 279.7 |
| A | 0 | 29 | 3364 | 8.35 | 1097 | 1028 | 279.7 |
| B | 2 | 9 | 3433 | 11.71 | 1071 | 1022 | 205.8 |
| B | 5 | 128 | 2913 | 9.18 | 1071 | 1022 | 205.8 |
| B | 3 | 17 | 2813 | 8.7 | 1071 | 1022 | 205.8 |
| C | 1 | 81 | 3064 | 8.54 | 974 | 911 | 252.0 |
| C | 3 | 203 | 2996 | 8.27 | 974 | 911 | 252.0 |
| C | 3 | 202 | 2995 | 8.27 | 974 | 911 | 252.0 |
| D | 7 | 3 | 2492 | 6.22 | 907 | 822 | 268.4 |
| D | 4 | 160 | 2347 | 5.68 | 907 | 822 | 268.4 |
| D | 3 | 14 | 2318 | 5.57 | 907 | 822 | 268.4 |
Histogram calculated using DETX and DETY for each event in the final _common_clean file
| Quadrant A | 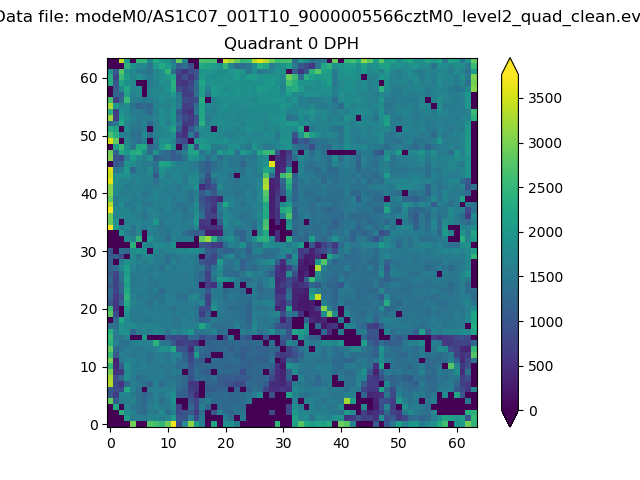 |
 |
Quadrant B |
|---|---|---|---|
| Quadrant D |  |
 |
Quadrant C |
| Plot type | Count rate plots | Images |
|---|---|---|
| Comparison with Poisson distribution Blue bars denote a histogram of data divided into 1 sec bins. Red curve is a Poisson curve with rate = median count rate of data. |
 |
 |
| Quadrant-wise count rates Data is divided into 100 sec bins |
 |
|
| Module-wise count rates for Quadrant A Data is divided into 100 sec bins |
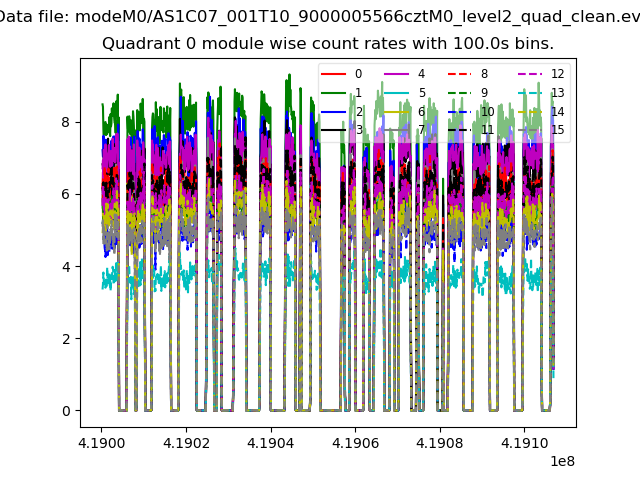 |
 |
| Module-wise count rates for Quadrant B Data is divided into 100 sec bins |
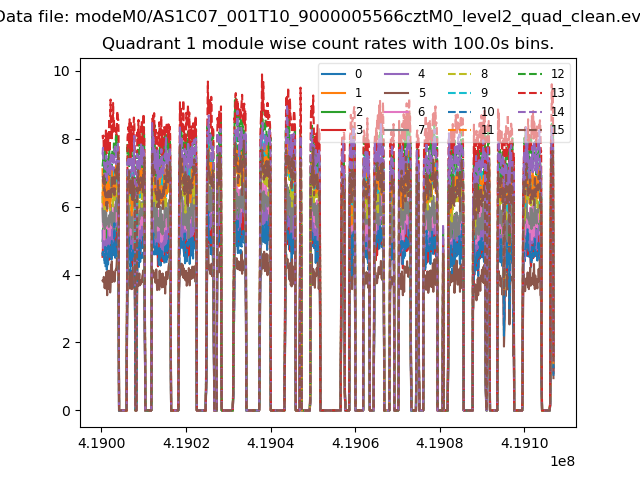 |
 |
| Module-wise count rates for Quadrant C Data is divided into 100 sec bins |
 |
 |
| Module-wise count rates for Quadrant D Data is divided into 100 sec bins |
 |
 |
| Parameter | Plot |
|---|---|
| CZT HV Monitor |  |
| D_VDD |  |
| Temperature 1 |  |
| Veto HV Monitor |  |
| Veto LLD |  |
| Alpha Counter | 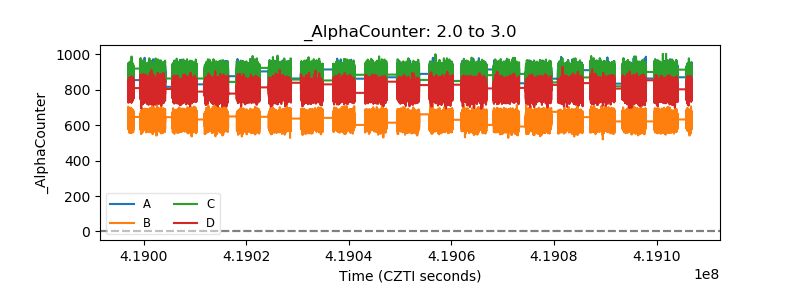 |
| _CPM_Rate |  |
| CZT Counter |  |
| +2.5 Volts monitor |  |
| +5 Volts monitor |  |
| _ROLL_ROT |  |
| _Roll_DEC |  |
| _Roll_RA |  |
| Veto Counter |  |