| Param | Original file | Final file |
|---|---|---|
| Filename | modeM0/AS1A12_029T01_9000005556cztM0_level2.fits | modeM0/AS1A12_029T01_9000005556cztM0_level2_quad_clean.evt |
| Size (bytes) | 1,139,898,240 | 1,142,832,960 |
| Size | 1.1 GB | 1.1 GB |
| Events in quadrant A | 6,992,016 | 6,925,537 |
| Events in quadrant B | 6,328,032 | 6,519,979 |
| Events in quadrant C | 6,824,694 | 6,654,625 |
| Events in quadrant D | 5,407,292 | 5,551,120 |
| Mode M0 | |||
|---|---|---|---|
| Quadrant | BADHDUFLAG | Total packets | Discarded packets |
| A | 0 | 275376 | 0 |
| B | 0 | 355743 | 0 |
| C | 0 | 272024 | 0 |
| D | 0 | 328619 | 0 |
| Mode M9 | |||
|---|---|---|---|
| Quadrant | BADHDUFLAG | Total packets | Discarded packets |
| A | 0 | 487 | 0 |
| B | 0 | 487 | 0 |
| C | 0 | 487 | 0 |
| D | 0 | 488 | 0 |
| Mode SS | |||
|---|---|---|---|
| Quadrant | BADHDUFLAG | Total packets | Discarded packets |
| A | 0 | 2668 | 0 |
| B | 0 | 2668 | 0 |
| C | 0 | 2668 | 0 |
| D | 0 | 2668 | 0 |
| Quadrant | Total seconds | Saturated seconds | Saturation percentage |
|---|---|---|---|
| A | 130750 | 227 | 0.173614% |
| B | 130750 | 10710 | 8.191205% |
| C | 130750 | 546 | 0.417591% |
| D | 130750 | 15606 | 11.935755% |
Noise dominated data is calculated using 1-second bins in cleaned event files. If a bin has >2000 counts, and if more than 50% of those come from <1% of pixels, then it is considered to be noise-dominated and hence unusable.
| Quadrant | # 1 sec bins | Bins with >0 counts | Bins with >2000 counts | High rate bins dominated by noise | Noise dominated (total time) | Noise dominated (detector-on time) | Marked lightcurve |
|---|---|---|---|---|---|---|---|
| A | 183414 | 130751 | 0 | 0 | 0.00% | 0.00% |  |
| B | 183414 | 130370 | 0 | 0 | 0.00% | 0.00% |  |
| C | 183413 | 130732 | 0 | 0 | 0.00% | 0.00% |  |
| D | 183414 | 130134 | 0 | 0 | 0.00% | 0.00% |  |
Top three noisy pixels from each quadrant. If the there are fewer than three noisy pixels in the level2.evt file, extra rows are filled as -1
| Pixel properties | Quadrant properties | ||||||
|---|---|---|---|---|---|---|---|
| Quadrant | DetID | PixID | Counts | Sigma | Mean | Median | Sigma |
| A | 7 | 110 | 5756 | 8.78 | 1824 | 1704 | 461.7 |
| A | 0 | 29 | 5574 | 8.38 | 1824 | 1704 | 461.7 |
| A | 9 | 19 | 5502 | 8.23 | 1824 | 1704 | 461.7 |
| B | 2 | 9 | 5465 | 11.81 | 1672 | 1589 | 328.3 |
| B | 3 | 80 | 4523 | 8.94 | 1672 | 1589 | 328.3 |
| B | 2 | 8 | 4385 | 8.52 | 1672 | 1589 | 328.3 |
| C | 1 | 81 | 5513 | 8.24 | 1802 | 1677 | 465.4 |
| C | 3 | 203 | 5281 | 7.74 | 1802 | 1677 | 465.4 |
| C | 1 | 80 | 5274 | 7.73 | 1802 | 1677 | 465.4 |
| D | 7 | 3 | 4120 | 5.87 | 1571 | 1426 | 458.7 |
| D | 3 | 14 | 4084 | 5.79 | 1571 | 1426 | 458.7 |
| D | 10 | 189 | 4057 | 5.73 | 1571 | 1426 | 458.7 |
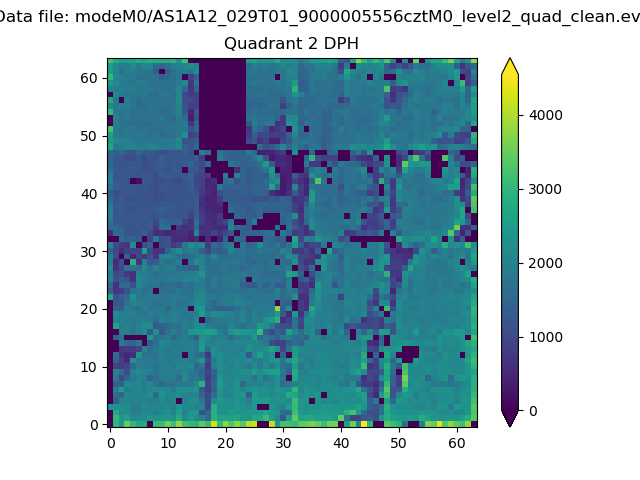
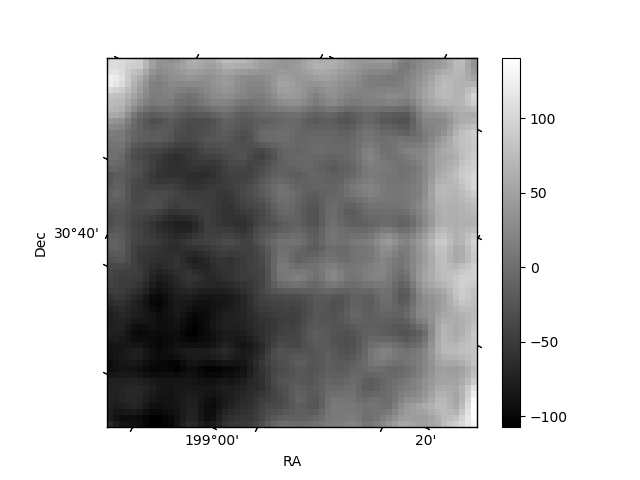
Histogram calculated using DETX and DETY for each event in the final _common_clean file
| Quadrant A |  |
 |
Quadrant B |
|---|---|---|---|
| Quadrant D |  |
 |
Quadrant C |
| Plot type | Count rate plots | Images |
|---|---|---|
| Comparison with Poisson distribution Blue bars denote a histogram of data divided into 1 sec bins. Red curve is a Poisson curve with rate = median count rate of data. |
 |
 |
| Quadrant-wise count rates Data is divided into 100 sec bins |
 |
|
| Module-wise count rates for Quadrant A Data is divided into 100 sec bins |
 |
 |
| Module-wise count rates for Quadrant B Data is divided into 100 sec bins |
 |
 |
| Module-wise count rates for Quadrant C Data is divided into 100 sec bins |
 |
 |
| Module-wise count rates for Quadrant D Data is divided into 100 sec bins |
 |
 |
| Parameter | Plot |
|---|---|
| CZT HV Monitor | 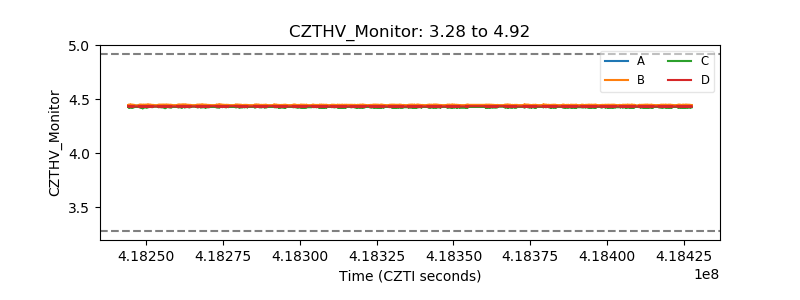 |
| D_VDD |  |
| Temperature 1 |  |
| Veto HV Monitor | 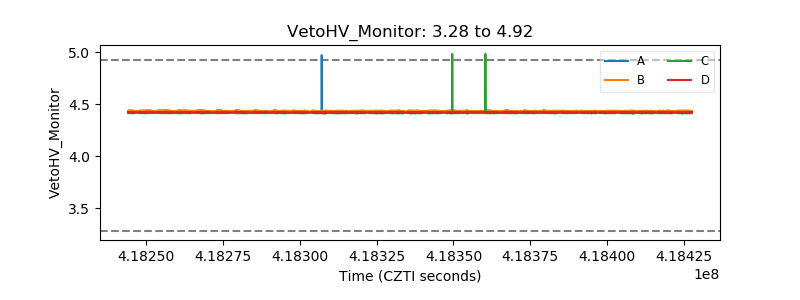 |
| Veto LLD |  |
| Alpha Counter |  |
| _CPM_Rate | 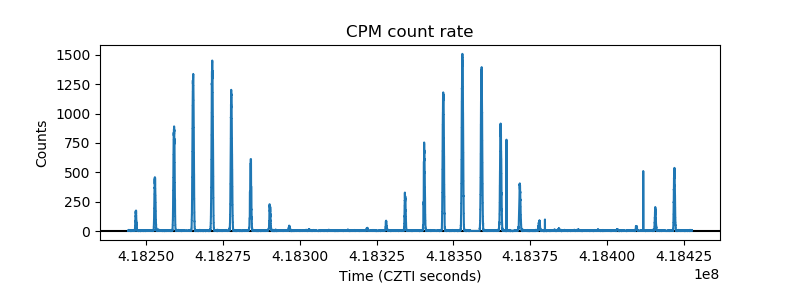 |
| CZT Counter |  |
| +2.5 Volts monitor | 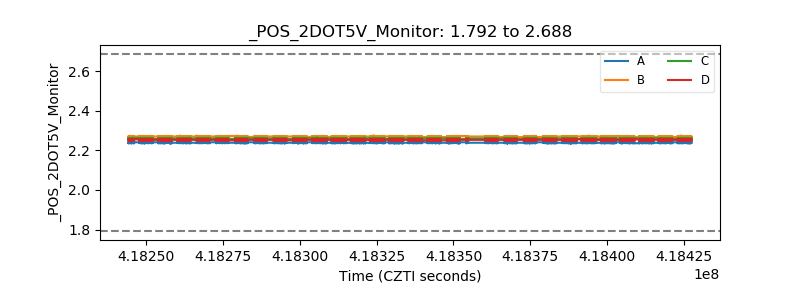 |
| +5 Volts monitor |  |
| _ROLL_ROT | 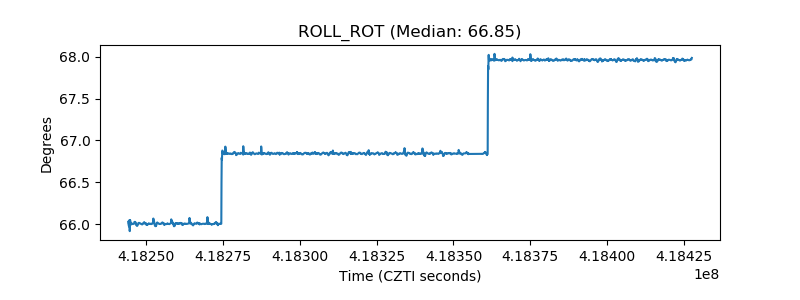 |
| _Roll_DEC |  |
| _Roll_RA |  |
| Veto Counter |  |