| Param | Original file | Final file |
|---|---|---|
| Filename | modeM0/AS1T05_070T01_9000005544cztM0_level2.fits | modeM0/AS1T05_070T01_9000005544cztM0_level2_quad_clean.evt |
| Size (bytes) | 692,262,720 | 694,120,320 |
| Size | 660.2 MB | 662.0 MB |
| Events in quadrant A | 4,220,736 | 4,178,572 |
| Events in quadrant B | 4,058,280 | 4,203,064 |
| Events in quadrant C | 4,161,802 | 4,051,503 |
| Events in quadrant D | 3,165,320 | 3,235,069 |
| Mode M0 | |||
|---|---|---|---|
| Quadrant | BADHDUFLAG | Total packets | Discarded packets |
| A | 0 | 169951 | 0 |
| B | 0 | 169918 | 0 |
| C | 0 | 169444 | 0 |
| D | 0 | 209108 | 0 |
| Mode M9 | |||
|---|---|---|---|
| Quadrant | BADHDUFLAG | Total packets | Discarded packets |
| A | 0 | 328 | 0 |
| B | 0 | 328 | 0 |
| C | 0 | 328 | 0 |
| D | 0 | 329 | 0 |
| Mode SS | |||
|---|---|---|---|
| Quadrant | BADHDUFLAG | Total packets | Discarded packets |
| A | 0 | 1586 | 0 |
| B | 0 | 1584 | 0 |
| C | 0 | 1584 | 0 |
| D | 0 | 1583 | 0 |
| Quadrant | Total seconds | Saturated seconds | Saturation percentage |
|---|---|---|---|
| A | 78077 | 204 | 0.261281% |
| B | 78054 | 722 | 0.925001% |
| C | 78122 | 595 | 0.761629% |
| D | 78040 | 14080 | 18.042030% |
Noise dominated data is calculated using 1-second bins in cleaned event files. If a bin has >2000 counts, and if more than 50% of those come from <1% of pixels, then it is considered to be noise-dominated and hence unusable.
| Quadrant | # 1 sec bins | Bins with >0 counts | Bins with >2000 counts | High rate bins dominated by noise | Noise dominated (total time) | Noise dominated (detector-on time) | Marked lightcurve |
|---|---|---|---|---|---|---|---|
| A | 121306 | 78347 | 0 | 0 | 0.00% | 0.00% |  |
| B | 121306 | 78339 | 0 | 0 | 0.00% | 0.00% | 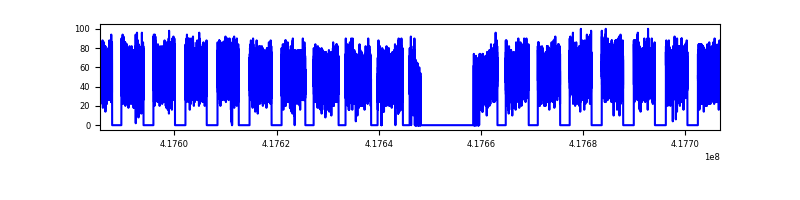 |
| C | 121306 | 78446 | 0 | 0 | 0.00% | 0.00% |  |
| D | 121306 | 77828 | 0 | 0 | 0.00% | 0.00% |  |
Top three noisy pixels from each quadrant. If the there are fewer than three noisy pixels in the level2.evt file, extra rows are filled as -1
| Pixel properties | Quadrant properties | ||||||
|---|---|---|---|---|---|---|---|
| Quadrant | DetID | PixID | Counts | Sigma | Mean | Median | Sigma |
| A | 7 | 110 | 3461 | 8.95 | 1101 | 1035 | 271.1 |
| A | 9 | 19 | 3431 | 8.84 | 1101 | 1035 | 271.1 |
| A | 0 | 29 | 3391 | 8.69 | 1101 | 1035 | 271.1 |
| B | 2 | 9 | 3545 | 12.18 | 1073 | 1025 | 206.9 |
| B | 3 | 80 | 2934 | 9.23 | 1073 | 1025 | 206.9 |
| B | 2 | 8 | 2768 | 8.42 | 1073 | 1025 | 206.9 |
| C | 1 | 81 | 3466 | 8.57 | 1099 | 1028 | 284.3 |
| C | 1 | 80 | 3404 | 8.36 | 1099 | 1028 | 284.3 |
| C | 3 | 203 | 3253 | 7.83 | 1099 | 1028 | 284.3 |
| D | 10 | 189 | 2437 | 5.95 | 920 | 836 | 269.0 |
| D | 4 | 160 | 2385 | 5.76 | 920 | 836 | 269.0 |
| D | 6 | 231 | 2372 | 5.71 | 920 | 836 | 269.0 |
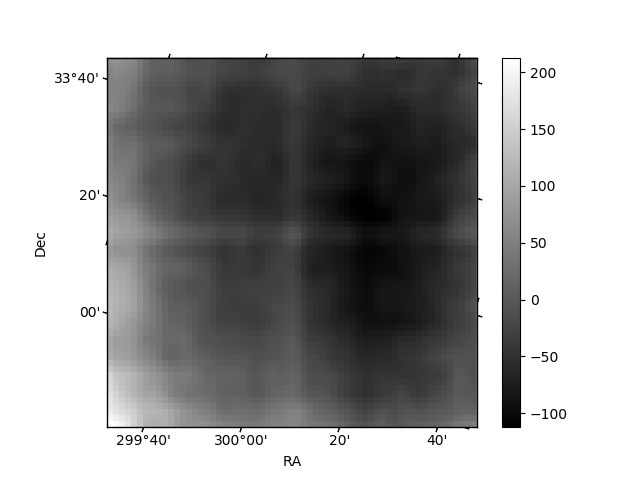
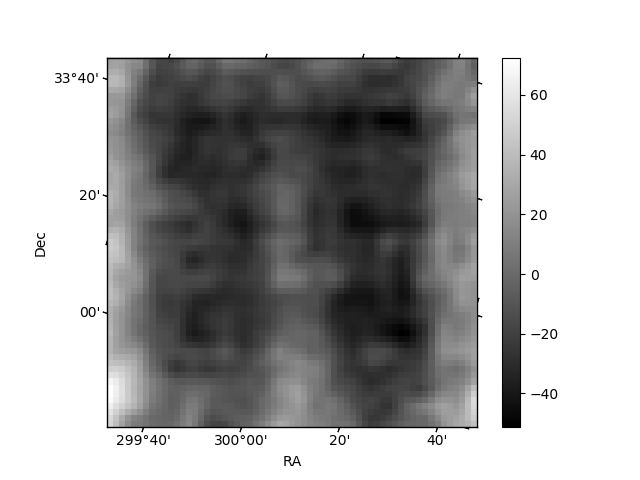
Histogram calculated using DETX and DETY for each event in the final _common_clean file
| Quadrant A |  |
 |
Quadrant B |
|---|---|---|---|
| Quadrant D |  |
 |
Quadrant C |
| Plot type | Count rate plots | Images |
|---|---|---|
| Comparison with Poisson distribution Blue bars denote a histogram of data divided into 1 sec bins. Red curve is a Poisson curve with rate = median count rate of data. |
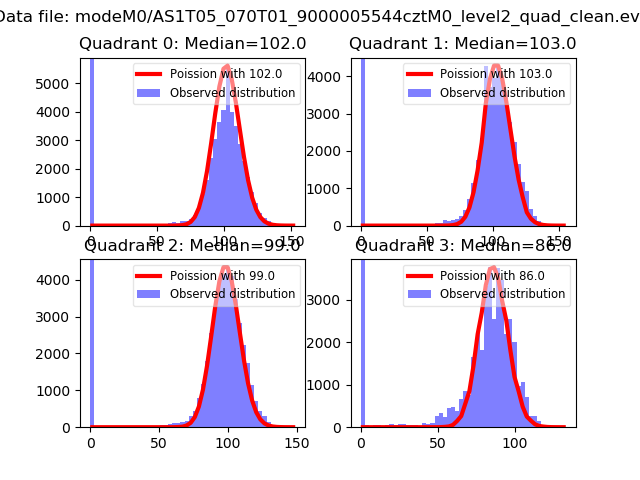 |
 |
| Quadrant-wise count rates Data is divided into 100 sec bins |
 |
|
| Module-wise count rates for Quadrant A Data is divided into 100 sec bins |
 |
 |
| Module-wise count rates for Quadrant B Data is divided into 100 sec bins |
 |
 |
| Module-wise count rates for Quadrant C Data is divided into 100 sec bins |
 |
 |
| Module-wise count rates for Quadrant D Data is divided into 100 sec bins |
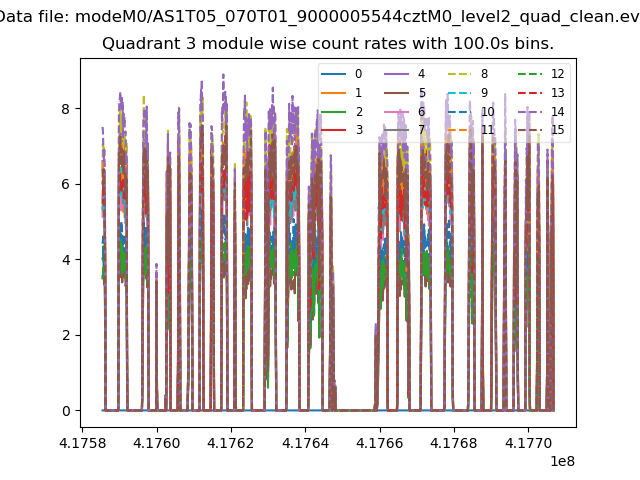 |
 |
| Parameter | Plot |
|---|---|
| CZT HV Monitor |  |
| D_VDD |  |
| Temperature 1 | 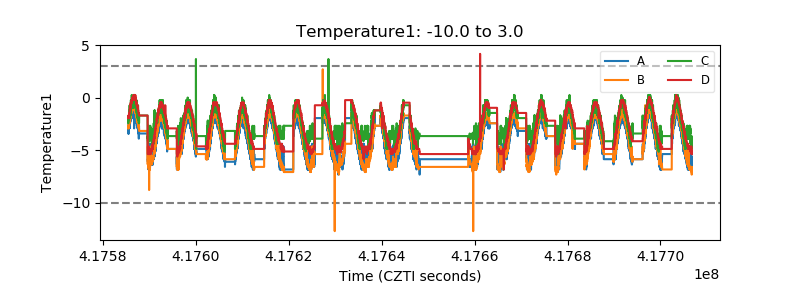 |
| Veto HV Monitor |  |
| Veto LLD |  |
| Alpha Counter |  |
| _CPM_Rate | 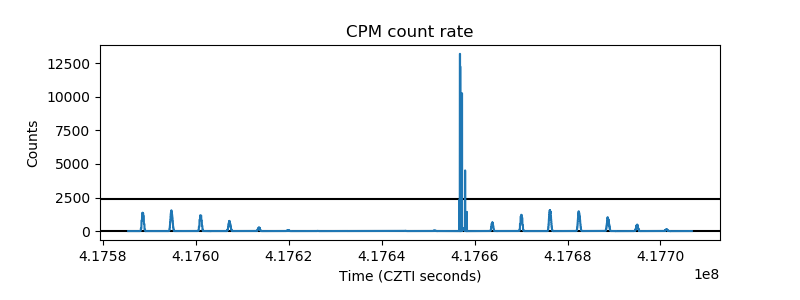 |
| CZT Counter |  |
| +2.5 Volts monitor |  |
| +5 Volts monitor |  |
| _ROLL_ROT |  |
| _Roll_DEC |  |
| _Roll_RA |  |
| Veto Counter | 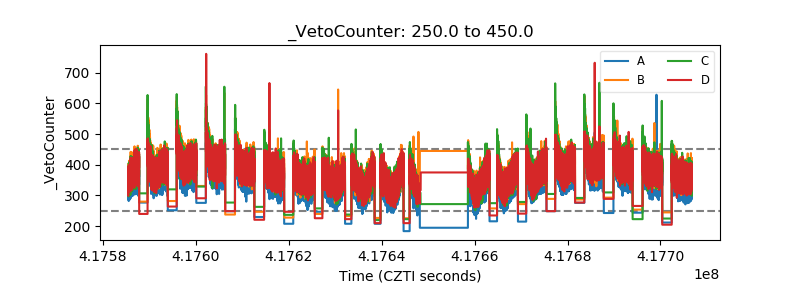 |