| Param | Original file | Final file |
|---|---|---|
| Filename | modeM0/AS1A12_097T02_9000005542cztM0_level2.fits | modeM0/AS1A12_097T02_9000005542cztM0_level2_quad_clean.evt |
| Size (bytes) | 338,201,280 | 316,823,040 |
| Size | 322.5 MB | 302.1 MB |
| Events in quadrant A | 2,049,468 | 1,885,759 |
| Events in quadrant B | 1,946,292 | 1,874,090 |
| Events in quadrant C | 2,010,178 | 1,820,894 |
| Events in quadrant D | 1,547,606 | 1,326,956 |
| Mode M0 | |||
|---|---|---|---|
| Quadrant | BADHDUFLAG | Total packets | Discarded packets |
| A | 0 | 86057 | 0 |
| B | 0 | 94013 | 0 |
| C | 0 | 83663 | 0 |
| D | 0 | 102154 | 0 |
| Mode SS | |||
|---|---|---|---|
| Quadrant | BADHDUFLAG | Total packets | Discarded packets |
| A | 0 | 800 | 0 |
| B | 0 | 800 | 0 |
| C | 0 | 800 | 0 |
| D | 0 | 800 | 0 |
| Mode M9 | |||
|---|---|---|---|
| Quadrant | BADHDUFLAG | Total packets | Discarded packets |
| A | 0 | 141 | 0 |
| B | 0 | 141 | 0 |
| C | 0 | 141 | 0 |
| D | 0 | 141 | 0 |
| Quadrant | Total seconds | Saturated seconds | Saturation percentage |
|---|---|---|---|
| A | 39111 | 117 | 0.299149% |
| B | 39111 | 614 | 1.569891% |
| C | 39111 | 313 | 0.800286% |
| D | 39111 | 7041 | 18.002608% |
Noise dominated data is calculated using 1-second bins in cleaned event files. If a bin has >2000 counts, and if more than 50% of those come from <1% of pixels, then it is considered to be noise-dominated and hence unusable.
| Quadrant | # 1 sec bins | Bins with >0 counts | Bins with >2000 counts | High rate bins dominated by noise | Noise dominated (total time) | Noise dominated (detector-on time) | Marked lightcurve |
|---|---|---|---|---|---|---|---|
| A | 53205 | 39111 | 0 | 0 | 0.00% | 0.00% |  |
| B | 53205 | 39106 | 0 | 0 | 0.00% | 0.00% |  |
| C | 53205 | 39099 | 0 | 0 | 0.00% | 0.00% |  |
| D | 53205 | 39007 | 0 | 0 | 0.00% | 0.00% |  |
Top three noisy pixels from each quadrant. If the there are fewer than three noisy pixels in the level2.evt file, extra rows are filled as -1
| Pixel properties | Quadrant properties | ||||||
|---|---|---|---|---|---|---|---|
| Quadrant | DetID | PixID | Counts | Sigma | Mean | Median | Sigma |
| A | 0 | 29 | 1682 | 8.66 | 535 | 500 | 136.5 |
| A | 7 | 110 | 1643 | 8.37 | 535 | 500 | 136.5 |
| A | 14 | 95 | 1640 | 8.35 | 535 | 500 | 136.5 |
| B | 2 | 9 | 1680 | 11.65 | 515 | 491 | 102.0 |
| B | 3 | 80 | 1497 | 9.86 | 515 | 491 | 102.0 |
| B | 3 | 17 | 1396 | 8.87 | 515 | 491 | 102.0 |
| C | 1 | 81 | 1724 | 8.9 | 530 | 495 | 138.1 |
| C | 1 | 80 | 1639 | 8.29 | 530 | 495 | 138.1 |
| C | 3 | 202 | 1632 | 8.24 | 530 | 495 | 138.1 |
| D | 7 | 3 | 1194 | 5.88 | 450 | 407 | 133.7 |
| D | 10 | 189 | 1188 | 5.84 | 450 | 407 | 133.7 |
| D | 6 | 62 | 1181 | 5.78 | 450 | 407 | 133.7 |
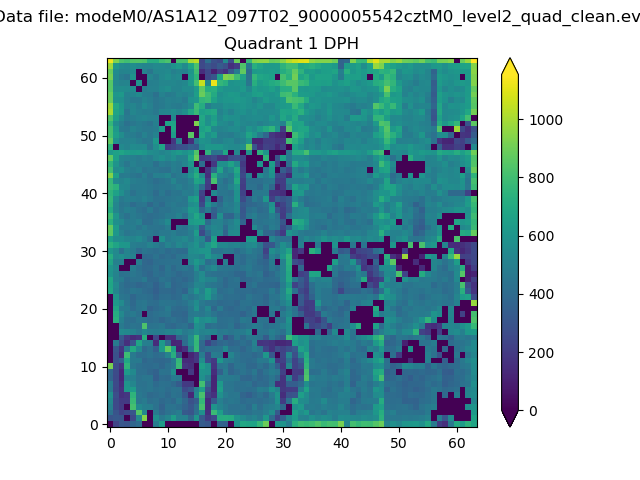
Histogram calculated using DETX and DETY for each event in the final _common_clean file
| Quadrant A |  |
 |
Quadrant B |
|---|---|---|---|
| Quadrant D | 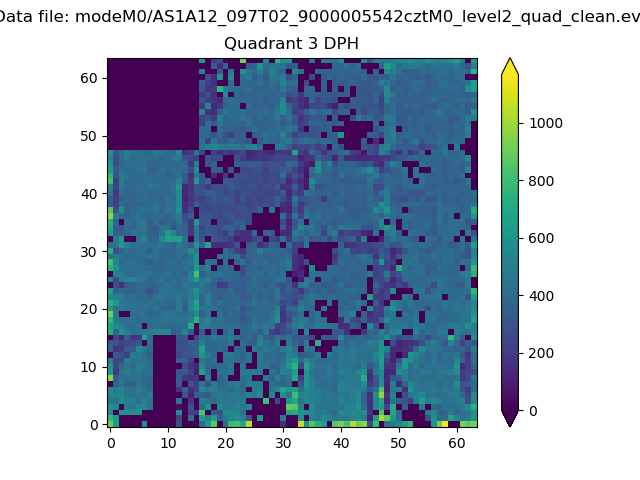 |
 |
Quadrant C |
| Plot type | Count rate plots | Images |
|---|---|---|
| Comparison with Poisson distribution Blue bars denote a histogram of data divided into 1 sec bins. Red curve is a Poisson curve with rate = median count rate of data. |
 |
 |
| Quadrant-wise count rates Data is divided into 100 sec bins |
 |
|
| Module-wise count rates for Quadrant A Data is divided into 100 sec bins |
 |
 |
| Module-wise count rates for Quadrant B Data is divided into 100 sec bins |
 |
 |
| Module-wise count rates for Quadrant C Data is divided into 100 sec bins |
 |
 |
| Module-wise count rates for Quadrant D Data is divided into 100 sec bins |
 |
 |
| Parameter | Plot |
|---|---|
| CZT HV Monitor |  |
| D_VDD |  |
| Temperature 1 |  |
| Veto HV Monitor |  |
| Veto LLD |  |
| Alpha Counter |  |
| _CPM_Rate |  |
| CZT Counter |  |
| +2.5 Volts monitor |  |
| +5 Volts monitor |  |
| _ROLL_ROT | 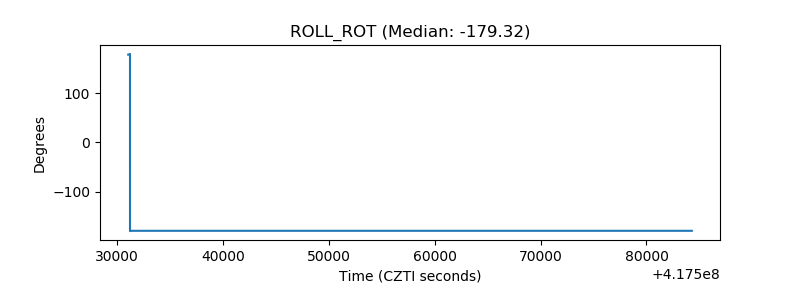 |
| _Roll_DEC |  |
| _Roll_RA |  |
| Veto Counter |  |