| Param | Original file | Final file |
|---|---|---|
| Filename | modeM0/AS1A12_022T01_9000005540cztM0_level2.fits | modeM0/AS1A12_022T01_9000005540cztM0_level2_quad_clean.evt |
| Size (bytes) | 3,491,196,480 | 4,086,178,560 |
| Size | 3.3 GB | 3.8 GB |
| Events in quadrant A | 21,311,530 | 26,006,972 |
| Events in quadrant B | 20,361,394 | 25,936,548 |
| Events in quadrant C | 20,886,756 | 24,993,413 |
| Events in quadrant D | 16,040,920 | 19,720,244 |
| Mode M0 | |||
|---|---|---|---|
| Quadrant | BADHDUFLAG | Total packets | Discarded packets |
| A | 0 | 847605 | 0 |
| B | 0 | 864122 | 0 |
| C | 0 | 832171 | 0 |
| D | 0 | 1081363 | 0 |
| Mode M9 | |||
|---|---|---|---|
| Quadrant | BADHDUFLAG | Total packets | Discarded packets |
| A | 0 | 1510 | 0 |
| B | 0 | 1510 | 0 |
| C | 0 | 1510 | 0 |
| D | 0 | 1511 | 0 |
| Mode SS | |||
|---|---|---|---|
| Quadrant | BADHDUFLAG | Total packets | Discarded packets |
| A | 0 | 8080 | 0 |
| B | 0 | 8080 | 0 |
| C | 0 | 8080 | 0 |
| D | 0 | 8080 | 0 |
| Quadrant | Total seconds | Saturated seconds | Saturation percentage |
|---|---|---|---|
| A | 395757 | 916 | 0.231455% |
| B | 395754 | 3396 | 0.858109% |
| C | 395757 | 1626 | 0.410858% |
| D | 395757 | 66726 | 16.860346% |
Noise dominated data is calculated using 1-second bins in cleaned event files. If a bin has >2000 counts, and if more than 50% of those come from <1% of pixels, then it is considered to be noise-dominated and hence unusable.
| Quadrant | # 1 sec bins | Bins with >0 counts | Bins with >2000 counts | High rate bins dominated by noise | Noise dominated (total time) | Noise dominated (detector-on time) | Marked lightcurve |
|---|---|---|---|---|---|---|---|
| A | 551428 | 395756 | 0 | 0 | 0.00% | 0.00% |  |
| B | 551428 | 395741 | 0 | 0 | 0.00% | 0.00% |  |
| C | 551428 | 395734 | 0 | 0 | 0.00% | 0.00% |  |
| D | 551428 | 393779 | 0 | 0 | 0.00% | 0.00% |  |
Top three noisy pixels from each quadrant. If the there are fewer than three noisy pixels in the level2.evt file, extra rows are filled as -1
| Pixel properties | Quadrant properties | ||||||
|---|---|---|---|---|---|---|---|
| Quadrant | DetID | PixID | Counts | Sigma | Mean | Median | Sigma |
| A | 9 | 19 | 17551 | 9.01 | 5567 | 5238 | 1366.0 |
| A | 7 | 110 | 17384 | 8.89 | 5567 | 5238 | 1366.0 |
| A | 0 | 29 | 17114 | 8.69 | 5567 | 5238 | 1366.0 |
| B | 2 | 9 | 17462 | 11.96 | 5392 | 5161 | 1028.8 |
| B | 3 | 80 | 14811 | 9.38 | 5392 | 5161 | 1028.8 |
| B | 2 | 8 | 14163 | 8.75 | 5392 | 5161 | 1028.8 |
| C | 1 | 81 | 16987 | 8.35 | 5523 | 5173 | 1415.0 |
| C | 3 | 202 | 16751 | 8.18 | 5523 | 5173 | 1415.0 |
| C | 3 | 203 | 16593 | 8.07 | 5523 | 5173 | 1415.0 |
| D | 10 | 189 | 12246 | 5.91 | 4666 | 4247 | 1353.1 |
| D | 7 | 3 | 12164 | 5.85 | 4666 | 4247 | 1353.1 |
| D | 4 | 160 | 11932 | 5.68 | 4666 | 4247 | 1353.1 |
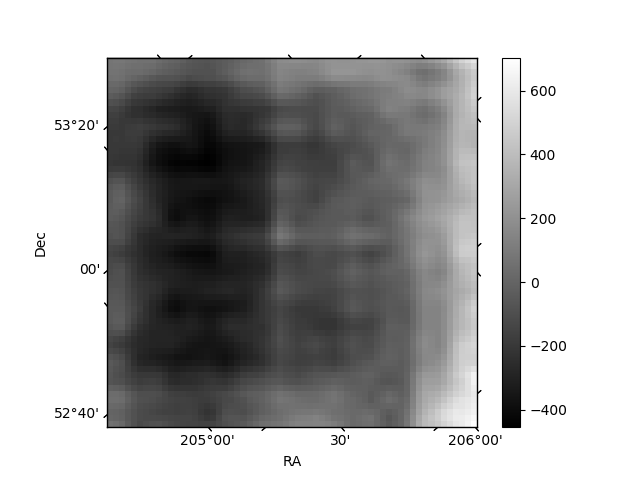
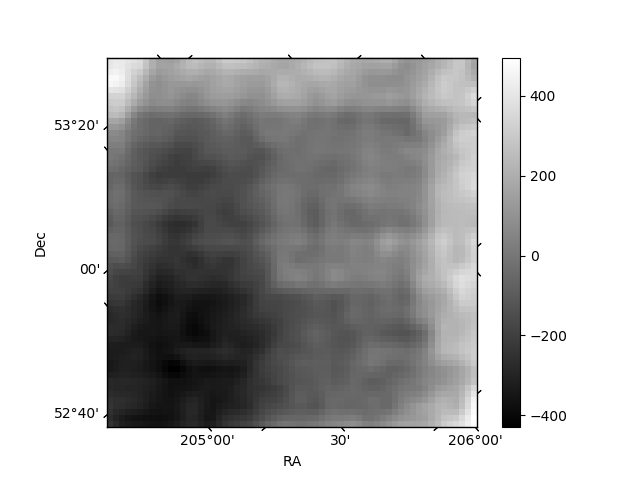
Histogram calculated using DETX and DETY for each event in the final _common_clean file
| Quadrant A | 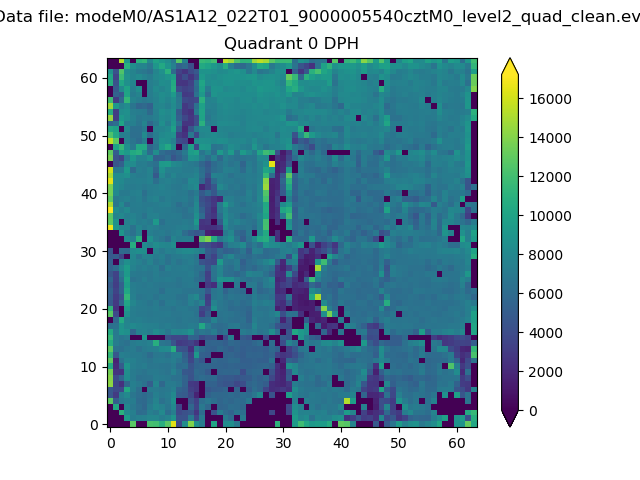 |
 |
Quadrant B |
|---|---|---|---|
| Quadrant D |  |
 |
Quadrant C |
| Plot type | Count rate plots | Images |
|---|---|---|
| Comparison with Poisson distribution Blue bars denote a histogram of data divided into 1 sec bins. Red curve is a Poisson curve with rate = median count rate of data. |
 |
 |
| Quadrant-wise count rates Data is divided into 100 sec bins |
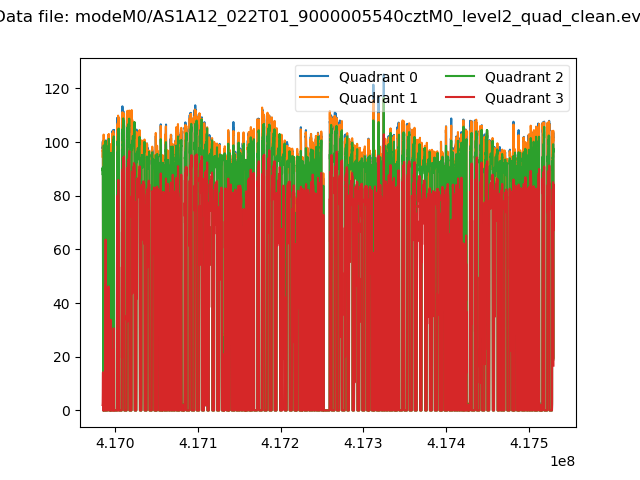 |
|
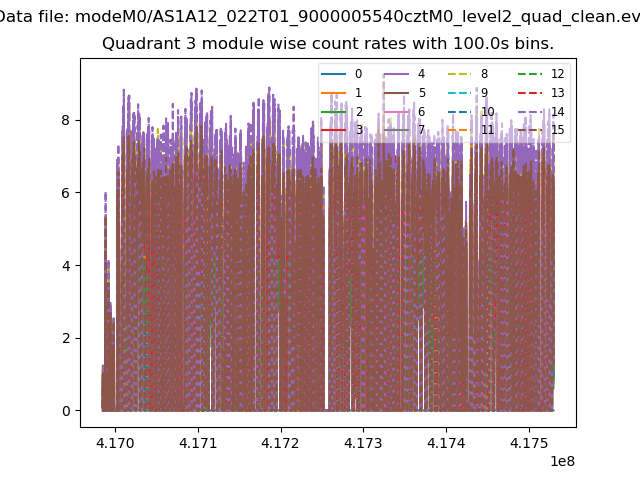
| Module-wise count rates for Quadrant A Data is divided into 100 sec bins |
 |
 |
| Module-wise count rates for Quadrant B Data is divided into 100 sec bins |
 |
 |
| Module-wise count rates for Quadrant C Data is divided into 100 sec bins |
 |
 |
| Module-wise count rates for Quadrant D Data is divided into 100 sec bins |
 |
 |
| Parameter | Plot |
|---|---|
| CZT HV Monitor | 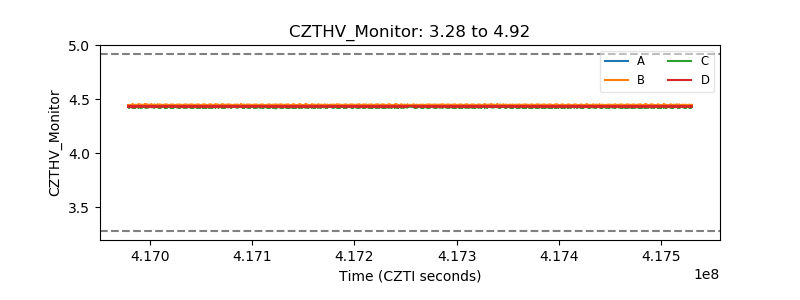 |
| D_VDD |  |
| Temperature 1 |  |
| Veto HV Monitor |  |
| Veto LLD |  |
| Alpha Counter |  |
| _CPM_Rate |  |
| CZT Counter |  |
| +2.5 Volts monitor | 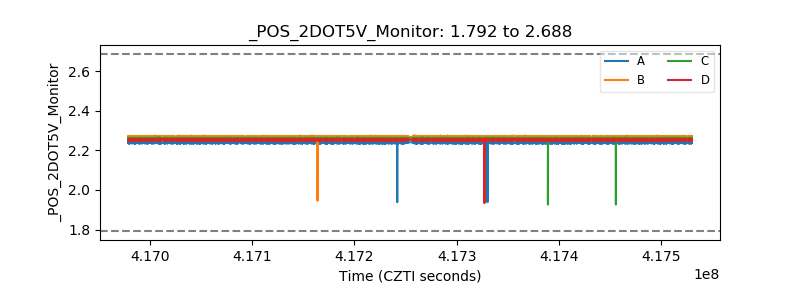 |
| +5 Volts monitor | 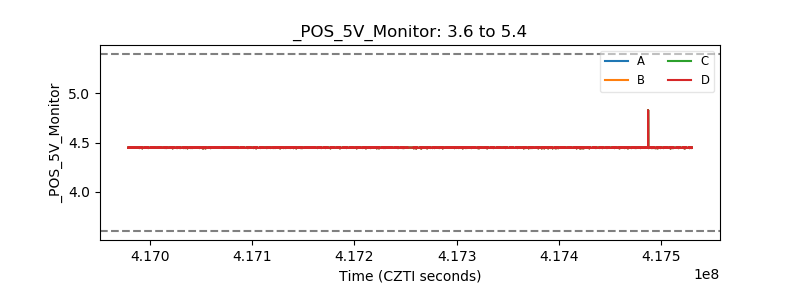 |
| _ROLL_ROT |  |
| _Roll_DEC |  |
| _Roll_RA |  |
| Veto Counter | 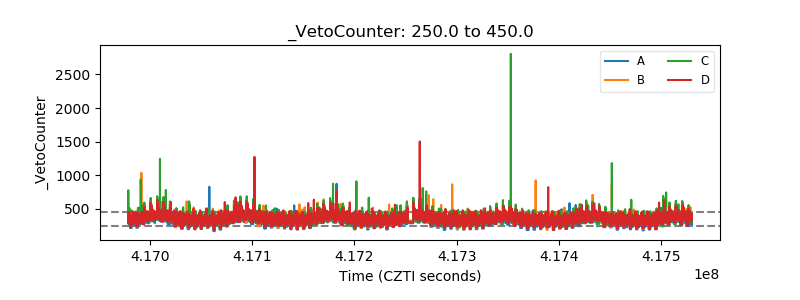 |