| Param | Original file | Final file |
|---|---|---|
| Filename | modeM0/AS1A12_068T01_9000005526cztM0_level2.fits | modeM0/AS1A12_068T01_9000005526cztM0_level2_quad_clean.evt |
| Size (bytes) | 337,164,480 | 355,426,560 |
| Size | 321.5 MB | 339.0 MB |
| Events in quadrant A | 2,051,568 | 2,231,770 |
| Events in quadrant B | 2,010,102 | 2,264,682 |
| Events in quadrant C | 1,725,648 | 1,651,015 |
| Events in quadrant D | 1,781,562 | 1,980,578 |
| Mode SS | |||
|---|---|---|---|
| Quadrant | BADHDUFLAG | Total packets | Discarded packets |
| A | 0 | 788 | 0 |
| B | 0 | 788 | 0 |
| C | 0 | 788 | 0 |
| D | 0 | 788 | 0 |
| Mode M9 | |||
|---|---|---|---|
| Quadrant | BADHDUFLAG | Total packets | Discarded packets |
| A | 0 | 165 | 0 |
| B | 0 | 165 | 0 |
| C | 0 | 165 | 0 |
| D | 0 | 165 | 0 |
| Mode M0 | |||
|---|---|---|---|
| Quadrant | BADHDUFLAG | Total packets | Discarded packets |
| A | 0 | 89734 | 0 |
| B | 0 | 85725 | 0 |
| C | 0 | 176525 | 0 |
| D | 0 | 94053 | 0 |
| Quadrant | Total seconds | Saturated seconds | Saturation percentage |
|---|---|---|---|
| A | 38376 | 873 | 2.274859% |
| B | 38376 | 745 | 1.941317% |
| C | 38376 | 12013 | 31.303419% |
| D | 38376 | 1191 | 3.103502% |
Noise dominated data is calculated using 1-second bins in cleaned event files. If a bin has >2000 counts, and if more than 50% of those come from <1% of pixels, then it is considered to be noise-dominated and hence unusable.
| Quadrant | # 1 sec bins | Bins with >0 counts | Bins with >2000 counts | High rate bins dominated by noise | Noise dominated (total time) | Noise dominated (detector-on time) | Marked lightcurve |
|---|---|---|---|---|---|---|---|
| A | 58393 | 38362 | 0 | 0 | 0.00% | 0.00% |  |
| B | 58393 | 38361 | 0 | 0 | 0.00% | 0.00% |  |
| C | 58393 | 38254 | 0 | 0 | 0.00% | 0.00% |  |
| D | 58393 | 38350 | 0 | 0 | 0.00% | 0.00% | 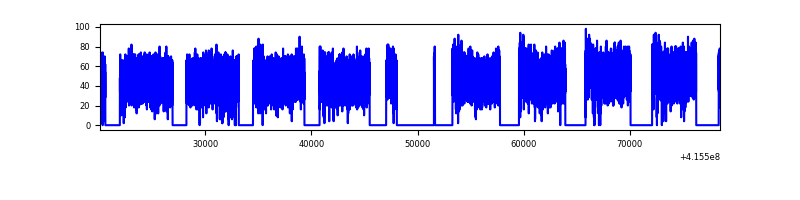 |
Top three noisy pixels from each quadrant. If the there are fewer than three noisy pixels in the level2.evt file, extra rows are filled as -1
| Pixel properties | Quadrant properties | ||||||
|---|---|---|---|---|---|---|---|
| Quadrant | DetID | PixID | Counts | Sigma | Mean | Median | Sigma |
| A | 0 | 29 | 1742 | 9.35 | 535 | 502 | 132.6 |
| A | 7 | 110 | 1742 | 9.35 | 535 | 502 | 132.6 |
| A | 9 | 19 | 1632 | 8.52 | 535 | 502 | 132.6 |
| B | 2 | 9 | 1842 | 12.47 | 531 | 505 | 107.2 |
| B | 3 | 80 | 1501 | 9.29 | 531 | 505 | 107.2 |
| B | 5 | 128 | 1428 | 8.61 | 531 | 505 | 107.2 |
| C | 1 | 81 | 1420 | 8.25 | 456 | 427 | 120.3 |
| C | 1 | 80 | 1361 | 7.76 | 456 | 427 | 120.3 |
| C | 3 | 202 | 1359 | 7.75 | 456 | 427 | 120.3 |
| D | 7 | 3 | 1322 | 6.28 | 510 | 464 | 136.6 |
| D | 10 | 189 | 1318 | 6.25 | 510 | 464 | 136.6 |
| D | 6 | 231 | 1283 | 6.0 | 510 | 464 | 136.6 |
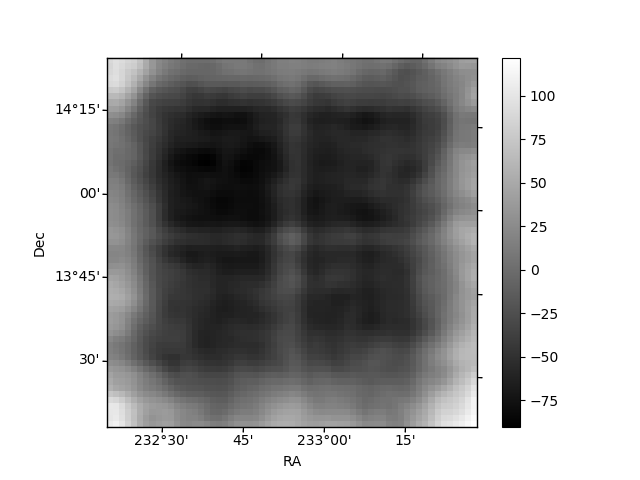
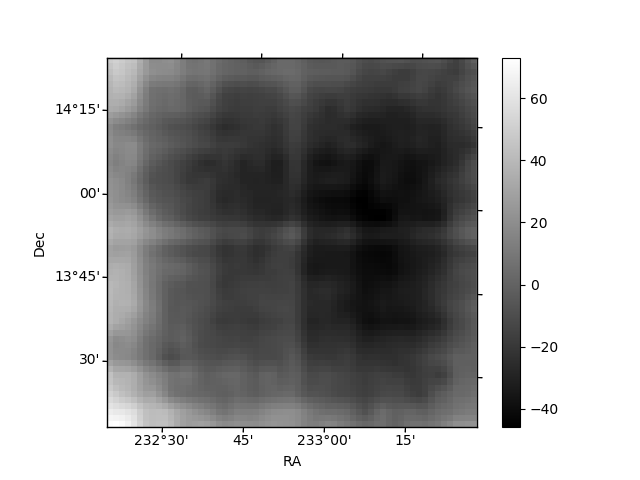
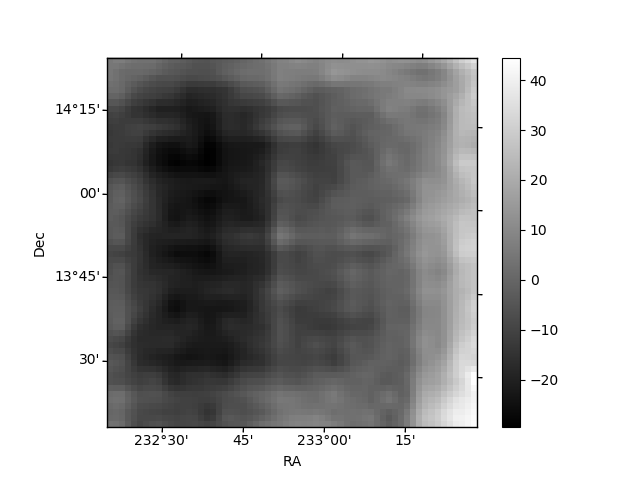
Histogram calculated using DETX and DETY for each event in the final _common_clean file
| Quadrant A |  |
 |
Quadrant B |
|---|---|---|---|
| Quadrant D |  |
 |
Quadrant C |
| Plot type | Count rate plots | Images |
|---|---|---|
| Comparison with Poisson distribution Blue bars denote a histogram of data divided into 1 sec bins. Red curve is a Poisson curve with rate = median count rate of data. |
 |
 |
| Quadrant-wise count rates Data is divided into 100 sec bins |
 |
|
| Module-wise count rates for Quadrant A Data is divided into 100 sec bins |
 |
 |
| Module-wise count rates for Quadrant B Data is divided into 100 sec bins |
 |
 |
| Module-wise count rates for Quadrant C Data is divided into 100 sec bins |
 |
 |
| Module-wise count rates for Quadrant D Data is divided into 100 sec bins |
 |
 |
| Parameter | Plot |
|---|---|
| CZT HV Monitor |  |
| D_VDD |  |
| Temperature 1 |  |
| Veto HV Monitor |  |
| Veto LLD |  |
| Alpha Counter |  |
| _CPM_Rate |  |
| CZT Counter | 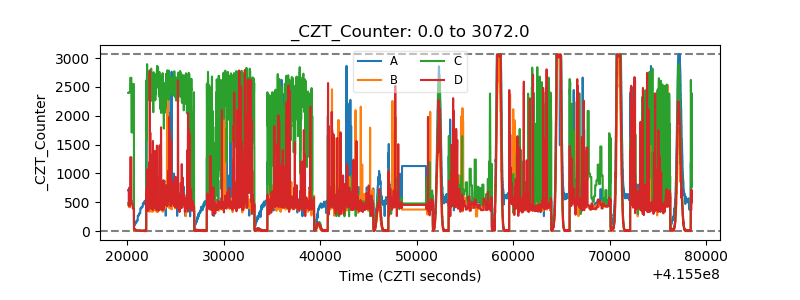 |
| +2.5 Volts monitor |  |
| +5 Volts monitor | 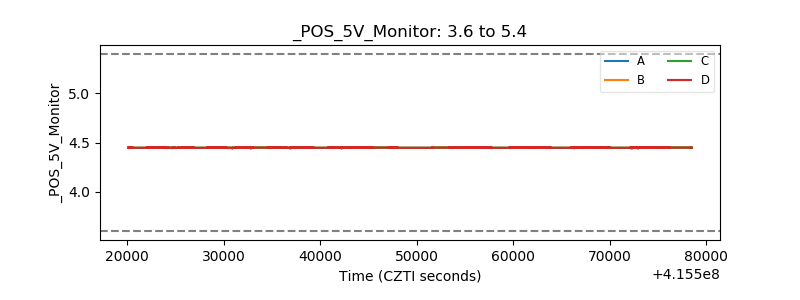 |
| _ROLL_ROT | 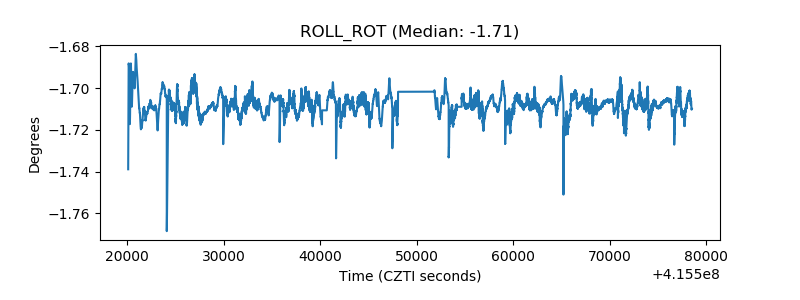 |
| _Roll_DEC |  |
| _Roll_RA |  |
| Veto Counter |  |