| Param | Original file | Final file |
|---|---|---|
| Filename | modeM0/AS1A12_068T02_9000005524cztM0_level2.fits | modeM0/AS1A12_068T02_9000005524cztM0_level2_quad_clean.evt |
| Size (bytes) | 339,825,600 | 338,875,200 |
| Size | 324.1 MB | 323.2 MB |
| Events in quadrant A | 2,324,904 | 2,471,416 |
| Events in quadrant B | 2,263,714 | 2,511,325 |
| Events in quadrant C | 735,118 | 119,059 |
| Events in quadrant D | 1,984,440 | 2,197,232 |
| Mode M9 | |||
|---|---|---|---|
| Quadrant | BADHDUFLAG | Total packets | Discarded packets |
| A | 0 | 186 | 0 |
| B | 0 | 185 | 0 |
| C | 0 | 184 | 0 |
| D | 0 | 185 | 0 |
| Mode SS | |||
|---|---|---|---|
| Quadrant | BADHDUFLAG | Total packets | Discarded packets |
| A | 0 | 890 | 0 |
| B | 0 | 892 | 0 |
| C | 0 | 885 | 0 |
| D | 0 | 886 | 0 |
| Mode M0 | |||
|---|---|---|---|
| Quadrant | BADHDUFLAG | Total packets | Discarded packets |
| A | 0 | 93699 | 0 |
| B | 0 | 91790 | 0 |
| C | 0 | 350972 | 0 |
| D | 0 | 108888 | 0 |
| Quadrant | Total seconds | Saturated seconds | Saturation percentage |
|---|---|---|---|
| A | 43294 | 319 | 0.736823% |
| B | 43272 | 417 | 0.963672% |
| C | 42698 | 40412 | 94.646119% |
| D | 43285 | 1470 | 3.396096% |
Noise dominated data is calculated using 1-second bins in cleaned event files. If a bin has >2000 counts, and if more than 50% of those come from <1% of pixels, then it is considered to be noise-dominated and hence unusable.
| Quadrant | # 1 sec bins | Bins with >0 counts | Bins with >2000 counts | High rate bins dominated by noise | Noise dominated (total time) | Noise dominated (detector-on time) | Marked lightcurve |
|---|---|---|---|---|---|---|---|
| A | 63298 | 43355 | 0 | 0 | 0.00% | 0.00% |  |
| B | 63298 | 43314 | 0 | 0 | 0.00% | 0.00% | 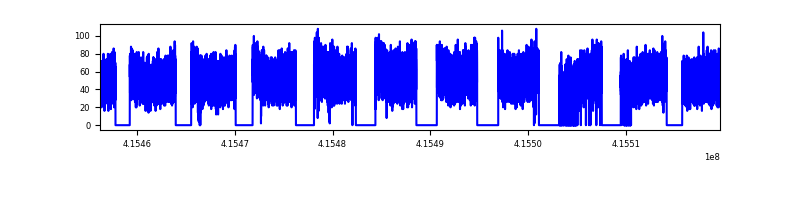 |
| C | 63298 | 41585 | 0 | 0 | 0.00% | 0.00% | 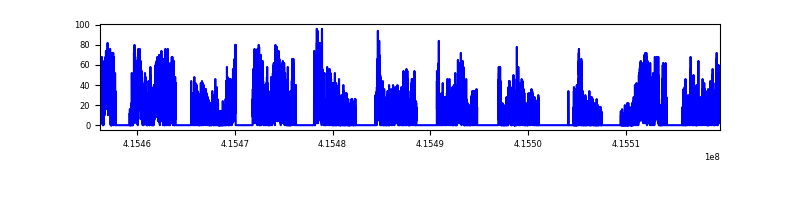 |
| D | 63298 | 43319 | 0 | 0 | 0.00% | 0.00% |  |
Top three noisy pixels from each quadrant. If the there are fewer than three noisy pixels in the level2.evt file, extra rows are filled as -1
| Pixel properties | Quadrant properties | ||||||
|---|---|---|---|---|---|---|---|
| Quadrant | DetID | PixID | Counts | Sigma | Mean | Median | Sigma |
| A | 7 | 110 | 1979 | 9.2 | 606 | 568 | 153.4 |
| A | 0 | 29 | 1902 | 8.7 | 606 | 568 | 153.4 |
| A | 9 | 19 | 1894 | 8.64 | 606 | 568 | 153.4 |
| B | 2 | 9 | 1865 | 10.86 | 598 | 572 | 119.0 |
| B | 3 | 80 | 1697 | 9.45 | 598 | 572 | 119.0 |
| B | 5 | 128 | 1574 | 8.42 | 598 | 572 | 119.0 |
| C | 1 | 81 | 636 | 8.51 | 194 | 184 | 53.1 |
| C | 3 | 202 | 625 | 8.31 | 194 | 184 | 53.1 |
| C | 1 | 80 | 602 | 7.87 | 194 | 184 | 53.1 |
| D | 10 | 189 | 1499 | 6.4 | 568 | 518 | 153.4 |
| D | 7 | 3 | 1488 | 6.33 | 568 | 518 | 153.4 |
| D | 1 | 3 | 1462 | 6.16 | 568 | 518 | 153.4 |
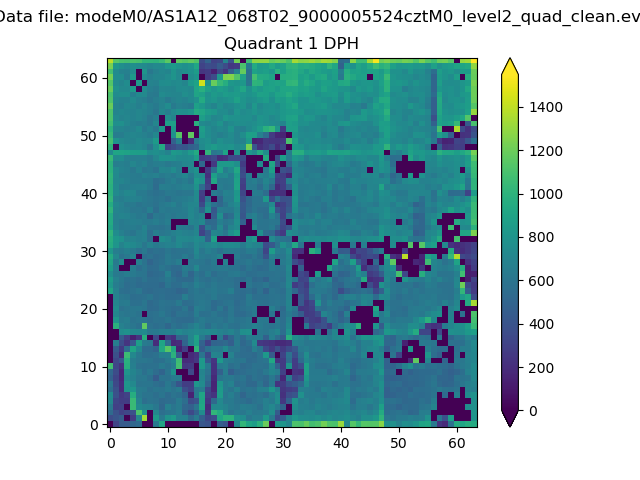
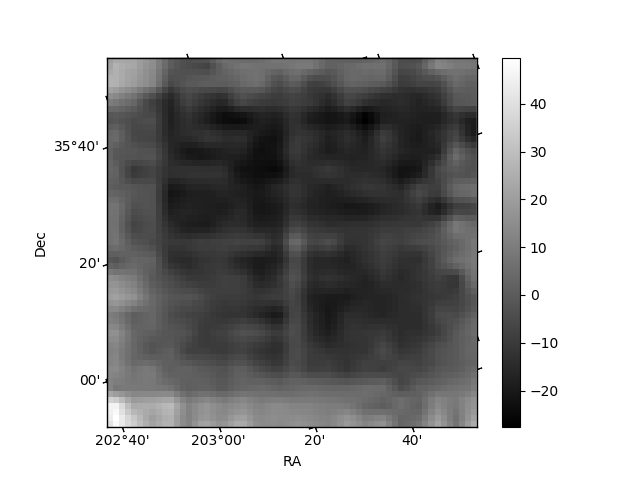
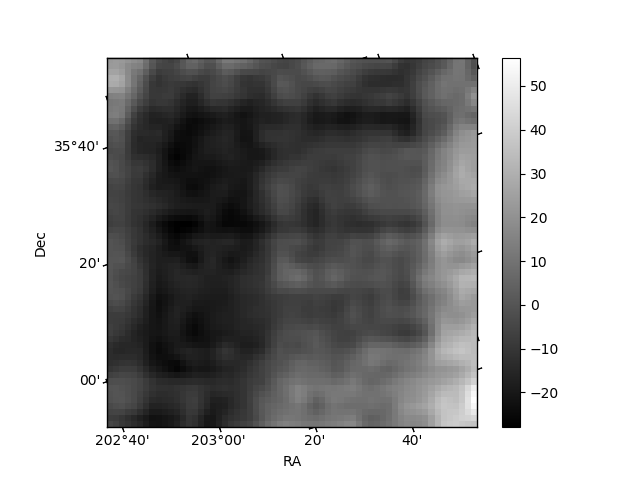
Histogram calculated using DETX and DETY for each event in the final _common_clean file
| Quadrant A |  |
 |
Quadrant B |
|---|---|---|---|
| Quadrant D |  |
 |
Quadrant C |
| Plot type | Count rate plots | Images |
|---|---|---|
| Comparison with Poisson distribution Blue bars denote a histogram of data divided into 1 sec bins. Red curve is a Poisson curve with rate = median count rate of data. |
 |
 |
| Quadrant-wise count rates Data is divided into 100 sec bins |
 |
|
| Module-wise count rates for Quadrant A Data is divided into 100 sec bins |
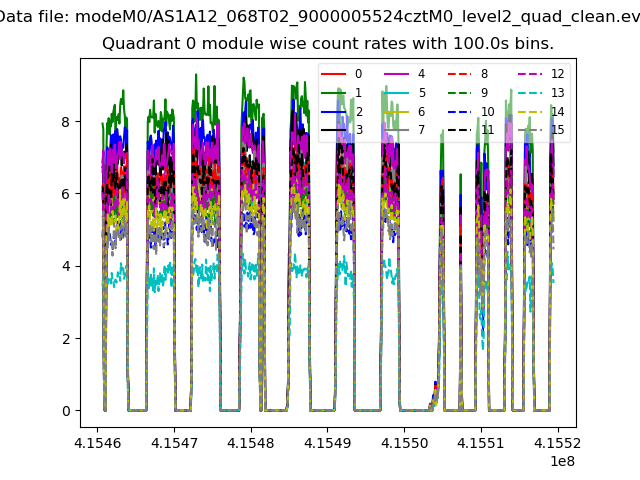 |
 |
| Module-wise count rates for Quadrant B Data is divided into 100 sec bins |
 |
 |
| Module-wise count rates for Quadrant C Data is divided into 100 sec bins |
 |
 |
| Module-wise count rates for Quadrant D Data is divided into 100 sec bins |
 |
 |
| Parameter | Plot |
|---|---|
| CZT HV Monitor |  |
| D_VDD |  |
| Temperature 1 |  |
| Veto HV Monitor |  |
| Veto LLD | 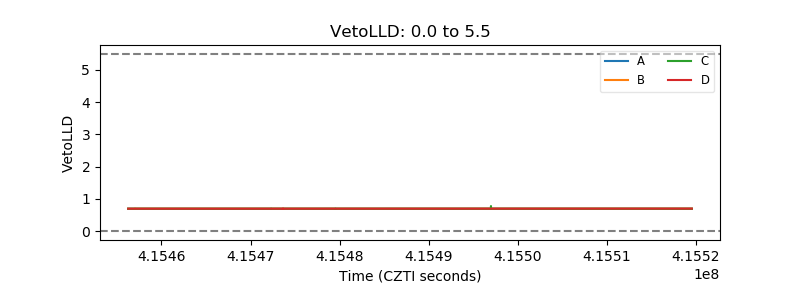 |
| Alpha Counter |  |
| _CPM_Rate | 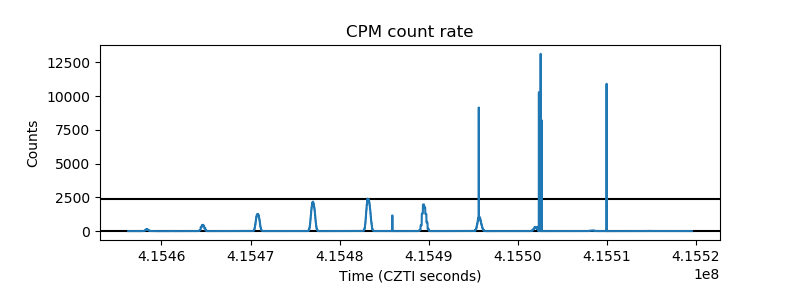 |
| CZT Counter |  |
| +2.5 Volts monitor | 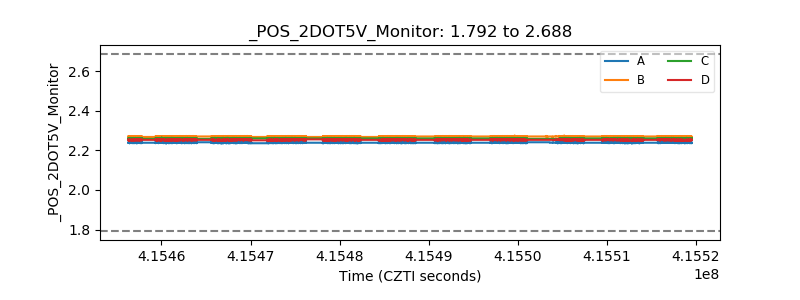 |
| +5 Volts monitor |  |
| _ROLL_ROT |  |
| _Roll_DEC |  |
| _Roll_RA | 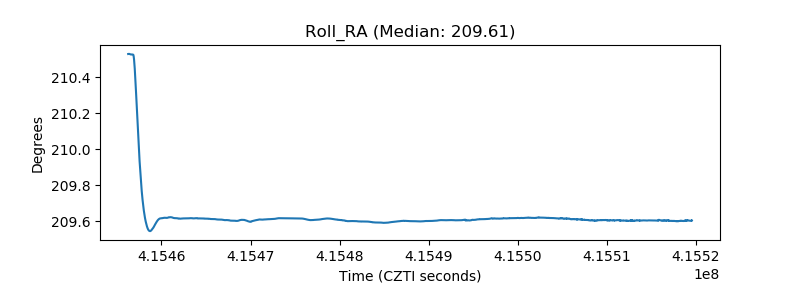 |
| Veto Counter |  |