| Param | Original file | Final file |
|---|---|---|
| Filename | modeM0/AS1A12_004T01_9000005520cztM0_level2.fits | modeM0/AS1A12_004T01_9000005520cztM0_level2_quad_clean.evt |
| Size (bytes) | 1,833,307,200 | 2,061,587,520 |
| Size | 1.7 GB | 1.9 GB |
| Events in quadrant A | 11,218,238 | 13,247,482 |
| Events in quadrant B | 10,916,696 | 13,517,261 |
| Events in quadrant C | 9,439,588 | 9,727,002 |
| Events in quadrant D | 9,375,316 | 11,406,923 |
| Mode M0 | |||
|---|---|---|---|
| Quadrant | BADHDUFLAG | Total packets | Discarded packets |
| A | 0 | 472512 | 0 |
| B | 0 | 451678 | 0 |
| C | 0 | 920589 | 0 |
| D | 0 | 599990 | 0 |
| Mode M9 | |||
|---|---|---|---|
| Quadrant | BADHDUFLAG | Total packets | Discarded packets |
| A | 0 | 821 | 0 |
| B | 0 | 821 | 0 |
| C | 0 | 821 | 0 |
| D | 0 | 821 | 0 |
| Mode SS | |||
|---|---|---|---|
| Quadrant | BADHDUFLAG | Total packets | Discarded packets |
| A | 0 | 4326 | 0 |
| B | 0 | 4326 | 0 |
| C | 0 | 4326 | 0 |
| D | 0 | 4326 | 0 |
| Quadrant | Total seconds | Saturated seconds | Saturation percentage |
|---|---|---|---|
| A | 212306 | 2227 | 1.048958% |
| B | 212306 | 1554 | 0.731962% |
| C | 212303 | 55943 | 26.350546% |
| D | 212305 | 13272 | 6.251384% |
Noise dominated data is calculated using 1-second bins in cleaned event files. If a bin has >2000 counts, and if more than 50% of those come from <1% of pixels, then it is considered to be noise-dominated and hence unusable.
| Quadrant | # 1 sec bins | Bins with >0 counts | Bins with >2000 counts | High rate bins dominated by noise | Noise dominated (total time) | Noise dominated (detector-on time) | Marked lightcurve |
|---|---|---|---|---|---|---|---|
| A | 293646 | 212275 | 0 | 0 | 0.00% | 0.00% |  |
| B | 293647 | 212293 | 0 | 0 | 0.00% | 0.00% | 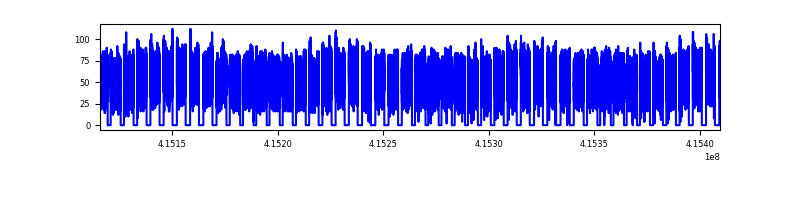 |
| C | 293645 | 211172 | 0 | 0 | 0.00% | 0.00% | 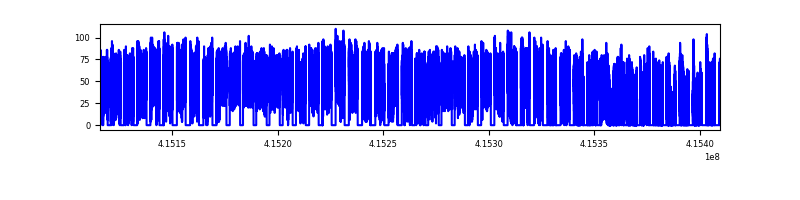 |
| D | 293646 | 211664 | 0 | 0 | 0.00% | 0.00% |  |
Top three noisy pixels from each quadrant. If the there are fewer than three noisy pixels in the level2.evt file, extra rows are filled as -1
| Pixel properties | Quadrant properties | ||||||
|---|---|---|---|---|---|---|---|
| Quadrant | DetID | PixID | Counts | Sigma | Mean | Median | Sigma |
| A | 0 | 29 | 9253 | 9.0 | 2929 | 2741 | 723.7 |
| A | 7 | 110 | 9221 | 8.95 | 2929 | 2741 | 723.7 |
| A | 9 | 19 | 9203 | 8.93 | 2929 | 2741 | 723.7 |
| B | 2 | 9 | 9565 | 12.22 | 2891 | 2755 | 557.3 |
| B | 2 | 8 | 7694 | 8.86 | 2891 | 2755 | 557.3 |
| B | 5 | 128 | 7641 | 8.77 | 2891 | 2755 | 557.3 |
| C | 1 | 81 | 7692 | 8.29 | 2497 | 2334 | 646.4 |
| C | 1 | 80 | 7385 | 7.81 | 2497 | 2334 | 646.4 |
| C | 3 | 202 | 7381 | 7.81 | 2497 | 2334 | 646.4 |
| D | 7 | 3 | 6954 | 6.3 | 2684 | 2446 | 716.0 |
| D | 4 | 160 | 6916 | 6.24 | 2684 | 2446 | 716.0 |
| D | 10 | 189 | 6717 | 5.97 | 2684 | 2446 | 716.0 |
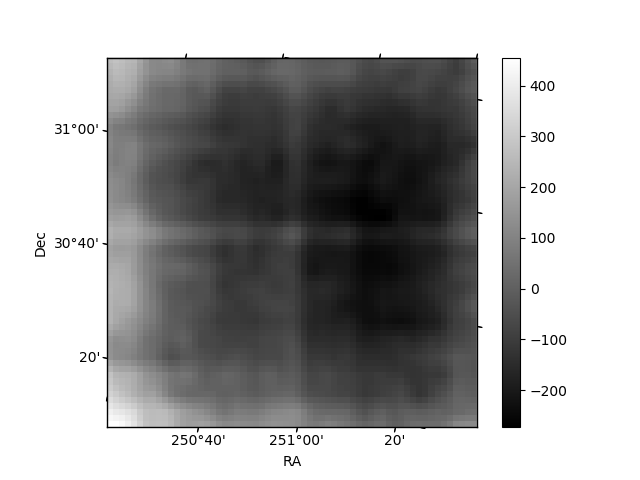
Histogram calculated using DETX and DETY for each event in the final _common_clean file
| Quadrant A |  |
 |
Quadrant B |
|---|---|---|---|
| Quadrant D |  |
 |
Quadrant C |
| Plot type | Count rate plots | Images |
|---|---|---|
| Comparison with Poisson distribution Blue bars denote a histogram of data divided into 1 sec bins. Red curve is a Poisson curve with rate = median count rate of data. |
 |
 |
| Quadrant-wise count rates Data is divided into 100 sec bins |
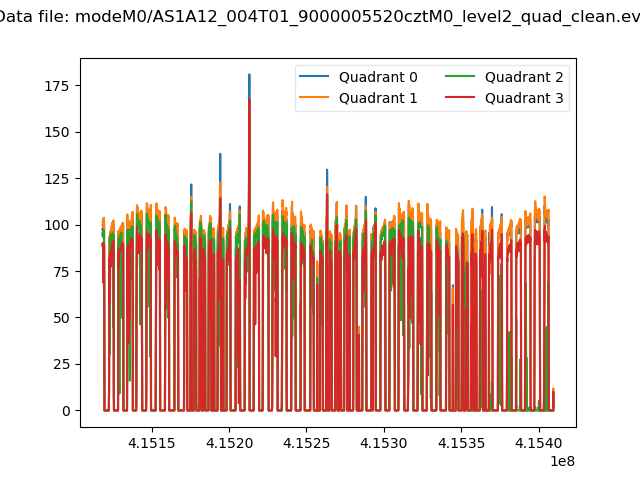 |
|
| Module-wise count rates for Quadrant A Data is divided into 100 sec bins |
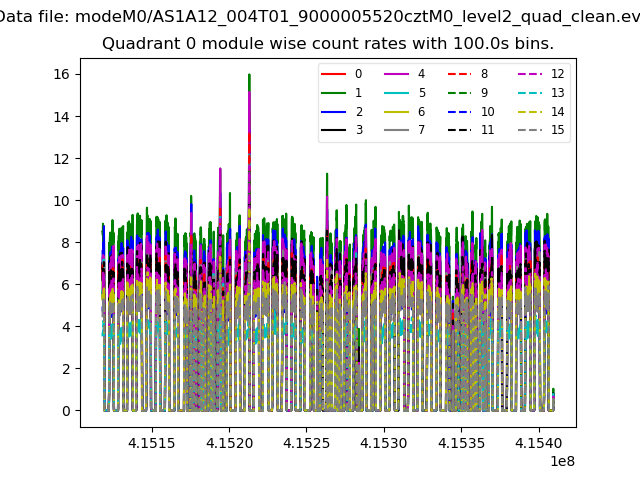 |
 |
| Module-wise count rates for Quadrant B Data is divided into 100 sec bins |
 |
 |
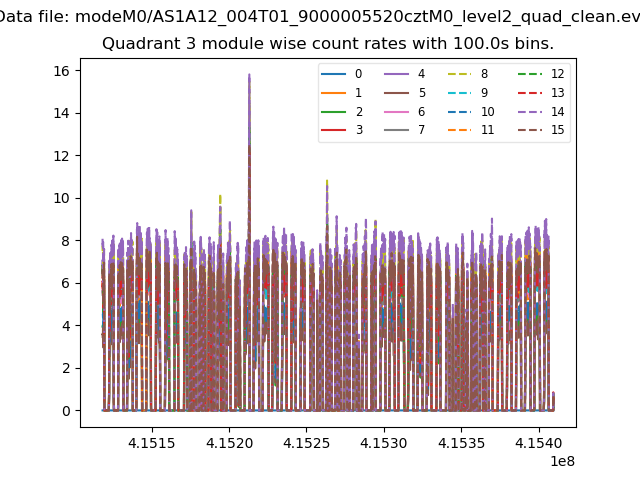
| Module-wise count rates for Quadrant C Data is divided into 100 sec bins |
 |
 |
| Module-wise count rates for Quadrant D Data is divided into 100 sec bins |
 |
 |
| Parameter | Plot |
|---|---|
| CZT HV Monitor |  |
| D_VDD |  |
| Temperature 1 |  |
| Veto HV Monitor |  |
| Veto LLD | 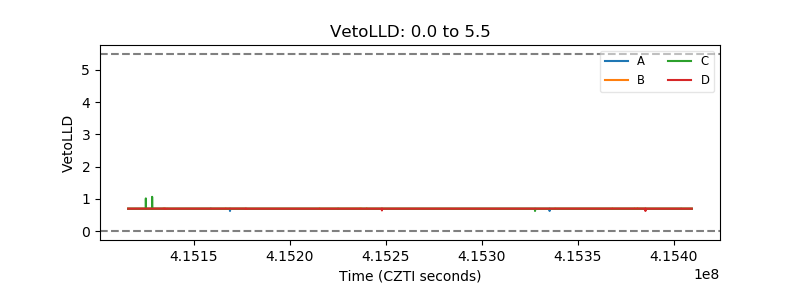 |
| Alpha Counter |  |
| _CPM_Rate |  |
| CZT Counter | 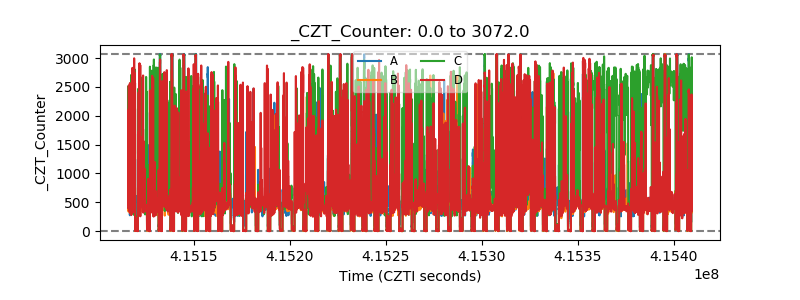 |
| +2.5 Volts monitor |  |
| +5 Volts monitor | 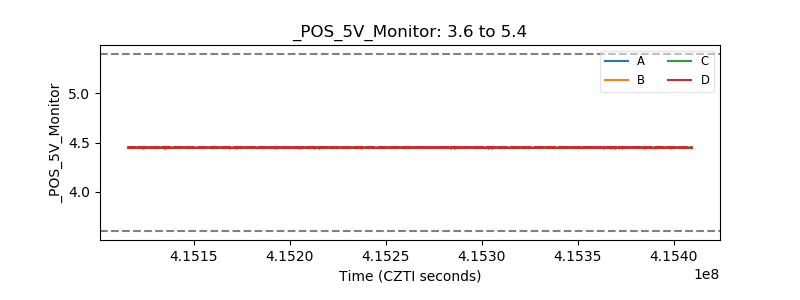 |
| _ROLL_ROT | 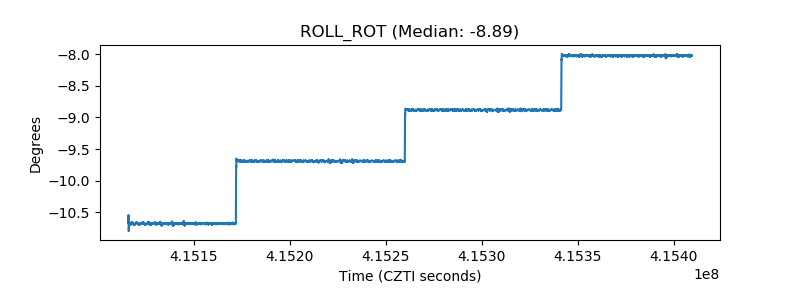 |
| _Roll_DEC |  |
| _Roll_RA |  |
| Veto Counter |  |