| Param | Original file | Final file |
|---|---|---|
| Filename | modeM0/AS1T05_086T01_9000005518cztM0_level2.fits | modeM0/AS1T05_086T01_9000005518cztM0_level2_quad_clean.evt |
| Size (bytes) | 687,980,160 | 854,674,560 |
| Size | 656.1 MB | 815.1 MB |
| Events in quadrant A | 4,163,100 | 5,687,277 |
| Events in quadrant B | 4,050,728 | 5,750,630 |
| Events in quadrant C | 3,864,188 | 4,755,795 |
| Events in quadrant D | 3,337,012 | 4,278,218 |
| Mode SS | |||
|---|---|---|---|
| Quadrant | BADHDUFLAG | Total packets | Discarded packets |
| A | 0 | 1610 | 0 |
| B | 0 | 1610 | 0 |
| C | 0 | 1610 | 0 |
| D | 0 | 1610 | 0 |
| Mode M0 | |||
|---|---|---|---|
| Quadrant | BADHDUFLAG | Total packets | Discarded packets |
| A | 0 | 171433 | 0 |
| B | 0 | 164553 | 0 |
| C | 0 | 281873 | 0 |
| D | 0 | 245071 | 0 |
| Mode M9 | |||
|---|---|---|---|
| Quadrant | BADHDUFLAG | Total packets | Discarded packets |
| A | 0 | 285 | 0 |
| B | 0 | 285 | 0 |
| C | 0 | 285 | 0 |
| D | 0 | 285 | 0 |
| Quadrant | Total seconds | Saturated seconds | Saturation percentage |
|---|---|---|---|
| A | 78966 | 395 | 0.500215% |
| B | 78964 | 200 | 0.253280% |
| C | 78963 | 8348 | 10.572040% |
| D | 78966 | 7748 | 9.811818% |
Noise dominated data is calculated using 1-second bins in cleaned event files. If a bin has >2000 counts, and if more than 50% of those come from <1% of pixels, then it is considered to be noise-dominated and hence unusable.
| Quadrant | # 1 sec bins | Bins with >0 counts | Bins with >2000 counts | High rate bins dominated by noise | Noise dominated (total time) | Noise dominated (detector-on time) | Marked lightcurve |
|---|---|---|---|---|---|---|---|
| A | 106673 | 78965 | 0 | 0 | 0.00% | 0.00% | 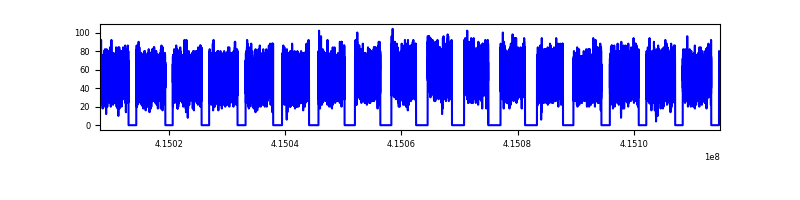 |
| B | 106673 | 78957 | 0 | 0 | 0.00% | 0.00% |  |
| C | 106673 | 78916 | 0 | 0 | 0.00% | 0.00% |  |
| D | 106673 | 78652 | 0 | 0 | 0.00% | 0.00% |  |
Top three noisy pixels from each quadrant. If the there are fewer than three noisy pixels in the level2.evt file, extra rows are filled as -1
| Pixel properties | Quadrant properties | ||||||
|---|---|---|---|---|---|---|---|
| Quadrant | DetID | PixID | Counts | Sigma | Mean | Median | Sigma |
| A | 7 | 110 | 3599 | 9.36 | 1088 | 1022 | 275.3 |
| A | 9 | 19 | 3387 | 8.59 | 1088 | 1022 | 275.3 |
| A | 0 | 29 | 3383 | 8.58 | 1088 | 1022 | 275.3 |
| B | 2 | 9 | 3498 | 12.08 | 1068 | 1022 | 205.0 |
| B | 3 | 80 | 2978 | 9.54 | 1068 | 1022 | 205.0 |
| B | 2 | 8 | 2871 | 9.02 | 1068 | 1022 | 205.0 |
| C | 1 | 81 | 3554 | 9.89 | 1020 | 957 | 262.6 |
| C | 1 | 80 | 3391 | 9.27 | 1020 | 957 | 262.6 |
| C | 3 | 202 | 3066 | 8.03 | 1020 | 957 | 262.6 |
| D | 10 | 189 | 2488 | 6.31 | 954 | 869 | 256.5 |
| D | 6 | 38 | 2444 | 6.14 | 954 | 869 | 256.5 |
| D | 7 | 3 | 2428 | 6.07 | 954 | 869 | 256.5 |
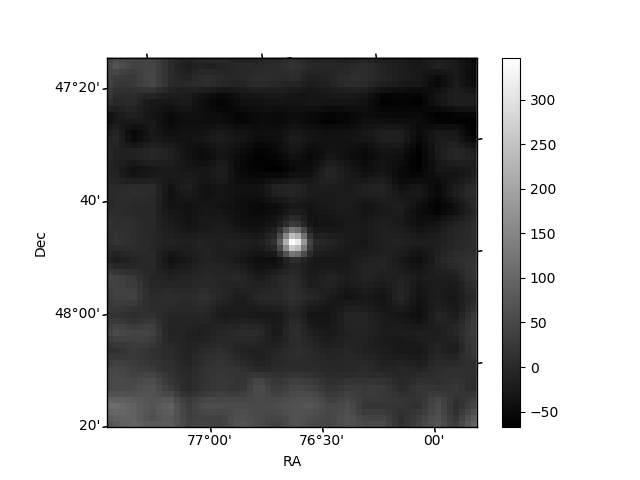
Histogram calculated using DETX and DETY for each event in the final _common_clean file
| Quadrant A |  |
 |
Quadrant B |
|---|---|---|---|
| Quadrant D | 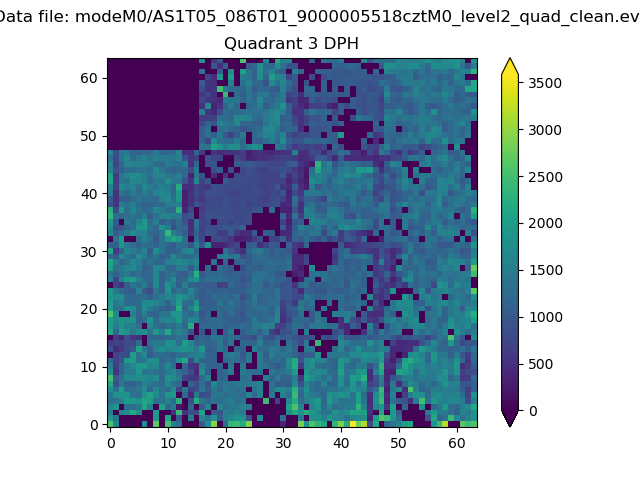 |
 |
Quadrant C |
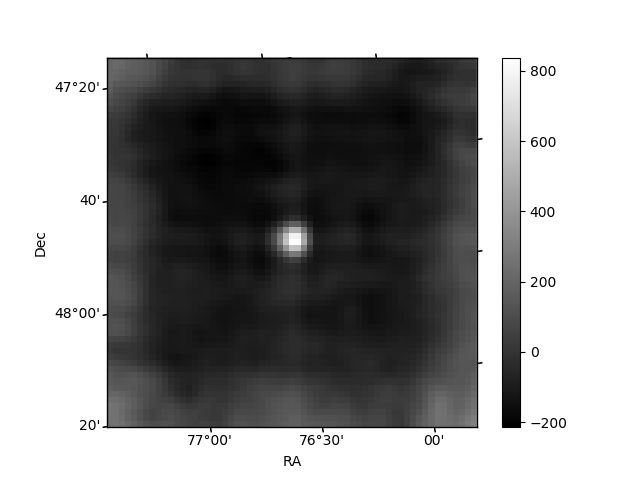
| Plot type | Count rate plots | Images |
|---|---|---|
| Comparison with Poisson distribution Blue bars denote a histogram of data divided into 1 sec bins. Red curve is a Poisson curve with rate = median count rate of data. |
 |
 |
| Quadrant-wise count rates Data is divided into 100 sec bins |
 |
|
| Module-wise count rates for Quadrant A Data is divided into 100 sec bins |
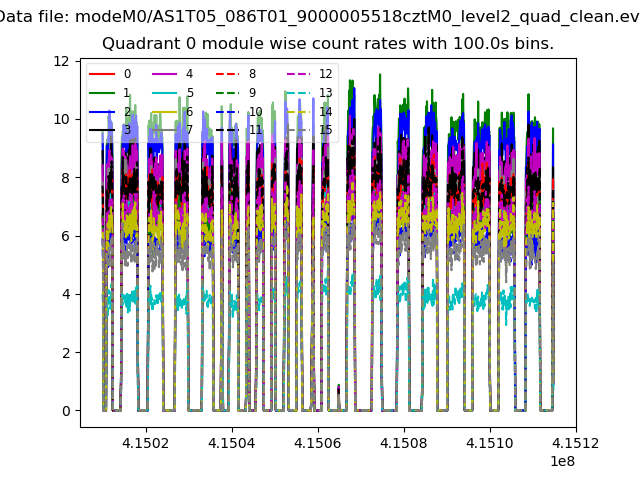 |
 |
| Module-wise count rates for Quadrant B Data is divided into 100 sec bins |
 |
 |
| Module-wise count rates for Quadrant C Data is divided into 100 sec bins |
 |
 |
| Module-wise count rates for Quadrant D Data is divided into 100 sec bins |
 |
 |
| Parameter | Plot |
|---|---|
| CZT HV Monitor |  |
| D_VDD |  |
| Temperature 1 | 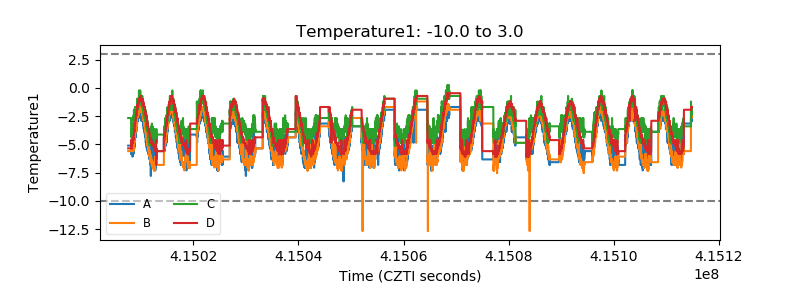 |
| Veto HV Monitor | 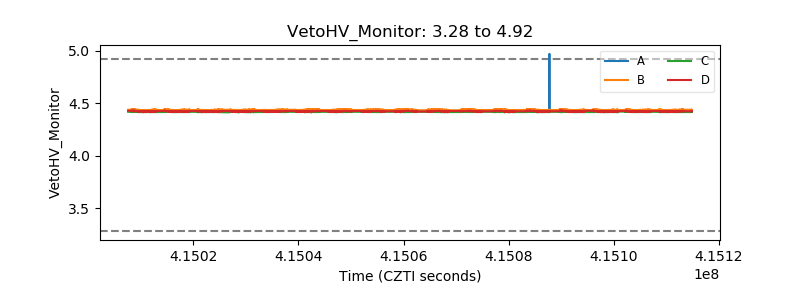 |
| Veto LLD |  |
| Alpha Counter |  |
| _CPM_Rate |  |
| CZT Counter |  |
| +2.5 Volts monitor |  |
| +5 Volts monitor |  |
| _ROLL_ROT |  |
| _Roll_DEC |  |
| _Roll_RA | 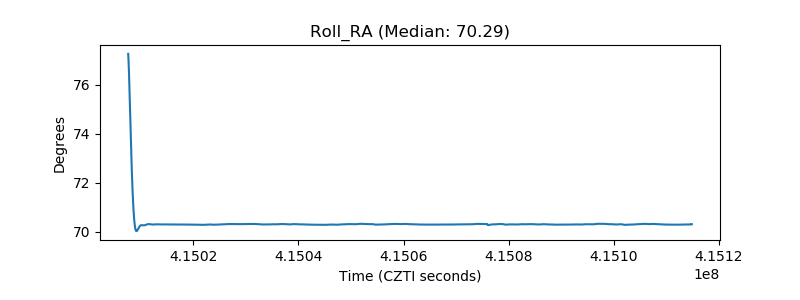 |
| Veto Counter | 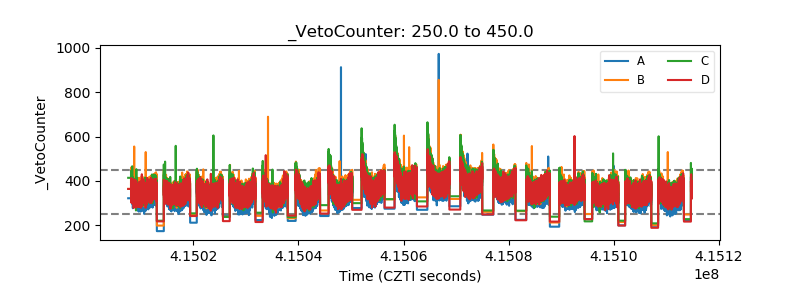 |