| Param | Original file | Final file |
|---|---|---|
| Filename | modeM0/AS1A12_054T03_9000005516cztM0_level2.fits | modeM0/AS1A12_054T03_9000005516cztM0_level2_quad_clean.evt |
| Size (bytes) | 4,094,043,840 | 4,459,101,120 |
| Size | 3.8 GB | 4.2 GB |
| Events in quadrant A | 24,523,852 | 26,818,599 |
| Events in quadrant B | 23,580,638 | 27,237,012 |
| Events in quadrant C | 24,135,402 | 26,166,188 |
| Events in quadrant D | 20,301,258 | 23,402,549 |
| Mode M9 | |||
|---|---|---|---|
| Quadrant | BADHDUFLAG | Total packets | Discarded packets |
| A | 0 | 1766 | 0 |
| B | 0 | 1766 | 0 |
| C | 0 | 1766 | 0 |
| D | 0 | 1766 | 0 |
| Mode SS | |||
|---|---|---|---|
| Quadrant | BADHDUFLAG | Total packets | Discarded packets |
| A | 0 | 9368 | 0 |
| B | 0 | 9365 | 0 |
| C | 0 | 9366 | 0 |
| D | 0 | 9365 | 0 |
| Mode M0 | |||
|---|---|---|---|
| Quadrant | BADHDUFLAG | Total packets | Discarded packets |
| A | 0 | 1023056 | 0 |
| B | 0 | 1026928 | 0 |
| C | 0 | 1085626 | 0 |
| D | 0 | 1248021 | 0 |
| Quadrant | Total seconds | Saturated seconds | Saturation percentage |
|---|---|---|---|
| A | 459064 | 4301 | 0.936906% |
| B | 459070 | 8448 | 1.840242% |
| C | 459064 | 8087 | 1.761628% |
| D | 459042 | 26924 | 5.865259% |
Noise dominated data is calculated using 1-second bins in cleaned event files. If a bin has >2000 counts, and if more than 50% of those come from <1% of pixels, then it is considered to be noise-dominated and hence unusable.
| Quadrant | # 1 sec bins | Bins with >0 counts | Bins with >2000 counts | High rate bins dominated by noise | Noise dominated (total time) | Noise dominated (detector-on time) | Marked lightcurve |
|---|---|---|---|---|---|---|---|
| A | 640585 | 459139 | 0 | 0 | 0.00% | 0.00% |  |
| B | 640585 | 459103 | 0 | 0 | 0.00% | 0.00% |  |
| C | 640585 | 459014 | 0 | 0 | 0.00% | 0.00% |  |
| D | 640585 | 458221 | 0 | 0 | 0.00% | 0.00% | 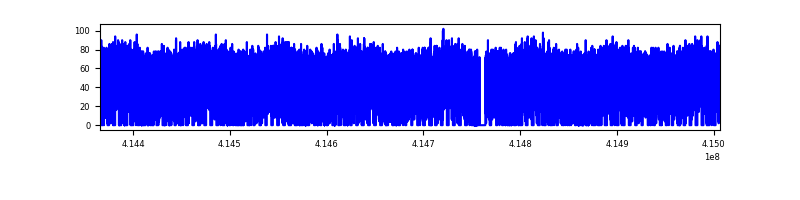 |
Top three noisy pixels from each quadrant. If the there are fewer than three noisy pixels in the level2.evt file, extra rows are filled as -1
| Pixel properties | Quadrant properties | ||||||
|---|---|---|---|---|---|---|---|
| Quadrant | DetID | PixID | Counts | Sigma | Mean | Median | Sigma |
| A | 7 | 110 | 20192 | 8.94 | 6404 | 6001 | 1587.0 |
| A | 9 | 19 | 20129 | 8.9 | 6404 | 6001 | 1587.0 |
| A | 0 | 29 | 20049 | 8.85 | 6404 | 6001 | 1587.0 |
| B | 2 | 9 | 20187 | 11.61 | 6256 | 5960 | 1225.7 |
| B | 3 | 80 | 17914 | 9.75 | 6256 | 5960 | 1225.7 |
| B | 5 | 128 | 16491 | 8.59 | 6256 | 5960 | 1225.7 |
| C | 1 | 81 | 19581 | 8.29 | 6389 | 5972 | 1641.6 |
| C | 3 | 202 | 18995 | 7.93 | 6389 | 5972 | 1641.6 |
| C | 1 | 80 | 18951 | 7.91 | 6389 | 5972 | 1641.6 |
| D | 10 | 189 | 15005 | 6.24 | 5828 | 5306 | 1554.5 |
| D | 7 | 3 | 14984 | 6.23 | 5828 | 5306 | 1554.5 |
| D | 4 | 160 | 14605 | 5.98 | 5828 | 5306 | 1554.5 |
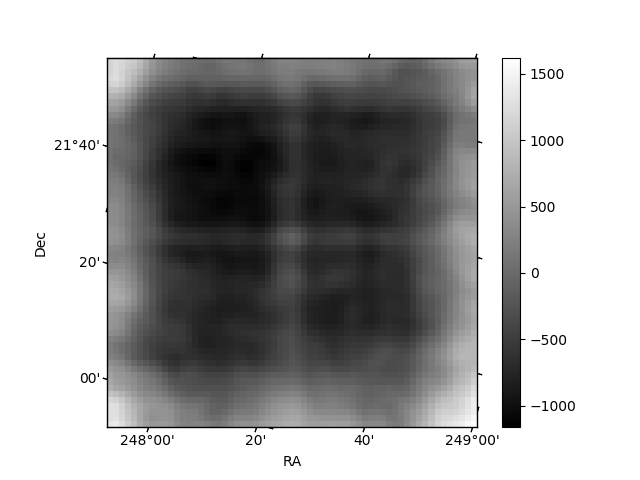
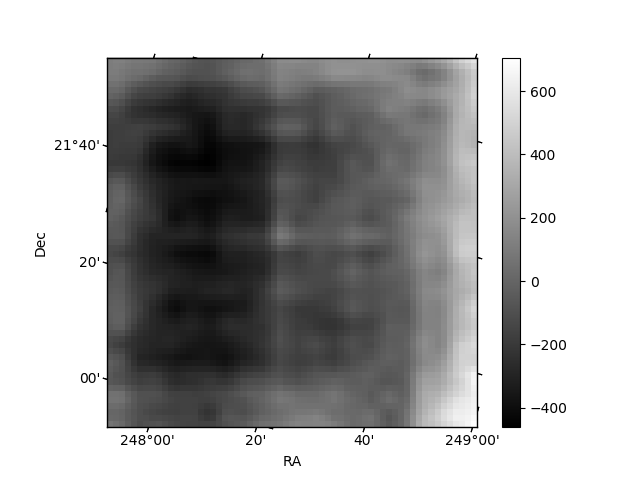
Histogram calculated using DETX and DETY for each event in the final _common_clean file
| Quadrant A |  |
 |
Quadrant B |
|---|---|---|---|
| Quadrant D |  |
 |
Quadrant C |
| Plot type | Count rate plots | Images |
|---|---|---|
| Comparison with Poisson distribution Blue bars denote a histogram of data divided into 1 sec bins. Red curve is a Poisson curve with rate = median count rate of data. |
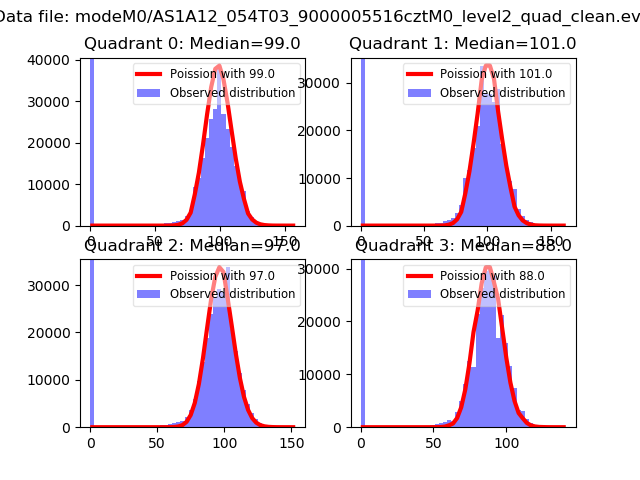 |
 |
| Quadrant-wise count rates Data is divided into 100 sec bins |
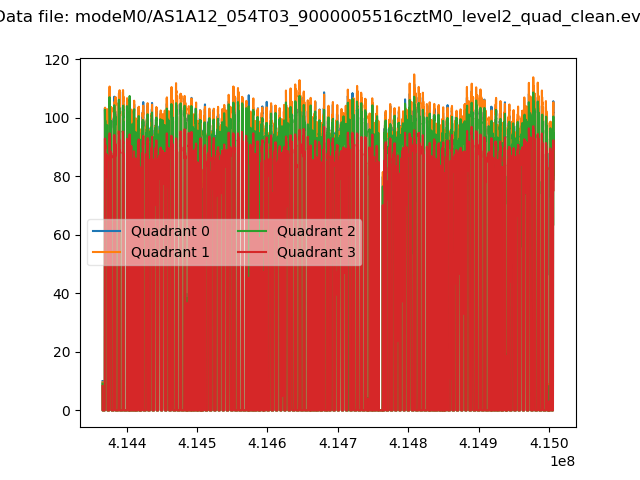 |
|
| Module-wise count rates for Quadrant A Data is divided into 100 sec bins |
 |
 |
| Module-wise count rates for Quadrant B Data is divided into 100 sec bins |
 |
 |
| Module-wise count rates for Quadrant C Data is divided into 100 sec bins |
 |
 |
| Module-wise count rates for Quadrant D Data is divided into 100 sec bins |
 |
 |
| Parameter | Plot |
|---|---|
| CZT HV Monitor |  |
| D_VDD | 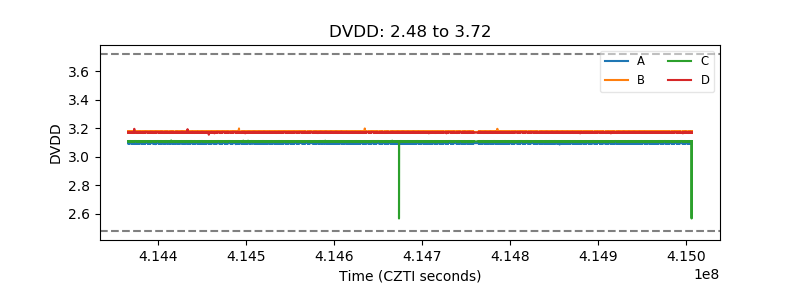 |
| Temperature 1 |  |
| Veto HV Monitor | 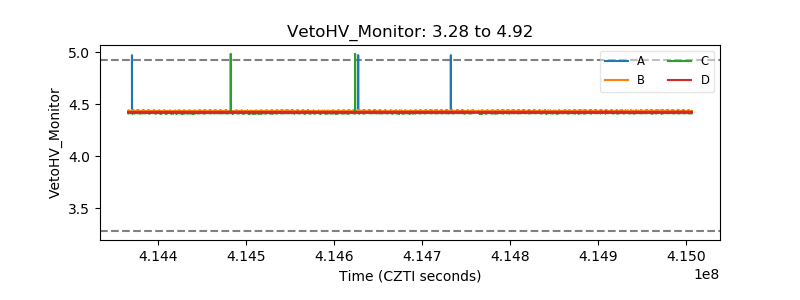 |
| Veto LLD |  |
| Alpha Counter |  |
| _CPM_Rate | 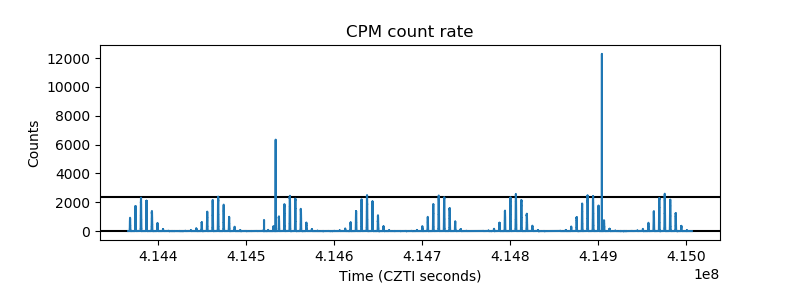 |
| CZT Counter |  |
| +2.5 Volts monitor |  |
| +5 Volts monitor |  |
| _ROLL_ROT |  |
| _Roll_DEC |  |
| _Roll_RA |  |
| Veto Counter |  |