| Param | Original file | Final file |
|---|---|---|
| Filename | modeM0/AS1A12_032T02_9000005510cztM0_level2.fits | modeM0/AS1A12_032T02_9000005510cztM0_level2_quad_clean.evt |
| Size (bytes) | 30,070,080 | 43,306,560 |
| Size | 28.7 MB | 41.3 MB |
| Events in quadrant A | 179,940 | 280,987 |
| Events in quadrant B | 169,610 | 278,372 |
| Events in quadrant C | 168,154 | 268,161 |
| Events in quadrant D | 151,365 | 241,882 |
| Mode M9 | |||
|---|---|---|---|
| Quadrant | BADHDUFLAG | Total packets | Discarded packets |
| A | 0 | 16 | 0 |
| B | 0 | 16 | 0 |
| C | 0 | 16 | 0 |
| D | 0 | 16 | 0 |
| Mode SS | |||
|---|---|---|---|
| Quadrant | BADHDUFLAG | Total packets | Discarded packets |
| A | 0 | 78 | 0 |
| B | 0 | 82 | 0 |
| C | 0 | 78 | 0 |
| D | 0 | 75 | 0 |
| Mode M0 | |||
|---|---|---|---|
| Quadrant | BADHDUFLAG | Total packets | Discarded packets |
| A | 0 | 7295 | 0 |
| B | 0 | 7461 | 0 |
| C | 0 | 8079 | 0 |
| D | 0 | 7656 | 0 |
| Quadrant | Total seconds | Saturated seconds | Saturation percentage |
|---|---|---|---|
| A | 3410 | 3 | 0.087977% |
| B | 3378 | 68 | 2.013025% |
| C | 3346 | 210 | 6.276151% |
| D | 3358 | 30 | 0.893389% |
Noise dominated data is calculated using 1-second bins in cleaned event files. If a bin has >2000 counts, and if more than 50% of those come from <1% of pixels, then it is considered to be noise-dominated and hence unusable.
| Quadrant | # 1 sec bins | Bins with >0 counts | Bins with >2000 counts | High rate bins dominated by noise | Noise dominated (total time) | Noise dominated (detector-on time) | Marked lightcurve |
|---|---|---|---|---|---|---|---|
| A | 5816 | 3468 | 0 | 0 | 0.00% | 0.00% | 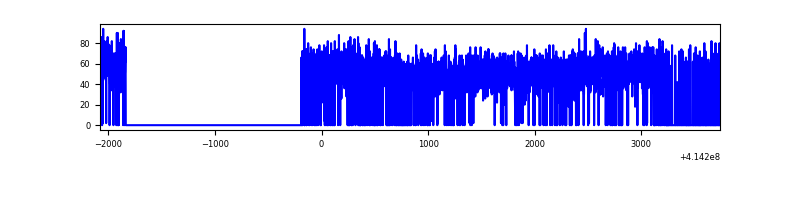 |
| B | 5816 | 3435 | 0 | 0 | 0.00% | 0.00% |  |
| C | 5816 | 3383 | 0 | 0 | 0.00% | 0.00% |  |
| D | 5816 | 3414 | 0 | 0 | 0.00% | 0.00% |  |
Top three noisy pixels from each quadrant. If the there are fewer than three noisy pixels in the level2.evt file, extra rows are filled as -1
| Pixel properties | Quadrant properties | ||||||
|---|---|---|---|---|---|---|---|
| Quadrant | DetID | PixID | Counts | Sigma | Mean | Median | Sigma |
| A | 0 | 29 | 170 | 9.19 | 46 | 44 | 13.7 |
| A | 7 | 110 | 165 | 8.83 | 46 | 44 | 13.7 |
| A | 0 | 30 | 150 | 7.73 | 46 | 44 | 13.7 |
| B | 2 | 9 | 160 | 10.39 | 45 | 43 | 11.3 |
| B | 3 | 80 | 134 | 8.08 | 45 | 43 | 11.3 |
| B | 5 | 128 | 132 | 7.9 | 45 | 43 | 11.3 |
| C | 1 | 80 | 167 | 9.39 | 44 | 41 | 13.4 |
| C | 1 | 81 | 166 | 9.31 | 44 | 41 | 13.4 |
| C | 3 | 158 | 131 | 6.7 | 44 | 41 | 13.4 |
| D | 7 | 3 | 126 | 6.6 | 43 | 39 | 13.2 |
| D | 10 | 189 | 121 | 6.22 | 43 | 39 | 13.2 |
| D | 6 | 67 | 120 | 6.15 | 43 | 39 | 13.2 |
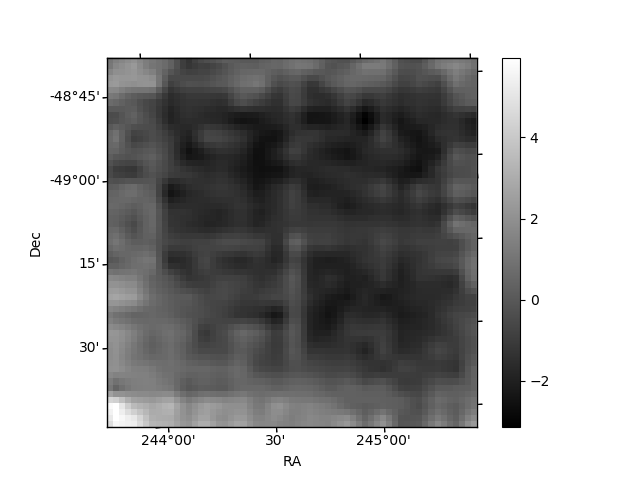
Histogram calculated using DETX and DETY for each event in the final _common_clean file
| Quadrant A |  |
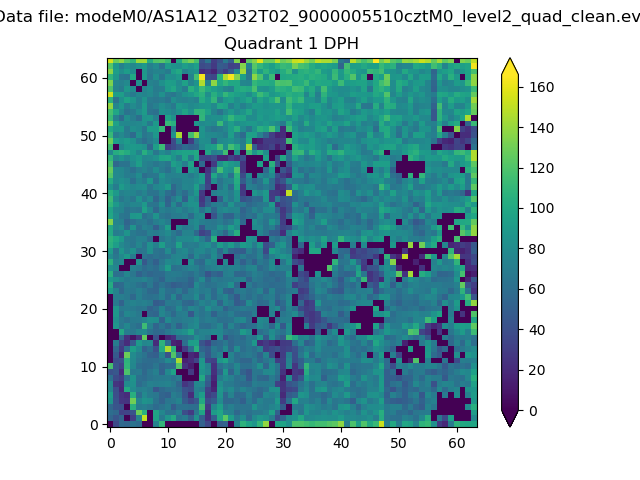 |
Quadrant B |
|---|---|---|---|
| Quadrant D |  |
 |
Quadrant C |
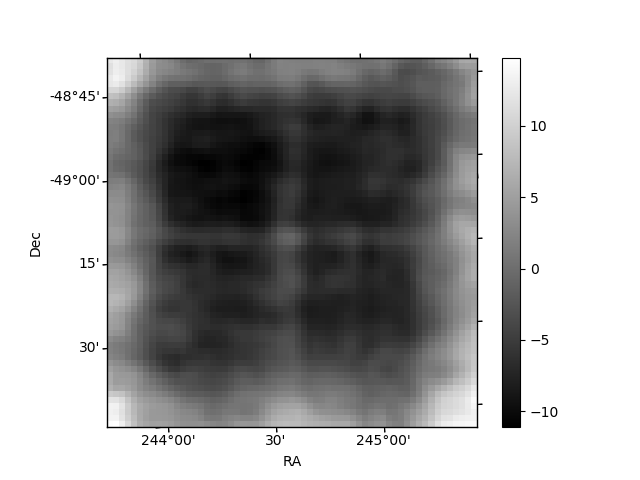
| Plot type | Count rate plots | Images |
|---|---|---|
| Comparison with Poisson distribution Blue bars denote a histogram of data divided into 1 sec bins. Red curve is a Poisson curve with rate = median count rate of data. |
 |
 |
| Quadrant-wise count rates Data is divided into 100 sec bins |
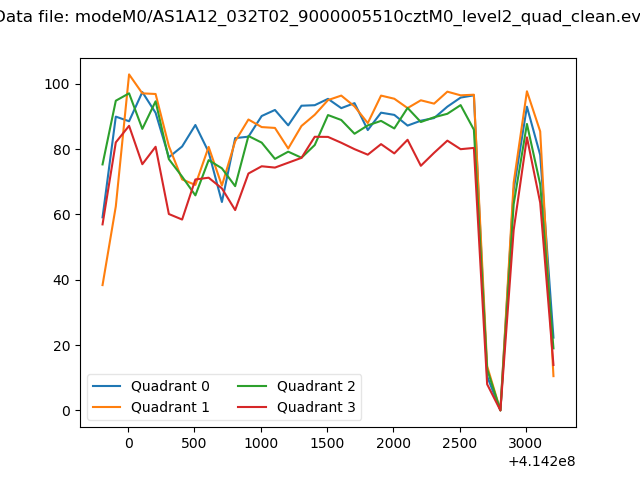 |
|
| Module-wise count rates for Quadrant A Data is divided into 100 sec bins |
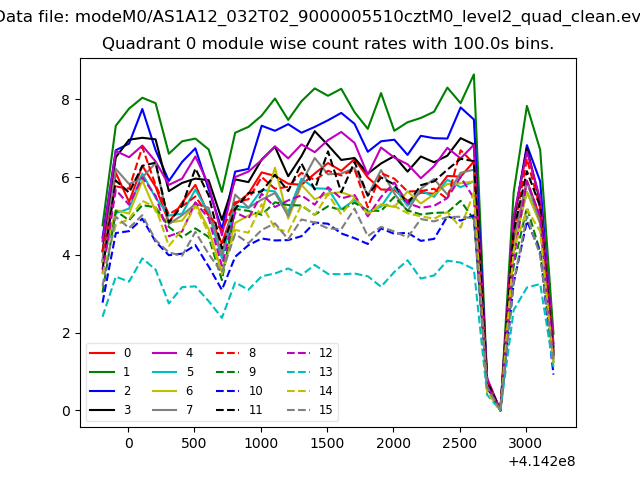 |
 |
| Module-wise count rates for Quadrant B Data is divided into 100 sec bins |
 |
 |
| Module-wise count rates for Quadrant C Data is divided into 100 sec bins |
 |
 |
| Module-wise count rates for Quadrant D Data is divided into 100 sec bins |
 |
 |
| Parameter | Plot |
|---|---|
| CZT HV Monitor | 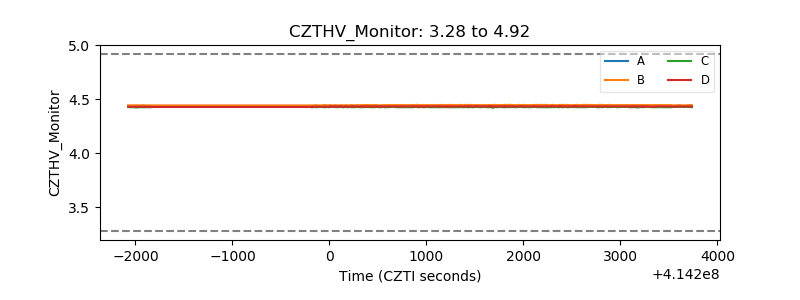 |
| D_VDD |  |
| Temperature 1 |  |
| Veto HV Monitor |  |
| Veto LLD |  |
| Alpha Counter |  |
| _CPM_Rate |  |
| CZT Counter |  |
| +2.5 Volts monitor |  |
| +5 Volts monitor |  |
| _ROLL_ROT |  |
| _Roll_DEC |  |
| _Roll_RA |  |
| Veto Counter |  |