| Param | Original file | Final file |
|---|---|---|
| Filename | modeM0/AS1A12_022T01_9000005498cztM0_level2.fits | modeM0/AS1A12_022T01_9000005498cztM0_level2_quad_clean.evt |
| Size (bytes) | 1,837,762,560 | 2,022,995,520 |
| Size | 1.7 GB | 1.9 GB |
| Events in quadrant A | 11,673,407 | 13,525,257 |
| Events in quadrant B | 10,804,165 | 13,060,787 |
| Events in quadrant C | 8,600,010 | 8,168,569 |
| Events in quadrant D | 9,780,020 | 11,765,375 |
| Mode M0 | |||
|---|---|---|---|
| Quadrant | BADHDUFLAG | Total packets | Discarded packets |
| A | 0 | 502055 | 0 |
| B | 0 | 561898 | 0 |
| C | 0 | 1155226 | 0 |
| D | 0 | 547261 | 0 |
| Mode M9 | |||
|---|---|---|---|
| Quadrant | BADHDUFLAG | Total packets | Discarded packets |
| A | 0 | 860 | 0 |
| B | 0 | 865 | 0 |
| C | 0 | 864 | 0 |
| D | 0 | 869 | 0 |
| Mode SS | |||
|---|---|---|---|
| Quadrant | BADHDUFLAG | Total packets | Discarded packets |
| A | 0 | 4442 | 0 |
| B | 0 | 4430 | 0 |
| C | 0 | 4436 | 0 |
| D | 0 | 4022 | 0 |
| Quadrant | Total seconds | Saturated seconds | Saturation percentage |
|---|---|---|---|
| A | 216065 | 2938 | 1.359776% |
| B | 215898 | 11954 | 5.536874% |
| C | 213994 | 86829 | 40.575437% |
| D | 216077 | 7869 | 3.641757% |
Noise dominated data is calculated using 1-second bins in cleaned event files. If a bin has >2000 counts, and if more than 50% of those come from <1% of pixels, then it is considered to be noise-dominated and hence unusable.
| Quadrant | # 1 sec bins | Bins with >0 counts | Bins with >2000 counts | High rate bins dominated by noise | Noise dominated (total time) | Noise dominated (detector-on time) | Marked lightcurve |
|---|---|---|---|---|---|---|---|
| A | 414045 | 217716 | 0 | 0 | 0.00% | 0.00% |  |
| B | 414045 | 217291 | 0 | 0 | 0.00% | 0.00% |  |
| C | 414045 | 213927 | 0 | 0 | 0.00% | 0.00% |  |
| D | 414045 | 217311 | 0 | 0 | 0.00% | 0.00% |  |
Top three noisy pixels from each quadrant. If the there are fewer than three noisy pixels in the level2.evt file, extra rows are filled as -1
| Pixel properties | Quadrant properties | ||||||
|---|---|---|---|---|---|---|---|
| Quadrant | DetID | PixID | Counts | Sigma | Mean | Median | Sigma |
| A | 9 | 19 | 9663 | 9.04 | 3046 | 2869 | 751.5 |
| A | 7 | 110 | 9618 | 8.98 | 3046 | 2869 | 751.5 |
| A | 0 | 29 | 9535 | 8.87 | 3046 | 2869 | 751.5 |
| B | 2 | 9 | 9324 | 11.84 | 2866 | 2738 | 556.3 |
| B | 3 | 80 | 8079 | 9.6 | 2866 | 2738 | 556.3 |
| B | 2 | 8 | 7517 | 8.59 | 2866 | 2738 | 556.3 |
| C | 1 | 81 | 7178 | 8.74 | 2278 | 2143 | 576.3 |
| C | 3 | 203 | 6936 | 8.32 | 2278 | 2143 | 576.3 |
| C | 3 | 202 | 6908 | 8.27 | 2278 | 2143 | 576.3 |
| D | 4 | 160 | 7187 | 6.24 | 2806 | 2569 | 740.0 |
| D | 10 | 189 | 7184 | 6.24 | 2806 | 2569 | 740.0 |
| D | 7 | 3 | 7162 | 6.21 | 2806 | 2569 | 740.0 |
Histogram calculated using DETX and DETY for each event in the final _common_clean file
| Quadrant A |  |
 |
Quadrant B |
|---|---|---|---|
| Quadrant D |  |
 |
Quadrant C |
| Plot type | Count rate plots | Images |
|---|---|---|
| Comparison with Poisson distribution Blue bars denote a histogram of data divided into 1 sec bins. Red curve is a Poisson curve with rate = median count rate of data. |
 |
 |
| Quadrant-wise count rates Data is divided into 100 sec bins |
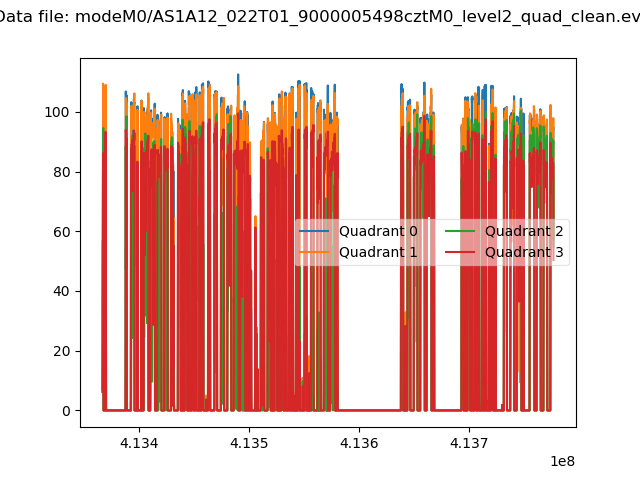 |
|
| Module-wise count rates for Quadrant A Data is divided into 100 sec bins |
 |
 |
| Module-wise count rates for Quadrant B Data is divided into 100 sec bins |
 |
 |
| Module-wise count rates for Quadrant C Data is divided into 100 sec bins |
 |
 |
| Module-wise count rates for Quadrant D Data is divided into 100 sec bins |
 |
 |
| Parameter | Plot |
|---|---|
| CZT HV Monitor |  |
| D_VDD |  |
| Temperature 1 |  |
| Veto HV Monitor |  |
| Veto LLD | 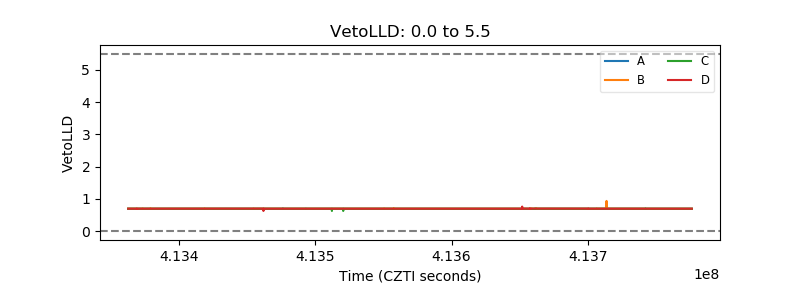 |
| Alpha Counter | 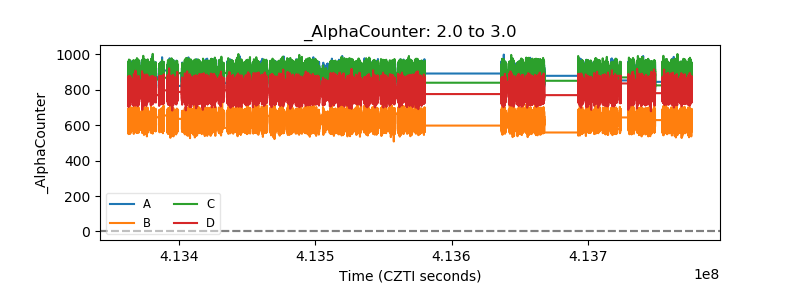 |
| _CPM_Rate |  |
| CZT Counter |  |
| +2.5 Volts monitor |  |
| +5 Volts monitor |  |
| _ROLL_ROT |  |
| _Roll_DEC |  |
| _Roll_RA |  |
| Veto Counter |  |