| Param | Original file | Final file |
|---|---|---|
| Filename | modeM0/AS1A12_051T01_9000005490cztM0_level2.fits | modeM0/AS1A12_051T01_9000005490cztM0_level2_quad_clean.evt |
| Size (bytes) | 1,271,269,440 | 1,304,596,800 |
| Size | 1.2 GB | 1.2 GB |
| Events in quadrant A | 6,672,360 | 5,680,066 |
| Events in quadrant B | 7,690,056 | 8,731,480 |
| Events in quadrant C | 7,323,864 | 7,496,903 |
| Events in quadrant D | 6,812,070 | 7,631,744 |
| Mode M9 | |||
|---|---|---|---|
| Quadrant | BADHDUFLAG | Total packets | Discarded packets |
| A | 0 | 588 | 0 |
| B | 0 | 588 | 0 |
| C | 0 | 588 | 0 |
| D | 0 | 589 | 0 |
| Mode M0 | |||
|---|---|---|---|
| Quadrant | BADHDUFLAG | Total packets | Discarded packets |
| A | 0 | 758530 | 0 |
| B | 0 | 325600 | 0 |
| C | 0 | 539482 | 0 |
| D | 0 | 363713 | 0 |
| Mode SS | |||
|---|---|---|---|
| Quadrant | BADHDUFLAG | Total packets | Discarded packets |
| A | 0 | 2974 | 0 |
| B | 0 | 2974 | 0 |
| C | 0 | 2974 | 0 |
| D | 0 | 2974 | 0 |
| Quadrant | Total seconds | Saturated seconds | Saturation percentage |
|---|---|---|---|
| A | 145465 | 53502 | 36.779981% |
| B | 145465 | 1954 | 1.343278% |
| C | 145465 | 18350 | 12.614718% |
| D | 145465 | 4184 | 2.876293% |
Noise dominated data is calculated using 1-second bins in cleaned event files. If a bin has >2000 counts, and if more than 50% of those come from <1% of pixels, then it is considered to be noise-dominated and hence unusable.
| Quadrant | # 1 sec bins | Bins with >0 counts | Bins with >2000 counts | High rate bins dominated by noise | Noise dominated (total time) | Noise dominated (detector-on time) | Marked lightcurve |
|---|---|---|---|---|---|---|---|
| A | 214195 | 145188 | 0 | 0 | 0.00% | 0.00% |  |
| B | 214195 | 145429 | 0 | 0 | 0.00% | 0.00% |  |
| C | 214195 | 145359 | 0 | 0 | 0.00% | 0.00% | 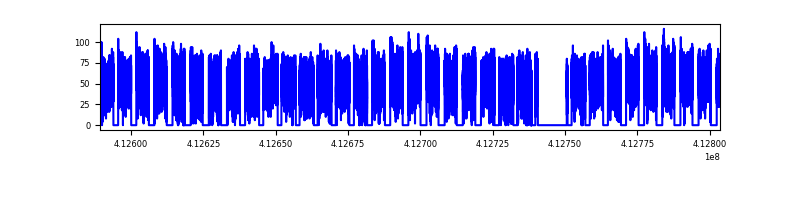 |
| D | 214196 | 145396 | 0 | 0 | 0.00% | 0.00% | 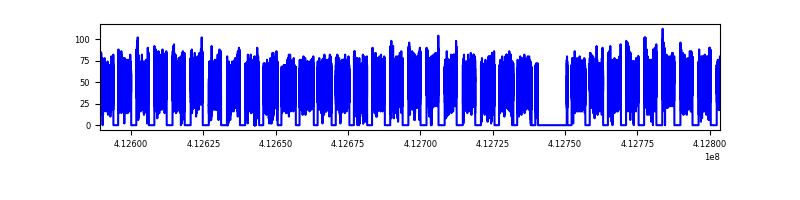 |
Top three noisy pixels from each quadrant. If the there are fewer than three noisy pixels in the level2.evt file, extra rows are filled as -1
| Pixel properties | Quadrant properties | ||||||
|---|---|---|---|---|---|---|---|
| Quadrant | DetID | PixID | Counts | Sigma | Mean | Median | Sigma |
| A | 0 | 29 | 5562 | 9.14 | 1743 | 1636 | 429.4 |
| A | 7 | 110 | 5443 | 8.87 | 1743 | 1636 | 429.4 |
| A | 9 | 19 | 5382 | 8.72 | 1743 | 1636 | 429.4 |
| B | 2 | 9 | 6586 | 11.83 | 2039 | 1950 | 392.0 |
| B | 3 | 80 | 5699 | 9.56 | 2039 | 1950 | 392.0 |
| B | 2 | 8 | 5352 | 8.68 | 2039 | 1950 | 392.0 |
| C | 1 | 81 | 6069 | 8.59 | 1937 | 1820 | 494.9 |
| C | 1 | 80 | 5826 | 8.1 | 1937 | 1820 | 494.9 |
| C | 3 | 202 | 5747 | 7.94 | 1937 | 1820 | 494.9 |
| D | 7 | 3 | 5015 | 6.16 | 1950 | 1778 | 525.6 |
| D | 3 | 14 | 4960 | 6.05 | 1950 | 1778 | 525.6 |
| D | 4 | 160 | 4950 | 6.03 | 1950 | 1778 | 525.6 |
Histogram calculated using DETX and DETY for each event in the final _common_clean file
| Quadrant A | 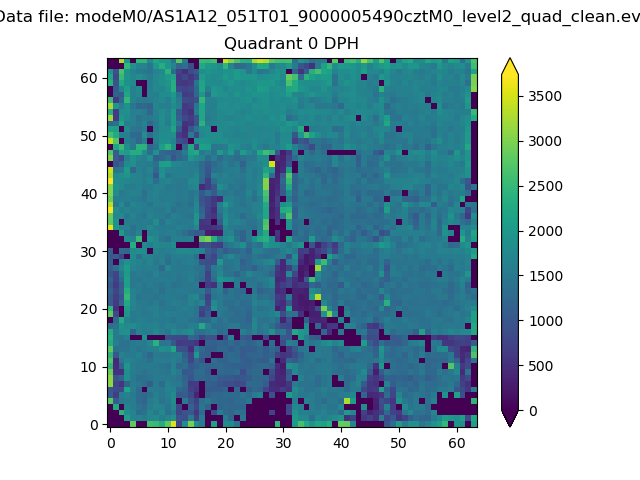 |
 |
Quadrant B |
|---|---|---|---|
| Quadrant D |  |
 |
Quadrant C |
| Plot type | Count rate plots | Images |
|---|---|---|
| Comparison with Poisson distribution Blue bars denote a histogram of data divided into 1 sec bins. Red curve is a Poisson curve with rate = median count rate of data. |
 |
 |
| Quadrant-wise count rates Data is divided into 100 sec bins |
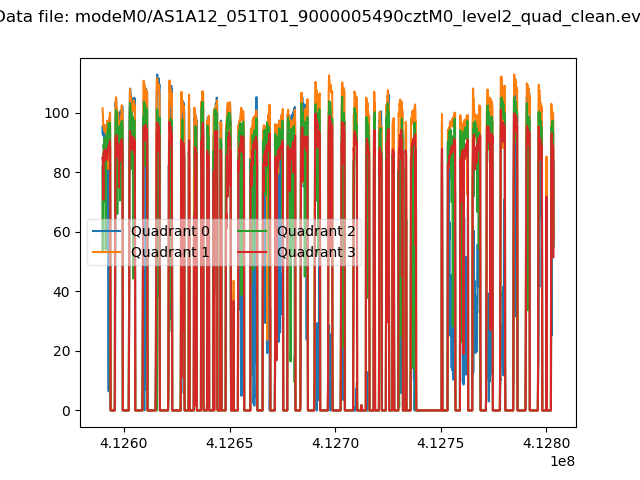 |
|
| Module-wise count rates for Quadrant A Data is divided into 100 sec bins |
 |
 |
| Module-wise count rates for Quadrant B Data is divided into 100 sec bins |
 |
 |
| Module-wise count rates for Quadrant C Data is divided into 100 sec bins |
 |
 |
| Module-wise count rates for Quadrant D Data is divided into 100 sec bins |
 |
 |
| Parameter | Plot |
|---|---|
| CZT HV Monitor |  |
| D_VDD | 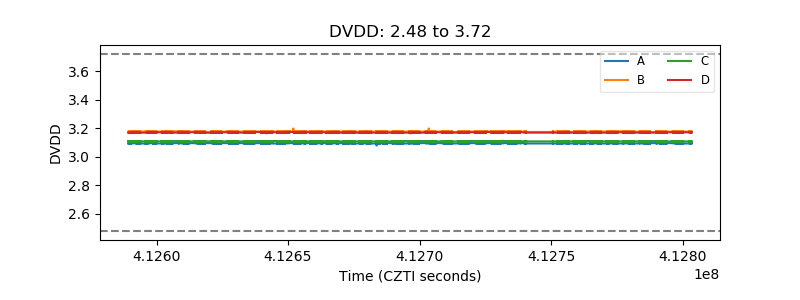 |
| Temperature 1 |  |
| Veto HV Monitor | 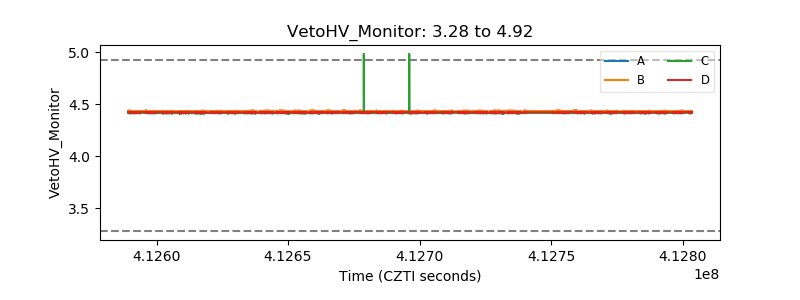 |
| Veto LLD |  |
| Alpha Counter |  |
| _CPM_Rate | 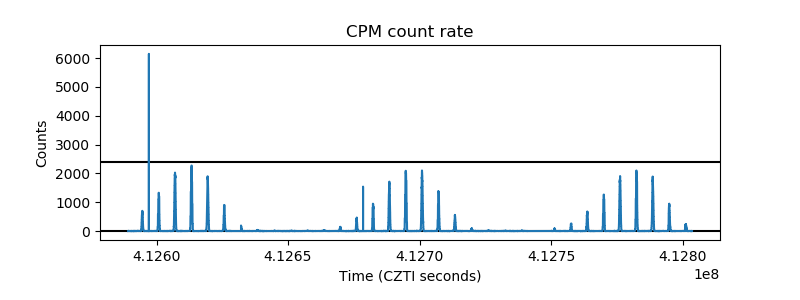 |
| CZT Counter |  |
| +2.5 Volts monitor |  |
| +5 Volts monitor |  |
| _ROLL_ROT |  |
| _Roll_DEC |  |
| _Roll_RA |  |
| Veto Counter |  |