| Param | Original file | Final file |
|---|---|---|
| Filename | modeM0/AS1C07_001T02_9000005486cztM0_level2.fits | modeM0/AS1C07_001T02_9000005486cztM0_level2_quad_clean.evt |
| Size (bytes) | 695,142,720 | 915,359,040 |
| Size | 662.9 MB | 873.0 MB |
| Events in quadrant A | 4,078,406 | 5,676,018 |
| Events in quadrant B | 3,989,934 | 5,935,312 |
| Events in quadrant C | 4,083,194 | 5,638,042 |
| Events in quadrant D | 3,461,668 | 5,040,252 |
| Mode M0 | |||
|---|---|---|---|
| Quadrant | BADHDUFLAG | Total packets | Discarded packets |
| A | 0 | 220738 | 0 |
| B | 0 | 179054 | 0 |
| C | 0 | 185313 | 0 |
| D | 0 | 220774 | 0 |
| Mode M9 | |||
|---|---|---|---|
| Quadrant | BADHDUFLAG | Total packets | Discarded packets |
| A | 0 | 301 | 0 |
| B | 0 | 301 | 0 |
| C | 0 | 301 | 0 |
| D | 0 | 301 | 0 |
| Mode SS | |||
|---|---|---|---|
| Quadrant | BADHDUFLAG | Total packets | Discarded packets |
| A | 0 | 1618 | 0 |
| B | 0 | 1618 | 0 |
| C | 0 | 1618 | 0 |
| D | 0 | 1618 | 0 |
| Quadrant | Total seconds | Saturated seconds | Saturation percentage |
|---|---|---|---|
| A | 79270 | 3308 | 4.173079% |
| B | 79282 | 1495 | 1.885674% |
| C | 79278 | 1033 | 1.303010% |
| D | 79281 | 4830 | 6.092254% |
Noise dominated data is calculated using 1-second bins in cleaned event files. If a bin has >2000 counts, and if more than 50% of those come from <1% of pixels, then it is considered to be noise-dominated and hence unusable.
| Quadrant | # 1 sec bins | Bins with >0 counts | Bins with >2000 counts | High rate bins dominated by noise | Noise dominated (total time) | Noise dominated (detector-on time) | Marked lightcurve |
|---|---|---|---|---|---|---|---|
| A | 113327 | 79275 | 0 | 0 | 0.00% | 0.00% |  |
| B | 113327 | 79285 | 0 | 0 | 0.00% | 0.00% |  |
| C | 113327 | 79289 | 0 | 0 | 0.00% | 0.00% |  |
| D | 113327 | 79218 | 0 | 0 | 0.00% | 0.00% |  |
Top three noisy pixels from each quadrant. If the there are fewer than three noisy pixels in the level2.evt file, extra rows are filled as -1
| Pixel properties | Quadrant properties | ||||||
|---|---|---|---|---|---|---|---|
| Quadrant | DetID | PixID | Counts | Sigma | Mean | Median | Sigma |
| A | 7 | 110 | 3308 | 8.63 | 1063 | 998 | 267.8 |
| A | 9 | 19 | 3286 | 8.54 | 1063 | 998 | 267.8 |
| A | 0 | 29 | 3270 | 8.48 | 1063 | 998 | 267.8 |
| B | 2 | 9 | 3428 | 11.75 | 1055 | 1007 | 206.0 |
| B | 3 | 80 | 3085 | 10.09 | 1055 | 1007 | 206.0 |
| B | 2 | 8 | 2813 | 8.77 | 1055 | 1007 | 206.0 |
| C | 1 | 81 | 3365 | 8.53 | 1080 | 1013 | 275.9 |
| C | 1 | 80 | 3192 | 7.9 | 1080 | 1013 | 275.9 |
| C | 1 | 65 | 2905 | 6.86 | 1080 | 1013 | 275.9 |
| D | 7 | 3 | 2644 | 6.59 | 990 | 902 | 264.3 |
| D | 10 | 189 | 2607 | 6.45 | 990 | 902 | 264.3 |
| D | 4 | 160 | 2590 | 6.38 | 990 | 902 | 264.3 |
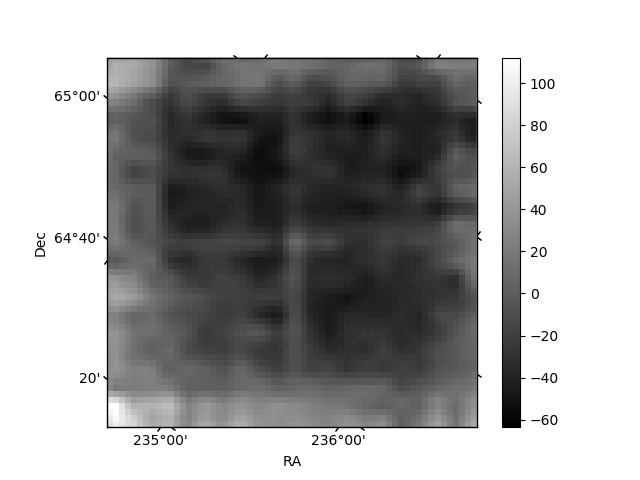
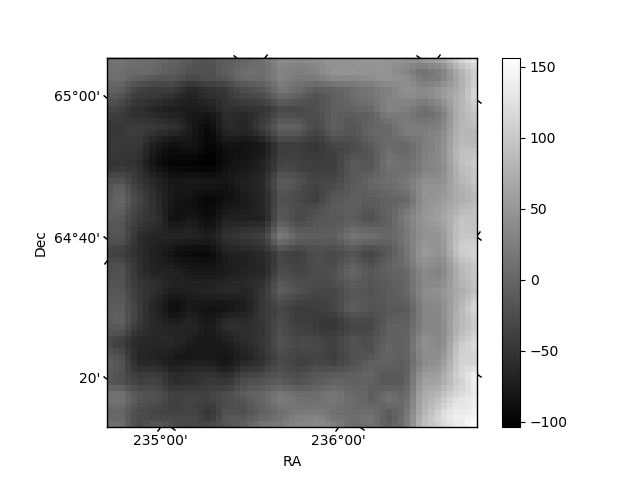
Histogram calculated using DETX and DETY for each event in the final _common_clean file
| Quadrant A |  |
 |
Quadrant B |
|---|---|---|---|
| Quadrant D |  |
 |
Quadrant C |
| Plot type | Count rate plots | Images |
|---|---|---|
| Comparison with Poisson distribution Blue bars denote a histogram of data divided into 1 sec bins. Red curve is a Poisson curve with rate = median count rate of data. |
 |
 |
| Quadrant-wise count rates Data is divided into 100 sec bins |
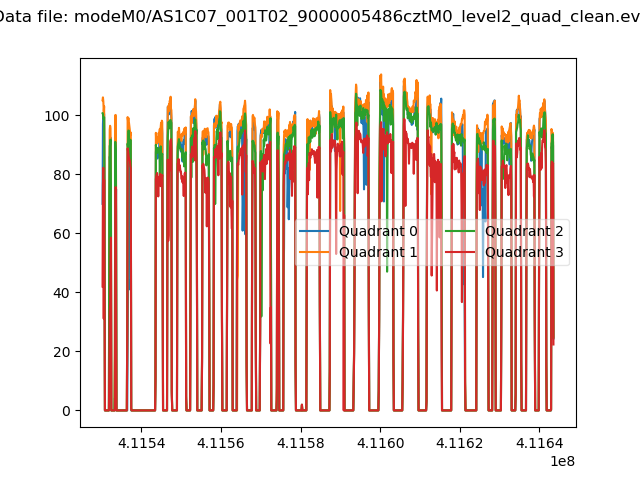 |
|
| Module-wise count rates for Quadrant A Data is divided into 100 sec bins |
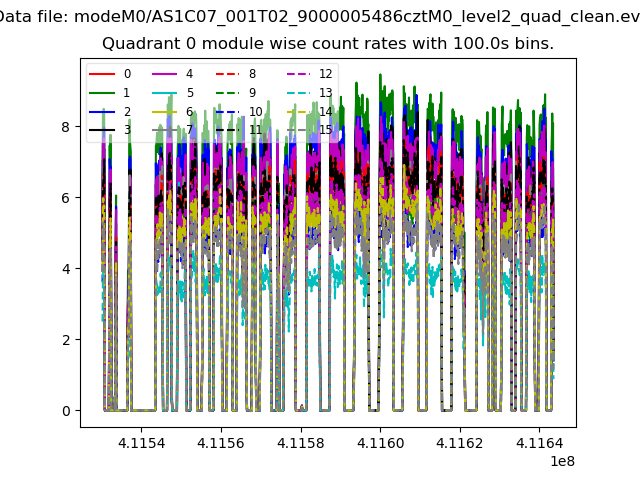 |
 |
| Module-wise count rates for Quadrant B Data is divided into 100 sec bins |
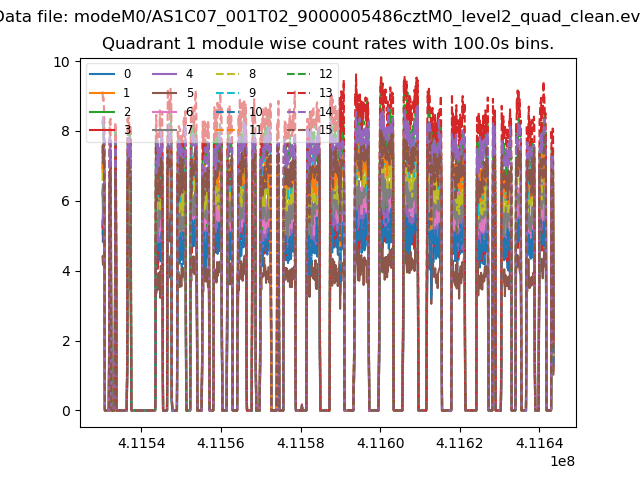 |
 |
| Module-wise count rates for Quadrant C Data is divided into 100 sec bins |
 |
 |
| Module-wise count rates for Quadrant D Data is divided into 100 sec bins |
 |
 |
| Parameter | Plot |
|---|---|
| CZT HV Monitor |  |
| D_VDD |  |
| Temperature 1 |  |
| Veto HV Monitor |  |
| Veto LLD |  |
| Alpha Counter |  |
| _CPM_Rate |  |
| CZT Counter |  |
| +2.5 Volts monitor |  |
| +5 Volts monitor | 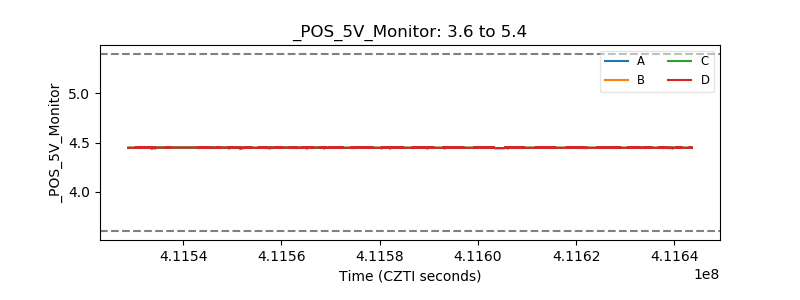 |
| _ROLL_ROT |  |
| _Roll_DEC |  |
| _Roll_RA |  |
| Veto Counter |  |