| Param | Original file | Final file |
|---|---|---|
| Filename | modeM0/AS1A12_044T16_9000005478cztM0_level2.fits | modeM0/AS1A12_044T16_9000005478cztM0_level2_quad_clean.evt |
| Size (bytes) | 381,340,800 | 316,843,200 |
| Size | 363.7 MB | 302.2 MB |
| Events in quadrant A | 2,233,486 | 1,675,288 |
| Events in quadrant B | 2,229,644 | 1,793,807 |
| Events in quadrant C | 2,229,382 | 1,663,263 |
| Events in quadrant D | 1,966,082 | 1,573,863 |
| Mode SS | |||
|---|---|---|---|
| Quadrant | BADHDUFLAG | Total packets | Discarded packets |
| A | 0 | 856 | 0 |
| B | 0 | 856 | 0 |
| C | 0 | 856 | 0 |
| D | 0 | 856 | 0 |
| Mode M0 | |||
|---|---|---|---|
| Quadrant | BADHDUFLAG | Total packets | Discarded packets |
| A | 0 | 146261 | 0 |
| B | 0 | 94274 | 0 |
| C | 0 | 117227 | 0 |
| D | 0 | 105172 | 0 |
| Mode M9 | |||
|---|---|---|---|
| Quadrant | BADHDUFLAG | Total packets | Discarded packets |
| A | 0 | 168 | 0 |
| B | 0 | 168 | 0 |
| C | 0 | 168 | 0 |
| D | 0 | 168 | 0 |
| Quadrant | Total seconds | Saturated seconds | Saturation percentage |
|---|---|---|---|
| A | 42069 | 3345 | 7.951223% |
| B | 42069 | 840 | 1.996720% |
| C | 42069 | 2048 | 4.868193% |
| D | 42069 | 1130 | 2.686063% |
Noise dominated data is calculated using 1-second bins in cleaned event files. If a bin has >2000 counts, and if more than 50% of those come from <1% of pixels, then it is considered to be noise-dominated and hence unusable.
| Quadrant | # 1 sec bins | Bins with >0 counts | Bins with >2000 counts | High rate bins dominated by noise | Noise dominated (total time) | Noise dominated (detector-on time) | Marked lightcurve |
|---|---|---|---|---|---|---|---|
| A | 58776 | 42069 | 0 | 0 | 0.00% | 0.00% |  |
| B | 58776 | 42049 | 0 | 0 | 0.00% | 0.00% |  |
| C | 58776 | 42038 | 0 | 0 | 0.00% | 0.00% |  |
| D | 58776 | 42064 | 0 | 0 | 0.00% | 0.00% |  |
Top three noisy pixels from each quadrant. If the there are fewer than three noisy pixels in the level2.evt file, extra rows are filled as -1
| Pixel properties | Quadrant properties | ||||||
|---|---|---|---|---|---|---|---|
| Quadrant | DetID | PixID | Counts | Sigma | Mean | Median | Sigma |
| A | 9 | 19 | 1885 | 8.98 | 582 | 544 | 149.4 |
| A | 0 | 29 | 1821 | 8.55 | 582 | 544 | 149.4 |
| A | 7 | 110 | 1814 | 8.5 | 582 | 544 | 149.4 |
| B | 2 | 9 | 1915 | 11.72 | 588 | 560 | 115.6 |
| B | 3 | 80 | 1667 | 9.57 | 588 | 560 | 115.6 |
| B | 5 | 128 | 1588 | 8.89 | 588 | 560 | 115.6 |
| C | 1 | 81 | 1853 | 8.49 | 589 | 551 | 153.4 |
| C | 1 | 80 | 1811 | 8.21 | 589 | 551 | 153.4 |
| C | 3 | 202 | 1744 | 7.78 | 589 | 551 | 153.4 |
| D | 7 | 3 | 1478 | 6.4 | 562 | 511 | 151.0 |
| D | 4 | 160 | 1425 | 6.05 | 562 | 511 | 151.0 |
| D | 6 | 38 | 1422 | 6.03 | 562 | 511 | 151.0 |
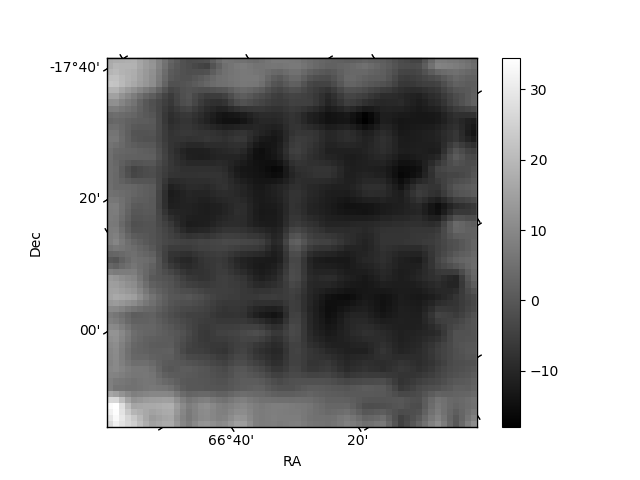
Histogram calculated using DETX and DETY for each event in the final _common_clean file
| Quadrant A |  |
 |
Quadrant B |
|---|---|---|---|
| Quadrant D |  |
 |
Quadrant C |
| Plot type | Count rate plots | Images |
|---|---|---|
| Comparison with Poisson distribution Blue bars denote a histogram of data divided into 1 sec bins. Red curve is a Poisson curve with rate = median count rate of data. |
 |
 |
| Quadrant-wise count rates Data is divided into 100 sec bins |
 |
|
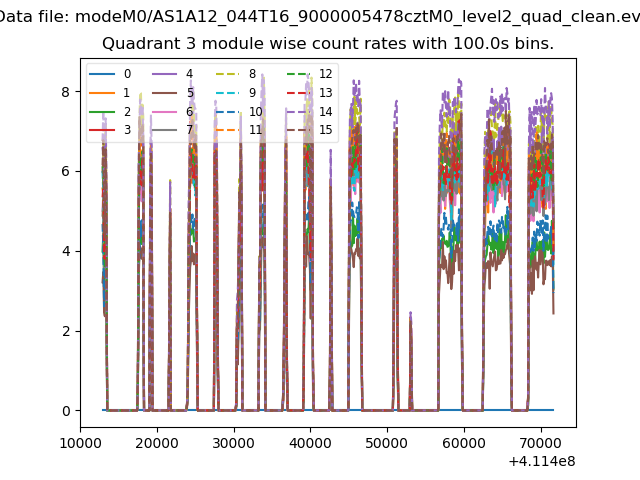
| Module-wise count rates for Quadrant A Data is divided into 100 sec bins |
 |
 |
| Module-wise count rates for Quadrant B Data is divided into 100 sec bins |
 |
 |
| Module-wise count rates for Quadrant C Data is divided into 100 sec bins |
 |
 |
| Module-wise count rates for Quadrant D Data is divided into 100 sec bins |
 |
 |
| Parameter | Plot |
|---|---|
| CZT HV Monitor |  |
| D_VDD | 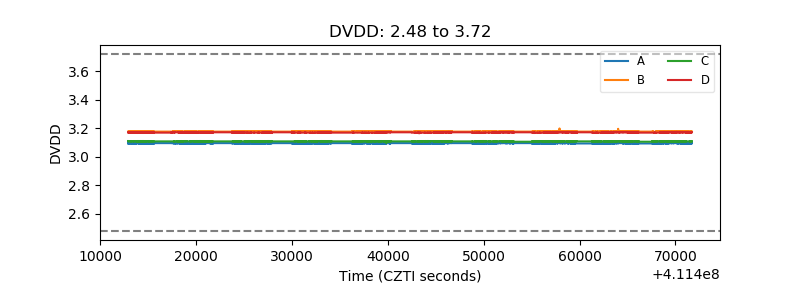 |
| Temperature 1 |  |
| Veto HV Monitor |  |
| Veto LLD | 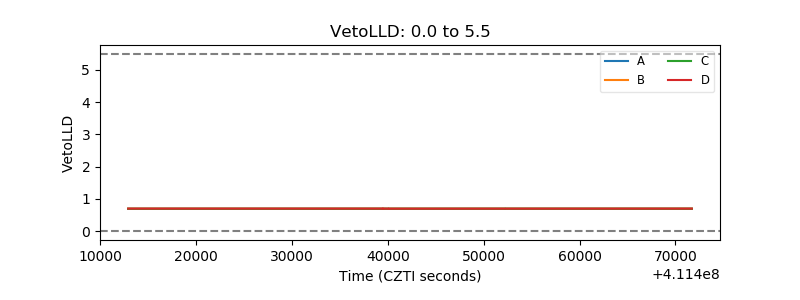 |
| Alpha Counter | 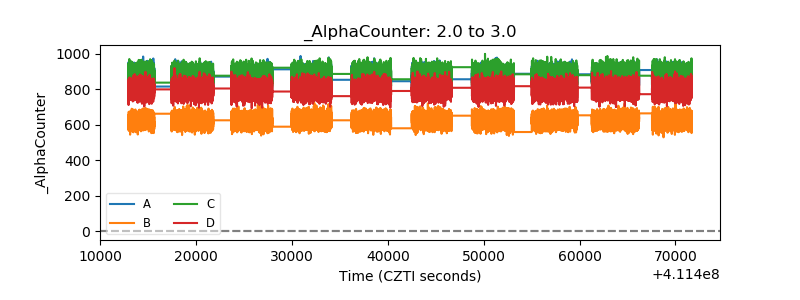 |
| _CPM_Rate | 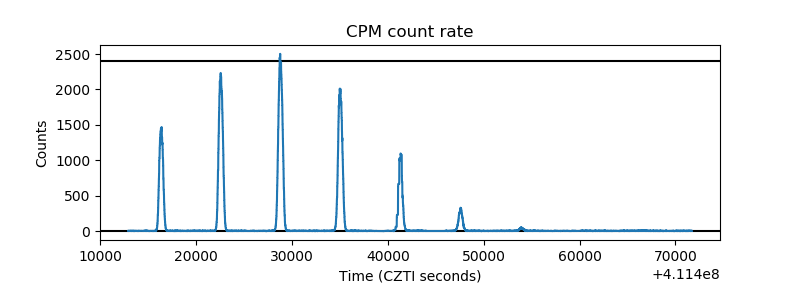 |
| CZT Counter |  |
| +2.5 Volts monitor |  |
| +5 Volts monitor |  |
| _ROLL_ROT |  |
| _Roll_DEC |  |
| _Roll_RA |  |
| Veto Counter |  |