| Param | Original file | Final file |
|---|---|---|
| Filename | modeM0/AS1A12_018T01_9000005470cztM0_level2.fits | modeM0/AS1A12_018T01_9000005470cztM0_level2_quad_clean.evt |
| Size (bytes) | 2,778,811,200 | 3,401,732,160 |
| Size | 2.6 GB | 3.2 GB |
| Events in quadrant A | 17,079,652 | 22,089,845 |
| Events in quadrant B | 16,292,062 | 22,190,840 |
| Events in quadrant C | 16,544,820 | 21,011,326 |
| Events in quadrant D | 12,554,480 | 16,089,630 |
| Mode M9 | |||
|---|---|---|---|
| Quadrant | BADHDUFLAG | Total packets | Discarded packets |
| A | 0 | 1187 | 0 |
| B | 0 | 1187 | 0 |
| C | 0 | 1187 | 0 |
| D | 0 | 1187 | 0 |
| Mode SS | |||
|---|---|---|---|
| Quadrant | BADHDUFLAG | Total packets | Discarded packets |
| A | 0 | 6446 | 0 |
| B | 0 | 6446 | 0 |
| C | 0 | 6446 | 0 |
| D | 0 | 6446 | 0 |
| Mode M0 | |||
|---|---|---|---|
| Quadrant | BADHDUFLAG | Total packets | Discarded packets |
| A | 0 | 683537 | 0 |
| B | 0 | 691751 | 0 |
| C | 0 | 701749 | 0 |
| D | 0 | 1509055 | 0 |
| Quadrant | Total seconds | Saturated seconds | Saturation percentage |
|---|---|---|---|
| A | 316140 | 1812 | 0.573164% |
| B | 316139 | 4450 | 1.407609% |
| C | 316138 | 2592 | 0.819895% |
| D | 316139 | 77969 | 24.662886% |
Noise dominated data is calculated using 1-second bins in cleaned event files. If a bin has >2000 counts, and if more than 50% of those come from <1% of pixels, then it is considered to be noise-dominated and hence unusable.
| Quadrant | # 1 sec bins | Bins with >0 counts | Bins with >2000 counts | High rate bins dominated by noise | Noise dominated (total time) | Noise dominated (detector-on time) | Marked lightcurve |
|---|---|---|---|---|---|---|---|
| A | 436336 | 316134 | 0 | 0 | 0.00% | 0.00% |  |
| B | 436336 | 316065 | 0 | 0 | 0.00% | 0.00% |  |
| C | 436336 | 316099 | 0 | 0 | 0.00% | 0.00% |  |
| D | 436336 | 315640 | 0 | 0 | 0.00% | 0.00% |  |
Top three noisy pixels from each quadrant. If the there are fewer than three noisy pixels in the level2.evt file, extra rows are filled as -1
| Pixel properties | Quadrant properties | ||||||
|---|---|---|---|---|---|---|---|
| Quadrant | DetID | PixID | Counts | Sigma | Mean | Median | Sigma |
| A | 7 | 110 | 13849 | 8.62 | 4455 | 4181 | 1121.6 |
| A | 9 | 19 | 13781 | 8.56 | 4455 | 4181 | 1121.6 |
| A | 0 | 29 | 13740 | 8.52 | 4455 | 4181 | 1121.6 |
| B | 2 | 9 | 14042 | 11.95 | 4315 | 4118 | 830.1 |
| B | 3 | 80 | 12858 | 10.53 | 4315 | 4118 | 830.1 |
| B | 5 | 128 | 11514 | 8.91 | 4315 | 4118 | 830.1 |
| C | 1 | 81 | 13727 | 8.76 | 4377 | 4107 | 1098.2 |
| C | 1 | 80 | 13176 | 8.26 | 4377 | 4107 | 1098.2 |
| C | 3 | 202 | 13128 | 8.21 | 4377 | 4107 | 1098.2 |
| D | 4 | 160 | 9350 | 6.38 | 3586 | 3262 | 954.1 |
| D | 7 | 3 | 9341 | 6.37 | 3586 | 3262 | 954.1 |
| D | 10 | 189 | 9233 | 6.26 | 3586 | 3262 | 954.1 |
Histogram calculated using DETX and DETY for each event in the final _common_clean file
| Quadrant A | 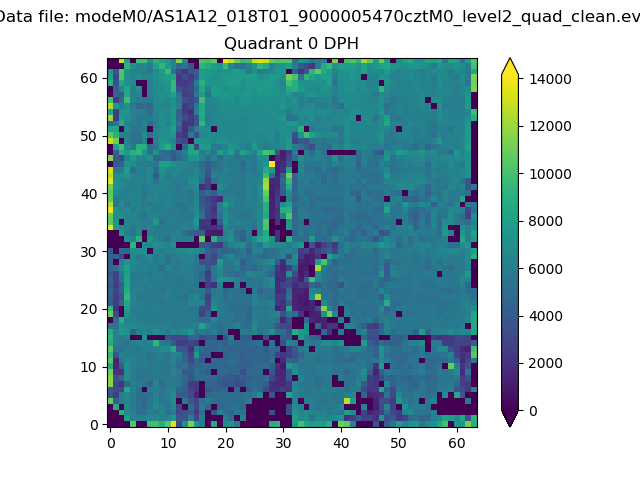 |
 |
Quadrant B |
|---|---|---|---|
| Quadrant D |  |
 |
Quadrant C |
| Plot type | Count rate plots | Images |
|---|---|---|
| Comparison with Poisson distribution Blue bars denote a histogram of data divided into 1 sec bins. Red curve is a Poisson curve with rate = median count rate of data. |
 |
 |
| Quadrant-wise count rates Data is divided into 100 sec bins |
 |
|
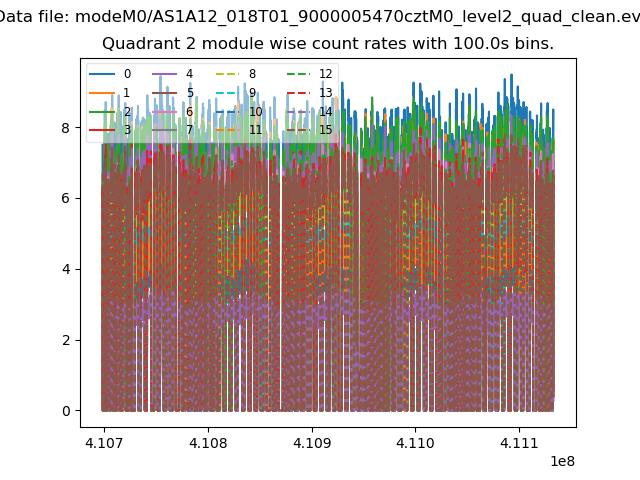
| Module-wise count rates for Quadrant A Data is divided into 100 sec bins |
 |
 |
| Module-wise count rates for Quadrant B Data is divided into 100 sec bins |
 |
 |
| Module-wise count rates for Quadrant C Data is divided into 100 sec bins |
 |
 |
| Module-wise count rates for Quadrant D Data is divided into 100 sec bins |
 |
 |
| Parameter | Plot |
|---|---|
| CZT HV Monitor |  |
| D_VDD | 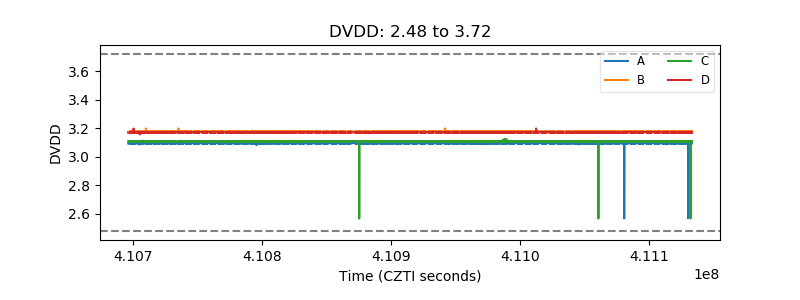 |
| Temperature 1 |  |
| Veto HV Monitor |  |
| Veto LLD |  |
| Alpha Counter |  |
| _CPM_Rate | 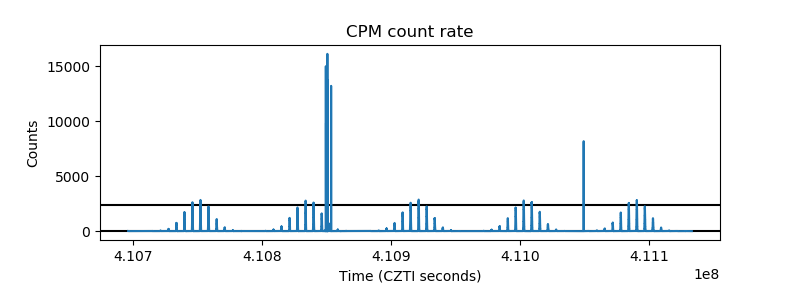 |
| CZT Counter |  |
| +2.5 Volts monitor | 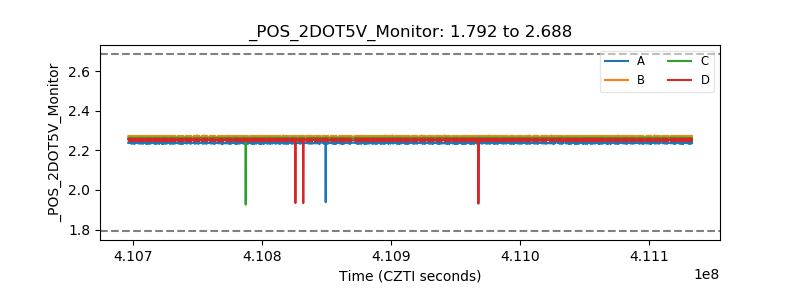 |
| +5 Volts monitor |  |
| _ROLL_ROT | 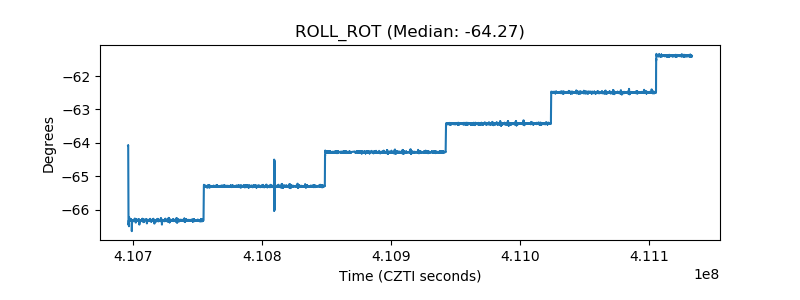 |
| _Roll_DEC | 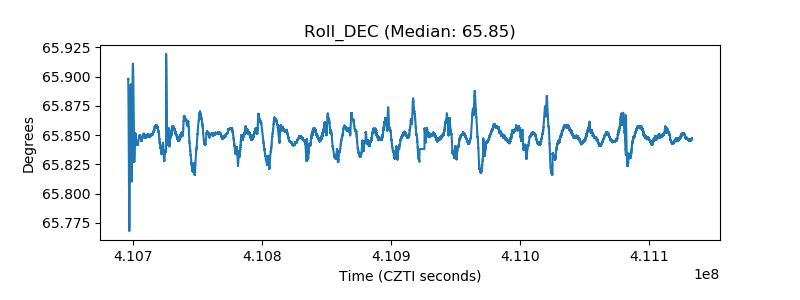 |
| _Roll_RA |  |
| Veto Counter |  |