| Param | Original file | Final file |
|---|---|---|
| Filename | modeM0/AS1A12_102T01_9000005466cztM0_level2.fits | modeM0/AS1A12_102T01_9000005466cztM0_level2_quad_clean.evt |
| Size (bytes) | 272,940,480 | 313,908,480 |
| Size | 260.3 MB | 299.4 MB |
| Events in quadrant A | 1,766,674 | 2,232,385 |
| Events in quadrant B | 1,695,174 | 2,233,974 |
| Events in quadrant C | 1,732,650 | 2,150,608 |
| Events in quadrant D | 748,000 | 578,168 |
| Mode M9 | |||
|---|---|---|---|
| Quadrant | BADHDUFLAG | Total packets | Discarded packets |
| A | 0 | 106 | 0 |
| B | 0 | 106 | 0 |
| C | 0 | 106 | 0 |
| D | 0 | 106 | 0 |
| Mode M0 | |||
|---|---|---|---|
| Quadrant | BADHDUFLAG | Total packets | Discarded packets |
| A | 0 | 71721 | 0 |
| B | 0 | 70322 | 0 |
| C | 0 | 70038 | 0 |
| D | 0 | 248914 | 0 |
| Mode SS | |||
|---|---|---|---|
| Quadrant | BADHDUFLAG | Total packets | Discarded packets |
| A | 0 | 688 | 0 |
| B | 0 | 688 | 0 |
| C | 0 | 688 | 0 |
| D | 0 | 688 | 0 |
| Quadrant | Total seconds | Saturated seconds | Saturation percentage |
|---|---|---|---|
| A | 33638 | 133 | 0.395386% |
| B | 33638 | 232 | 0.689696% |
| C | 33638 | 76 | 0.225935% |
| D | 33638 | 26135 | 77.694869% |
Noise dominated data is calculated using 1-second bins in cleaned event files. If a bin has >2000 counts, and if more than 50% of those come from <1% of pixels, then it is considered to be noise-dominated and hence unusable.
| Quadrant | # 1 sec bins | Bins with >0 counts | Bins with >2000 counts | High rate bins dominated by noise | Noise dominated (total time) | Noise dominated (detector-on time) | Marked lightcurve |
|---|---|---|---|---|---|---|---|
| A | 43905 | 33637 | 0 | 0 | 0.00% | 0.00% |  |
| B | 43905 | 33637 | 0 | 0 | 0.00% | 0.00% |  |
| C | 43905 | 33638 | 0 | 0 | 0.00% | 0.00% |  |
| D | 43904 | 33023 | 0 | 0 | 0.00% | 0.00% |  |
Top three noisy pixels from each quadrant. If the there are fewer than three noisy pixels in the level2.evt file, extra rows are filled as -1
| Pixel properties | Quadrant properties | ||||||
|---|---|---|---|---|---|---|---|
| Quadrant | DetID | PixID | Counts | Sigma | Mean | Median | Sigma |
| A | 0 | 29 | 1490 | 8.87 | 460 | 431 | 119.4 |
| A | 9 | 19 | 1469 | 8.69 | 460 | 431 | 119.4 |
| A | 7 | 110 | 1467 | 8.68 | 460 | 431 | 119.4 |
| B | 2 | 9 | 1516 | 12.18 | 447 | 426 | 89.5 |
| B | 3 | 80 | 1307 | 9.84 | 447 | 426 | 89.5 |
| B | 2 | 8 | 1222 | 8.89 | 447 | 426 | 89.5 |
| C | 1 | 81 | 1435 | 8.43 | 458 | 429 | 119.4 |
| C | 3 | 202 | 1383 | 7.99 | 458 | 429 | 119.4 |
| C | 3 | 203 | 1379 | 7.96 | 458 | 429 | 119.4 |
| D | 10 | 189 | 564 | 6.26 | 213 | 193 | 59.3 |
| D | 7 | 3 | 552 | 6.06 | 213 | 193 | 59.3 |
| D | 3 | 14 | 548 | 5.99 | 213 | 193 | 59.3 |
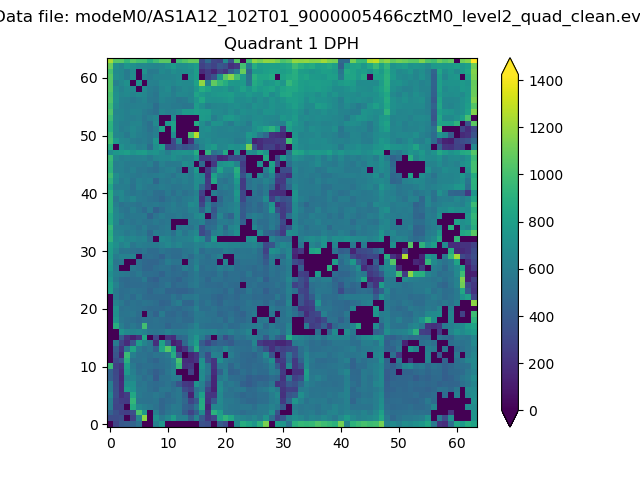
Histogram calculated using DETX and DETY for each event in the final _common_clean file
| Quadrant A |  |
 |
Quadrant B |
|---|---|---|---|
| Quadrant D | 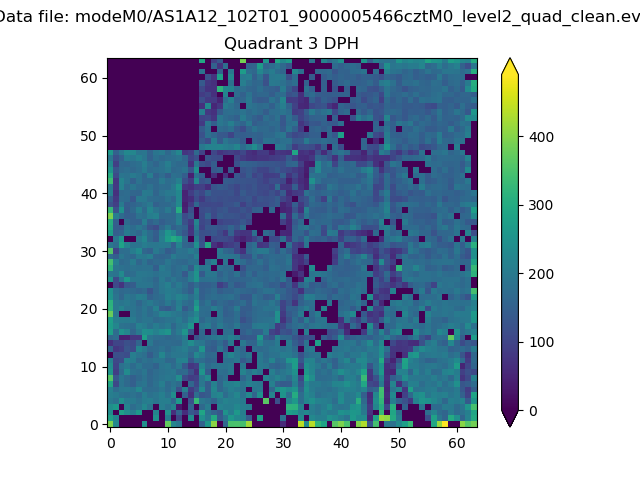 |
 |
Quadrant C |
| Plot type | Count rate plots | Images |
|---|---|---|
| Comparison with Poisson distribution Blue bars denote a histogram of data divided into 1 sec bins. Red curve is a Poisson curve with rate = median count rate of data. |
 |
 |
| Quadrant-wise count rates Data is divided into 100 sec bins |
 |
|
| Module-wise count rates for Quadrant A Data is divided into 100 sec bins |
 |
 |
| Module-wise count rates for Quadrant B Data is divided into 100 sec bins |
 |
 |
| Module-wise count rates for Quadrant C Data is divided into 100 sec bins |
 |
 |
| Module-wise count rates for Quadrant D Data is divided into 100 sec bins |
 |
 |
| Parameter | Plot |
|---|---|
| CZT HV Monitor |  |
| D_VDD | 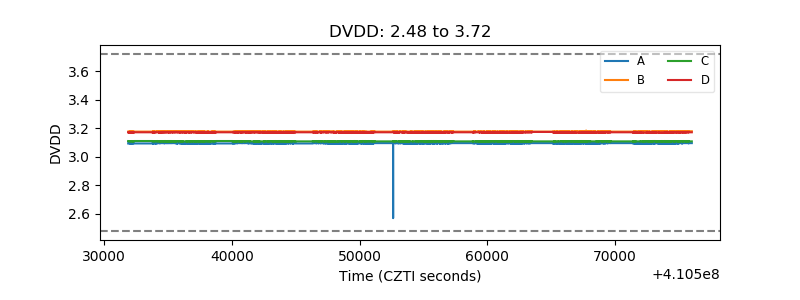 |
| Temperature 1 |  |
| Veto HV Monitor | 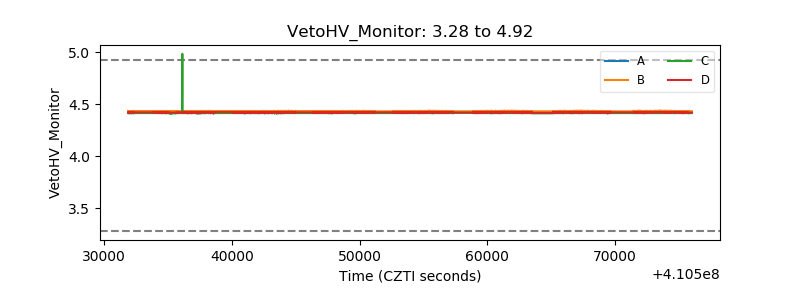 |
| Veto LLD | 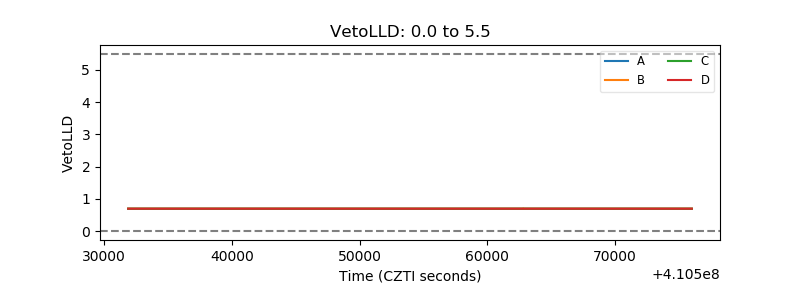 |
| Alpha Counter |  |
| _CPM_Rate |  |
| CZT Counter |  |
| +2.5 Volts monitor | 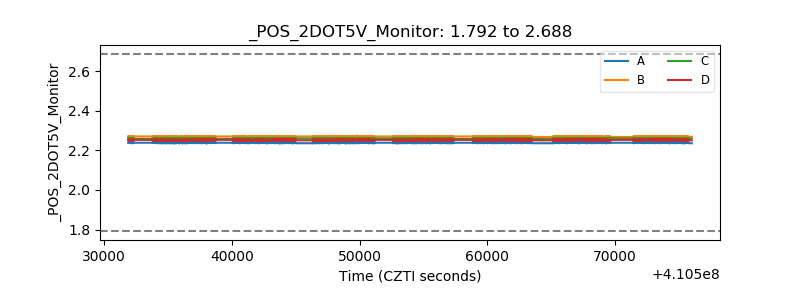 |
| +5 Volts monitor | 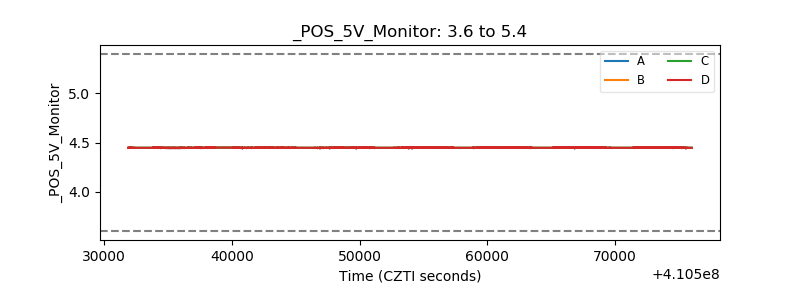 |
| _ROLL_ROT | 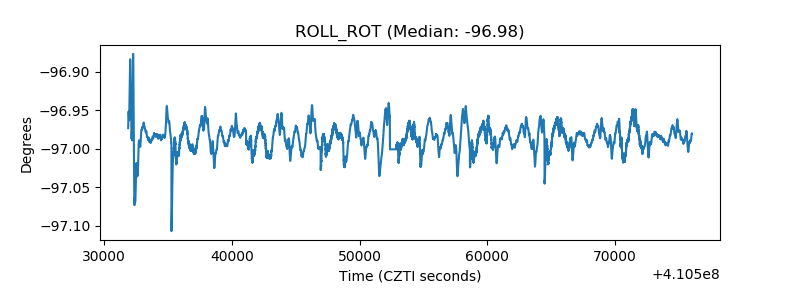 |
| _Roll_DEC |  |
| _Roll_RA |  |
| Veto Counter |  |