| Param | Original file | Final file |
|---|---|---|
| Filename | modeM0/AS1A12_037T03_9000005460cztM0_level2.fits | modeM0/AS1A12_037T03_9000005460cztM0_level2_quad_clean.evt |
| Size (bytes) | 98,640,000 | 80,493,120 |
| Size | 94.1 MB | 76.8 MB |
| Events in quadrant A | 644,390 | 511,014 |
| Events in quadrant B | 613,802 | 509,167 |
| Events in quadrant C | 640,634 | 493,380 |
| Events in quadrant D | 253,036 | 92,339 |
| Mode M0 | |||
|---|---|---|---|
| Quadrant | BADHDUFLAG | Total packets | Discarded packets |
| A | 0 | 28735 | 0 |
| B | 0 | 26963 | 0 |
| C | 0 | 24422 | 0 |
| D | 0 | 95317 | 0 |
| Mode SS | |||
|---|---|---|---|
| Quadrant | BADHDUFLAG | Total packets | Discarded packets |
| A | 0 | 248 | 0 |
| B | 0 | 248 | 0 |
| C | 0 | 248 | 0 |
| D | 0 | 248 | 0 |
| Mode M9 | |||
|---|---|---|---|
| Quadrant | BADHDUFLAG | Total packets | Discarded packets |
| A | 0 | 48 | 0 |
| B | 0 | 48 | 0 |
| C | 0 | 48 | 0 |
| D | 0 | 48 | 0 |
| Quadrant | Total seconds | Saturated seconds | Saturation percentage |
|---|---|---|---|
| A | 12001 | 80 | 0.666611% |
| B | 12001 | 265 | 2.208149% |
| C | 12001 | 7 | 0.058328% |
| D | 12001 | 10471 | 87.251062% |
Noise dominated data is calculated using 1-second bins in cleaned event files. If a bin has >2000 counts, and if more than 50% of those come from <1% of pixels, then it is considered to be noise-dominated and hence unusable.
| Quadrant | # 1 sec bins | Bins with >0 counts | Bins with >2000 counts | High rate bins dominated by noise | Noise dominated (total time) | Noise dominated (detector-on time) | Marked lightcurve |
|---|---|---|---|---|---|---|---|
| A | 14956 | 12000 | 0 | 0 | 0.00% | 0.00% |  |
| B | 14956 | 11997 | 0 | 0 | 0.00% | 0.00% |  |
| C | 14956 | 12000 | 0 | 0 | 0.00% | 0.00% |  |
| D | 14955 | 11853 | 0 | 0 | 0.00% | 0.00% | 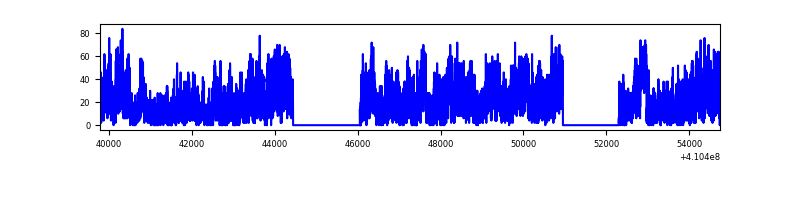 |
Top three noisy pixels from each quadrant. If the there are fewer than three noisy pixels in the level2.evt file, extra rows are filled as -1
| Pixel properties | Quadrant properties | ||||||
|---|---|---|---|---|---|---|---|
| Quadrant | DetID | PixID | Counts | Sigma | Mean | Median | Sigma |
| A | 0 | 29 | 525 | 8.07 | 168 | 157 | 45.6 |
| A | 15 | 236 | 492 | 7.35 | 168 | 157 | 45.6 |
| A | 0 | 30 | 489 | 7.28 | 168 | 157 | 45.6 |
| B | 2 | 9 | 517 | 10.6 | 162 | 154 | 34.3 |
| B | 3 | 17 | 435 | 8.2 | 162 | 154 | 34.3 |
| B | 14 | 254 | 416 | 7.65 | 162 | 154 | 34.3 |
| C | 1 | 81 | 494 | 7.4 | 169 | 157 | 45.5 |
| C | 1 | 80 | 492 | 7.36 | 169 | 157 | 45.5 |
| C | 7 | 221 | 452 | 6.48 | 169 | 157 | 45.5 |
| D | 6 | 67 | 206 | 6.55 | 72 | 65 | 21.5 |
| D | 3 | 14 | 193 | 5.95 | 72 | 65 | 21.5 |
| D | 10 | 113 | 184 | 5.53 | 72 | 65 | 21.5 |
Histogram calculated using DETX and DETY for each event in the final _common_clean file
| Quadrant A | 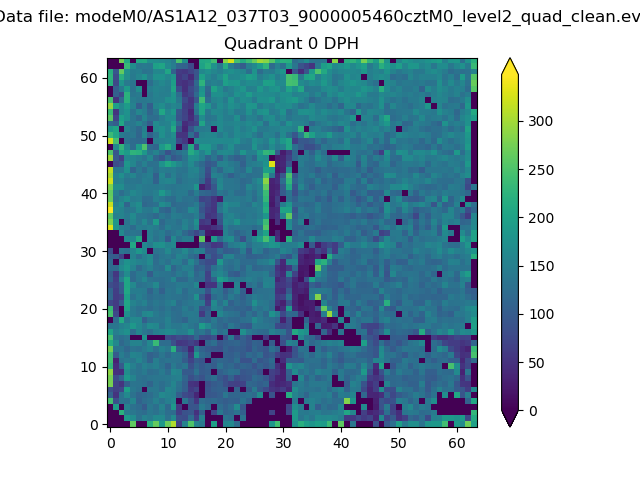 |
 |
Quadrant B |
|---|---|---|---|
| Quadrant D |  |
 |
Quadrant C |
| Plot type | Count rate plots | Images |
|---|---|---|
| Comparison with Poisson distribution Blue bars denote a histogram of data divided into 1 sec bins. Red curve is a Poisson curve with rate = median count rate of data. |
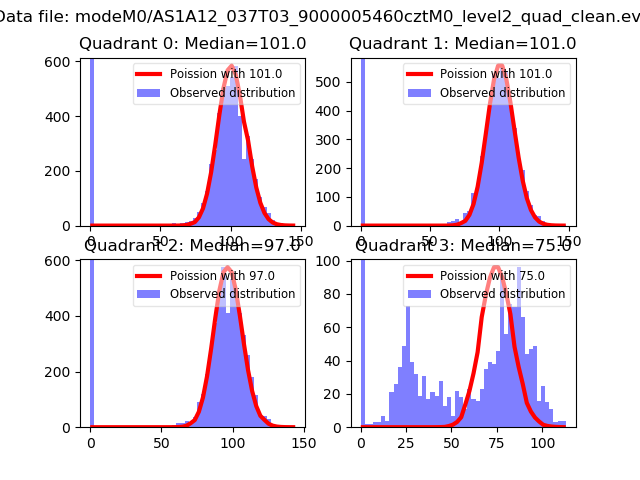 |
 |
| Quadrant-wise count rates Data is divided into 100 sec bins |
 |
|
| Module-wise count rates for Quadrant A Data is divided into 100 sec bins |
 |
 |
| Module-wise count rates for Quadrant B Data is divided into 100 sec bins |
 |
 |
| Module-wise count rates for Quadrant C Data is divided into 100 sec bins |
 |
 |
| Module-wise count rates for Quadrant D Data is divided into 100 sec bins |
 |
 |
| Parameter | Plot |
|---|---|
| CZT HV Monitor | 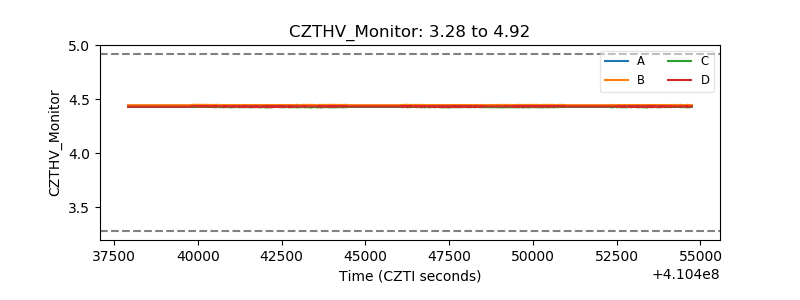 |
| D_VDD |  |
| Temperature 1 | 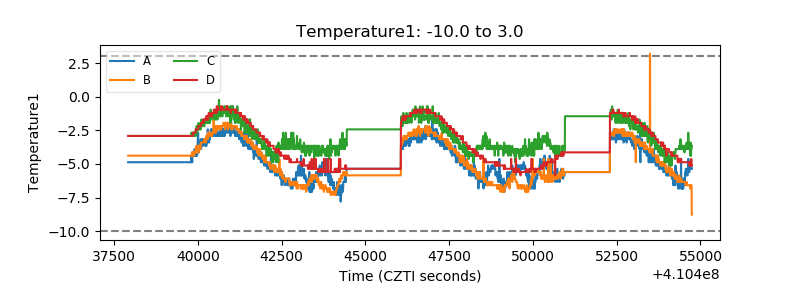 |
| Veto HV Monitor |  |
| Veto LLD |  |
| Alpha Counter |  |
| _CPM_Rate |  |
| CZT Counter |  |
| +2.5 Volts monitor |  |
| +5 Volts monitor |  |
| _ROLL_ROT |  |
| _Roll_DEC | 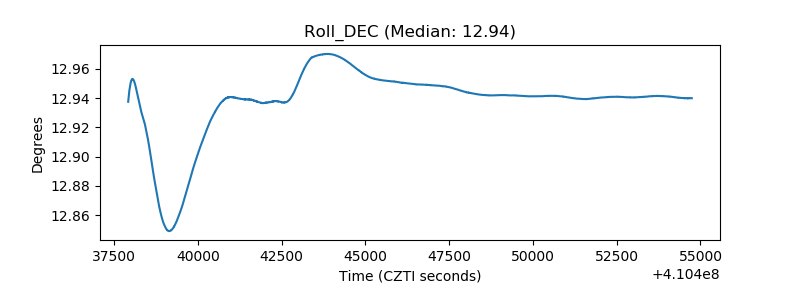 |
| _Roll_RA |  |
| Veto Counter |  |