| Param | Original file | Final file |
|---|---|---|
| Filename | modeM0/AS1A12_037T01_9000005456cztM0_level2.fits | modeM0/AS1A12_037T01_9000005456cztM0_level2_quad_clean.evt |
| Size (bytes) | 563,843,520 | 514,465,920 |
| Size | 537.7 MB | 490.6 MB |
| Events in quadrant A | 3,397,774 | 2,918,818 |
| Events in quadrant B | 3,390,212 | 3,164,650 |
| Events in quadrant C | 3,503,158 | 3,044,067 |
| Events in quadrant D | 2,411,318 | 2,091,918 |
| Mode M0 | |||
|---|---|---|---|
| Quadrant | BADHDUFLAG | Total packets | Discarded packets |
| A | 0 | 192050 | 0 |
| B | 0 | 138928 | 0 |
| C | 0 | 129821 | 0 |
| D | 0 | 369333 | 0 |
| Mode SS | |||
|---|---|---|---|
| Quadrant | BADHDUFLAG | Total packets | Discarded packets |
| A | 0 | 1294 | 0 |
| B | 0 | 1294 | 0 |
| C | 0 | 1294 | 0 |
| D | 0 | 1294 | 0 |
| Mode M9 | |||
|---|---|---|---|
| Quadrant | BADHDUFLAG | Total packets | Discarded packets |
| A | 0 | 242 | 0 |
| B | 0 | 242 | 0 |
| C | 0 | 242 | 0 |
| D | 0 | 242 | 0 |
| Quadrant | Total seconds | Saturated seconds | Saturation percentage |
|---|---|---|---|
| A | 63572 | 5554 | 8.736551% |
| B | 63572 | 741 | 1.165608% |
| C | 63572 | 76 | 0.119549% |
| D | 63572 | 25765 | 40.528849% |
Noise dominated data is calculated using 1-second bins in cleaned event files. If a bin has >2000 counts, and if more than 50% of those come from <1% of pixels, then it is considered to be noise-dominated and hence unusable.
| Quadrant | # 1 sec bins | Bins with >0 counts | Bins with >2000 counts | High rate bins dominated by noise | Noise dominated (total time) | Noise dominated (detector-on time) | Marked lightcurve |
|---|---|---|---|---|---|---|---|
| A | 87492 | 63558 | 0 | 0 | 0.00% | 0.00% |  |
| B | 87492 | 63568 | 0 | 0 | 0.00% | 0.00% | 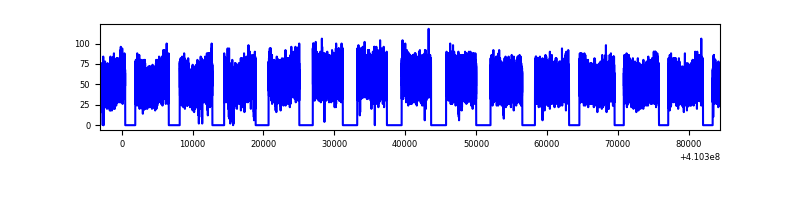 |
| C | 87492 | 63573 | 0 | 0 | 0.00% | 0.00% |  |
| D | 87492 | 63453 | 0 | 0 | 0.00% | 0.00% | 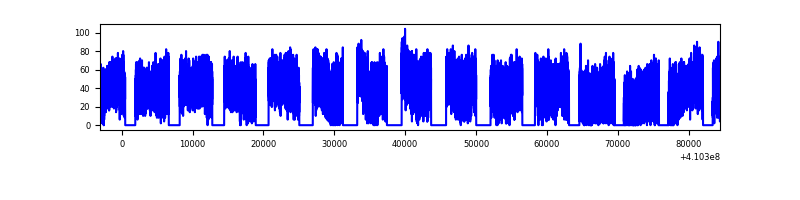 |
Top three noisy pixels from each quadrant. If the there are fewer than three noisy pixels in the level2.evt file, extra rows are filled as -1
| Pixel properties | Quadrant properties | ||||||
|---|---|---|---|---|---|---|---|
| Quadrant | DetID | PixID | Counts | Sigma | Mean | Median | Sigma |
| A | 0 | 29 | 2800 | 8.76 | 886 | 825 | 225.5 |
| A | 7 | 110 | 2763 | 8.59 | 886 | 825 | 225.5 |
| A | 9 | 19 | 2709 | 8.35 | 886 | 825 | 225.5 |
| B | 2 | 9 | 2939 | 11.88 | 894 | 851 | 175.8 |
| B | 3 | 80 | 2568 | 9.77 | 894 | 851 | 175.8 |
| B | 2 | 8 | 2364 | 8.61 | 894 | 851 | 175.8 |
| C | 1 | 81 | 2972 | 8.85 | 925 | 863 | 238.2 |
| C | 1 | 80 | 2830 | 8.26 | 925 | 863 | 238.2 |
| C | 3 | 202 | 2730 | 7.84 | 925 | 863 | 238.2 |
| D | 4 | 160 | 1838 | 6.62 | 689 | 630 | 182.3 |
| D | 1 | 3 | 1797 | 6.4 | 689 | 630 | 182.3 |
| D | 7 | 3 | 1755 | 6.17 | 689 | 630 | 182.3 |
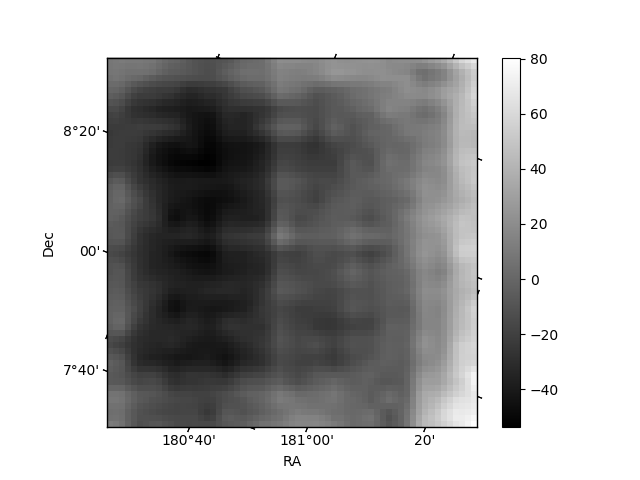
Histogram calculated using DETX and DETY for each event in the final _common_clean file
| Quadrant A | 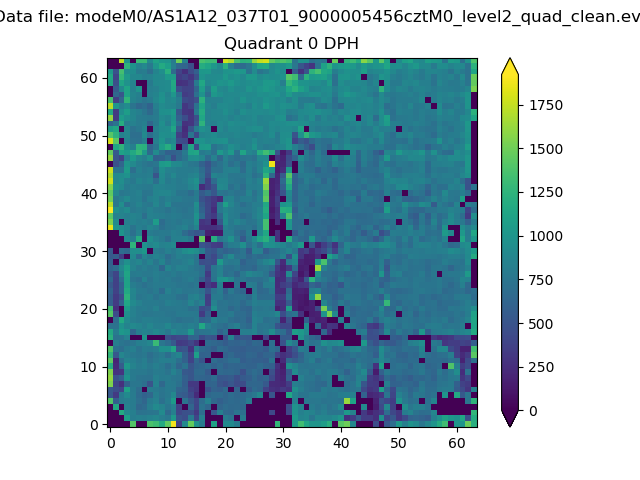 |
 |
Quadrant B |
|---|---|---|---|
| Quadrant D |  |
 |
Quadrant C |
| Plot type | Count rate plots | Images |
|---|---|---|
| Comparison with Poisson distribution Blue bars denote a histogram of data divided into 1 sec bins. Red curve is a Poisson curve with rate = median count rate of data. |
 |
 |
| Quadrant-wise count rates Data is divided into 100 sec bins |
 |
|
| Module-wise count rates for Quadrant A Data is divided into 100 sec bins |
 |
 |
| Module-wise count rates for Quadrant B Data is divided into 100 sec bins |
 |
 |
| Module-wise count rates for Quadrant C Data is divided into 100 sec bins |
 |
 |
| Module-wise count rates for Quadrant D Data is divided into 100 sec bins |
 |
 |
| Parameter | Plot |
|---|---|
| CZT HV Monitor |  |
| D_VDD | 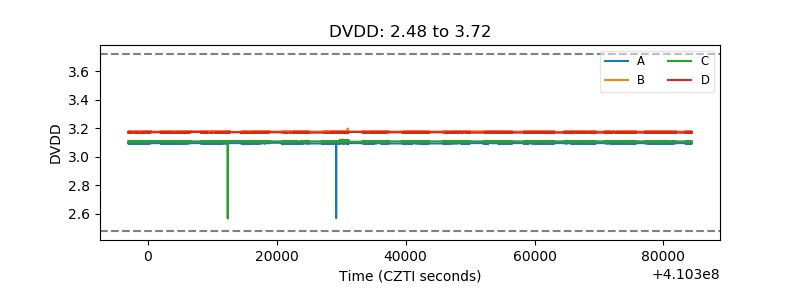 |
| Temperature 1 |  |
| Veto HV Monitor |  |
| Veto LLD |  |
| Alpha Counter |  |
| _CPM_Rate |  |
| CZT Counter | 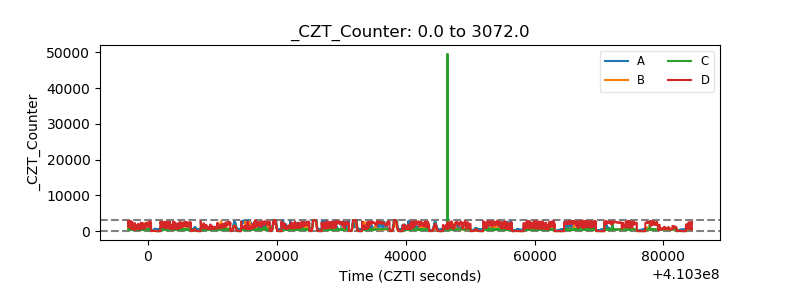 |
| +2.5 Volts monitor |  |
| +5 Volts monitor |  |
| _ROLL_ROT |  |
| _Roll_DEC |  |
| _Roll_RA |  |
| Veto Counter |  |