| Param | Original file | Final file |
|---|---|---|
| Filename | modeM0/AS1A12_025T11_9000005454cztM0_level2.fits | modeM0/AS1A12_025T11_9000005454cztM0_level2_quad_clean.evt |
| Size (bytes) | 142,312,320 | 164,877,120 |
| Size | 135.7 MB | 157.2 MB |
| Events in quadrant A | 897,004 | 1,097,490 |
| Events in quadrant B | 832,684 | 1,077,000 |
| Events in quadrant C | 873,164 | 1,048,556 |
| Events in quadrant D | 554,270 | 621,019 |
| Mode M0 | |||
|---|---|---|---|
| Quadrant | BADHDUFLAG | Total packets | Discarded packets |
| A | 0 | 35182 | 0 |
| B | 0 | 41362 | 0 |
| C | 0 | 35581 | 0 |
| D | 0 | 108836 | 0 |
| Mode SS | |||
|---|---|---|---|
| Quadrant | BADHDUFLAG | Total packets | Discarded packets |
| A | 0 | 338 | 0 |
| B | 0 | 338 | 0 |
| C | 0 | 338 | 0 |
| D | 0 | 338 | 0 |
| Mode M9 | |||
|---|---|---|---|
| Quadrant | BADHDUFLAG | Total packets | Discarded packets |
| A | 0 | 57 | 0 |
| B | 0 | 57 | 0 |
| C | 0 | 57 | 0 |
| D | 0 | 57 | 0 |
| Quadrant | Total seconds | Saturated seconds | Saturation percentage |
|---|---|---|---|
| A | 16664 | 29 | 0.174028% |
| B | 16664 | 644 | 3.864618% |
| C | 16664 | 49 | 0.294047% |
| D | 16664 | 8609 | 51.662266% |
Noise dominated data is calculated using 1-second bins in cleaned event files. If a bin has >2000 counts, and if more than 50% of those come from <1% of pixels, then it is considered to be noise-dominated and hence unusable.
| Quadrant | # 1 sec bins | Bins with >0 counts | Bins with >2000 counts | High rate bins dominated by noise | Noise dominated (total time) | Noise dominated (detector-on time) | Marked lightcurve |
|---|---|---|---|---|---|---|---|
| A | 22271 | 16664 | 0 | 0 | 0.00% | 0.00% |  |
| B | 22271 | 16642 | 0 | 0 | 0.00% | 0.00% |  |
| C | 22271 | 16664 | 0 | 0 | 0.00% | 0.00% |  |
| D | 22271 | 16622 | 0 | 0 | 0.00% | 0.00% |  |
Top three noisy pixels from each quadrant. If the there are fewer than three noisy pixels in the level2.evt file, extra rows are filled as -1
| Pixel properties | Quadrant properties | ||||||
|---|---|---|---|---|---|---|---|
| Quadrant | DetID | PixID | Counts | Sigma | Mean | Median | Sigma |
| A | 7 | 110 | 753 | 8.73 | 233 | 218 | 61.3 |
| A | 9 | 19 | 729 | 8.34 | 233 | 218 | 61.3 |
| A | 0 | 29 | 712 | 8.06 | 233 | 218 | 61.3 |
| B | 2 | 9 | 776 | 12.41 | 220 | 209 | 45.7 |
| B | 3 | 80 | 679 | 10.29 | 220 | 209 | 45.7 |
| B | 2 | 8 | 603 | 8.63 | 220 | 209 | 45.7 |
| C | 1 | 81 | 764 | 8.93 | 230 | 214 | 61.6 |
| C | 3 | 203 | 716 | 8.15 | 230 | 214 | 61.6 |
| C | 1 | 80 | 712 | 8.08 | 230 | 214 | 61.6 |
| D | 10 | 113 | 428 | 6.51 | 157 | 143 | 43.7 |
| D | 1 | 3 | 400 | 5.87 | 157 | 143 | 43.7 |
| D | 6 | 38 | 400 | 5.87 | 157 | 143 | 43.7 |
Histogram calculated using DETX and DETY for each event in the final _common_clean file
| Quadrant A | 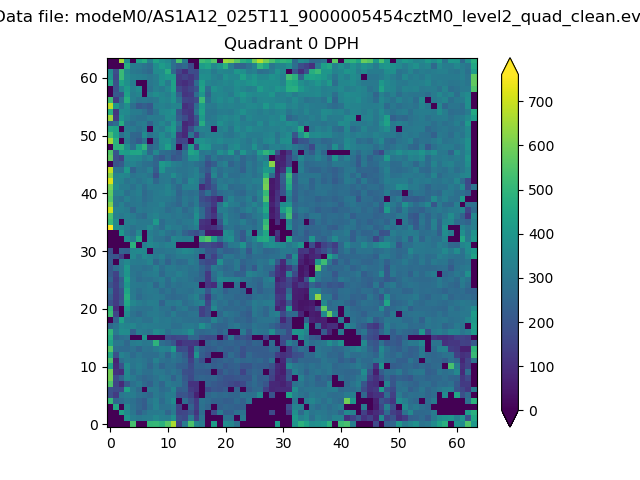 |
 |
Quadrant B |
|---|---|---|---|
| Quadrant D |  |
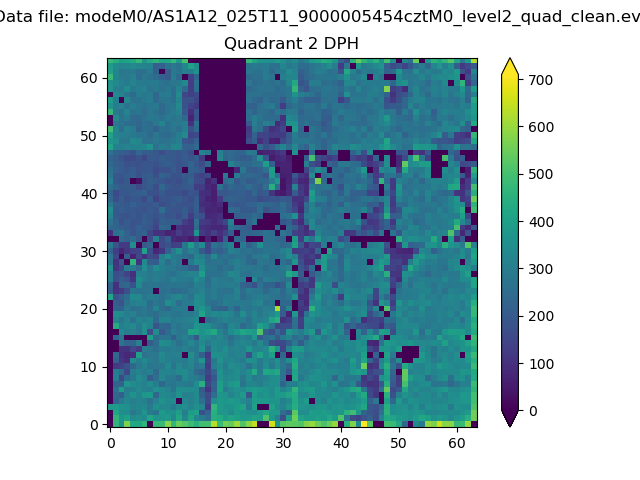 |
Quadrant C |
| Plot type | Count rate plots | Images |
|---|---|---|
| Comparison with Poisson distribution Blue bars denote a histogram of data divided into 1 sec bins. Red curve is a Poisson curve with rate = median count rate of data. |
 |
 |
| Quadrant-wise count rates Data is divided into 100 sec bins |
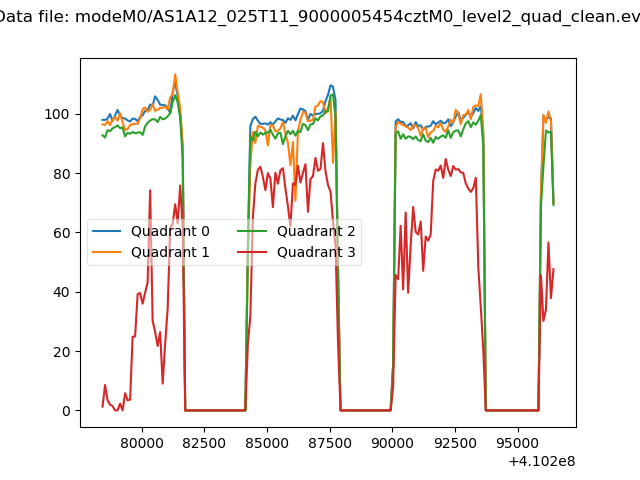 |
|
| Module-wise count rates for Quadrant A Data is divided into 100 sec bins |
 |
 |
| Module-wise count rates for Quadrant B Data is divided into 100 sec bins |
 |
 |
| Module-wise count rates for Quadrant C Data is divided into 100 sec bins |
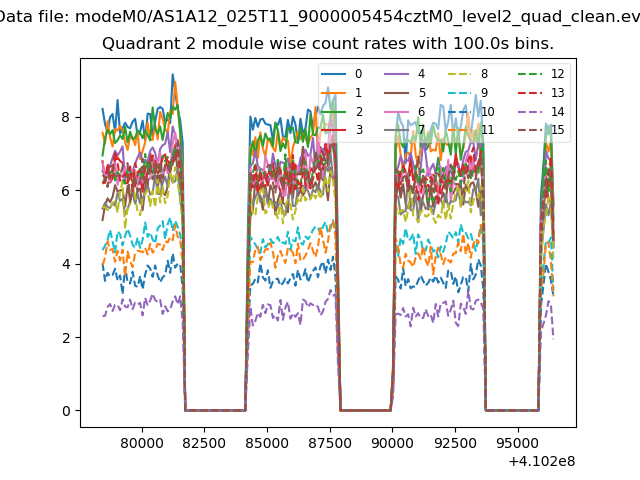 |
 |
| Module-wise count rates for Quadrant D Data is divided into 100 sec bins |
 |
 |
| Parameter | Plot |
|---|---|
| CZT HV Monitor |  |
| D_VDD | 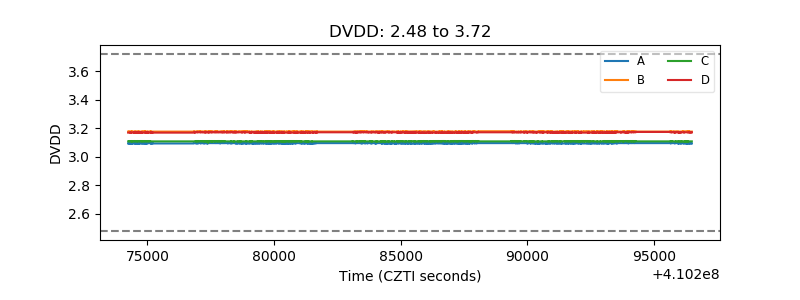 |
| Temperature 1 |  |
| Veto HV Monitor | 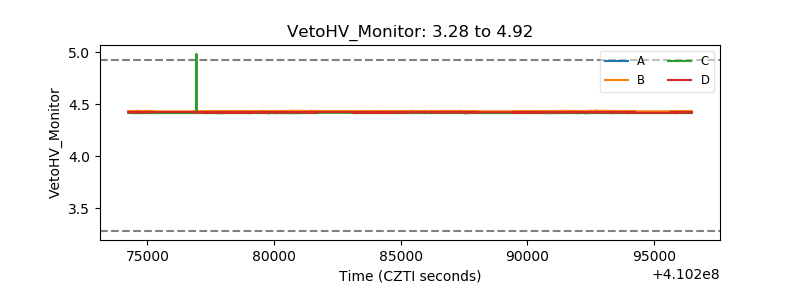 |
| Veto LLD |  |
| Alpha Counter |  |
| _CPM_Rate |  |
| CZT Counter |  |
| +2.5 Volts monitor |  |
| +5 Volts monitor |  |
| _ROLL_ROT |  |
| _Roll_DEC |  |
| _Roll_RA | 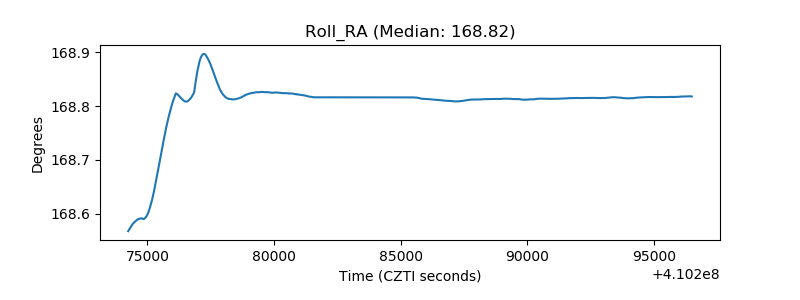 |
| Veto Counter |  |