| Param | Original file | Final file |
|---|---|---|
| Filename | modeM0/AS1T05_035T01_9000005214_36517cztM0_level2.evt | modeM0/AS1T05_035T01_9000005214_36517cztM0_level2_quad_clean.evt |
| Size (bytes) | 423,941,760 | 59,696,640 |
| Size | 404.3 MB | 56.9 MB |
| Events in quadrant A | 2,948,542 | 359,254 |
| Events in quadrant B | 3,165,397 | 356,112 |
| Events in quadrant C | 3,001,309 | 354,122 |
| Events in quadrant D | 3,330,695 | 333,525 |
| Mode M0 | |||
|---|---|---|---|
| Quadrant | BADHDUFLAG | Total packets | Discarded packets |
| A | 0 | 12258 | 3 |
| B | 0 | 13056 | 2 |
| C | 0 | 12196 | 2 |
| D | 0 | 13821 | 2 |
| Mode SS | |||
|---|---|---|---|
| Quadrant | BADHDUFLAG | Total packets | Discarded packets |
| A | 0 | 120 | 0 |
| B | 0 | 120 | 0 |
| C | 0 | 120 | 0 |
| D | 0 | 120 | 0 |
| Mode M9 | |||
|---|---|---|---|
| Quadrant | BADHDUFLAG | Total packets | Discarded packets |
| A | 0 | 33 | 0 |
| B | 0 | 33 | 0 |
| C | 0 | 33 | 0 |
| D | 0 | 33 | 0 |
| Quadrant | Total seconds | Saturated seconds | Saturation percentage |
|---|---|---|---|
| A | 5783 | 22 | 0.380425% |
| B | 5783 | 102 | 1.763790% |
| C | 5783 | 38 | 0.657098% |
| D | 5783 | 124 | 2.144216% |
Noise dominated data is calculated using 1-second bins in cleaned event files. If a bin has >2000 counts, and if more than 50% of those come from <1% of pixels, then it is considered to be noise-dominated and hence unusable.
| Quadrant | # 1 sec bins | Bins with >0 counts | Bins with >2000 counts | High rate bins dominated by noise | Noise dominated (total time) | Noise dominated (detector-on time) | Marked lightcurve |
|---|---|---|---|---|---|---|---|
| A | 9039 | 5785 | 15 | 15 | 0.17% | 0.26% | 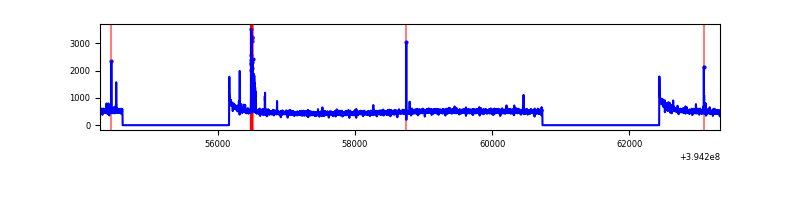 |
| B | 9039 | 5785 | 46 | 46 | 0.51% | 0.80% | 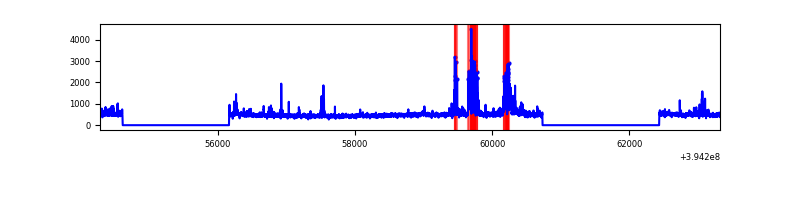 |
| C | 9039 | 5785 | 26 | 26 | 0.29% | 0.45% | 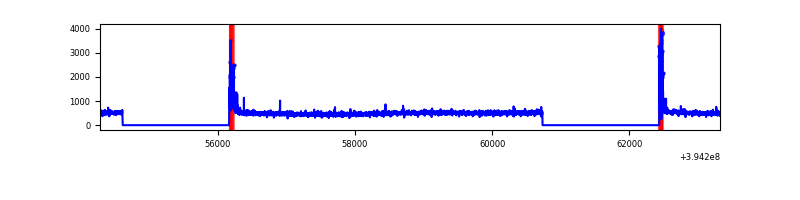 |
| D | 9039 | 5785 | 83 | 83 | 0.92% | 1.43% | 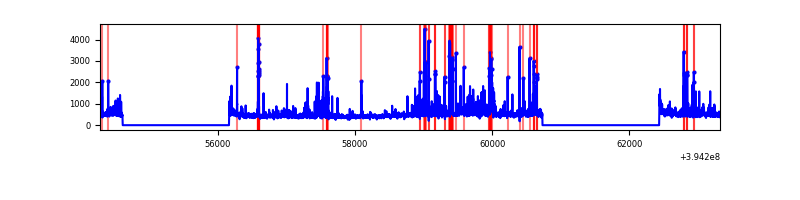 |
Top three noisy pixels from each quadrant. If the there are fewer than three noisy pixels in the level2.evt file, extra rows are filled as -1
| Pixel properties | Quadrant properties | ||||||
|---|---|---|---|---|---|---|---|
| Quadrant | DetID | PixID | Counts | Sigma | Mean | Median | Sigma |
| A | 10 | 83 | 205231 | 1485.16 | 684 | 673 | 137.7 |
| A | 9 | 143 | 74597 | 536.71 | 684 | 673 | 137.7 |
| A | 15 | 223 | 11230 | 76.65 | 684 | 673 | 137.7 |
| B | 5 | 172 | 275256 | 2123.47 | 678 | 661 | 129.3 |
| B | 5 | 255 | 101191 | 777.41 | 678 | 661 | 129.3 |
| B | 15 | 85 | 42998 | 327.4 | 678 | 661 | 129.3 |
| C | 15 | 214 | 247488 | 1612.97 | 660 | 665 | 153.0 |
| C | 0 | 10 | 172446 | 1122.58 | 660 | 665 | 153.0 |
| C | 12 | 249 | 6999 | 41.39 | 660 | 665 | 153.0 |
| D | 13 | 249 | 309222 | 1939.84 | 654 | 637 | 159.1 |
| D | 2 | 250 | 130670 | 817.42 | 654 | 637 | 159.1 |
| D | 2 | 153 | 90347 | 563.94 | 654 | 637 | 159.1 |
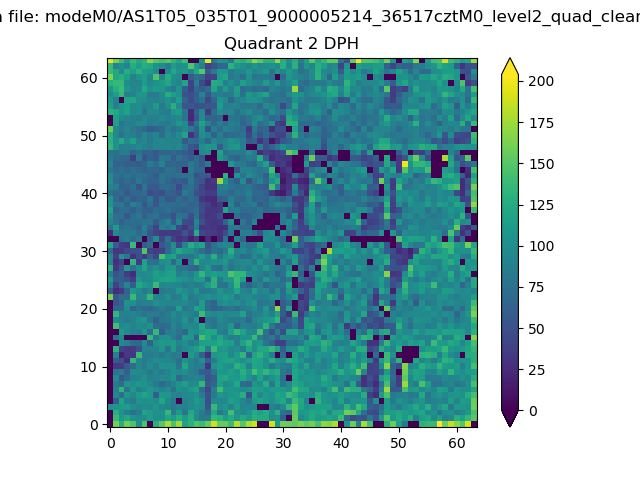
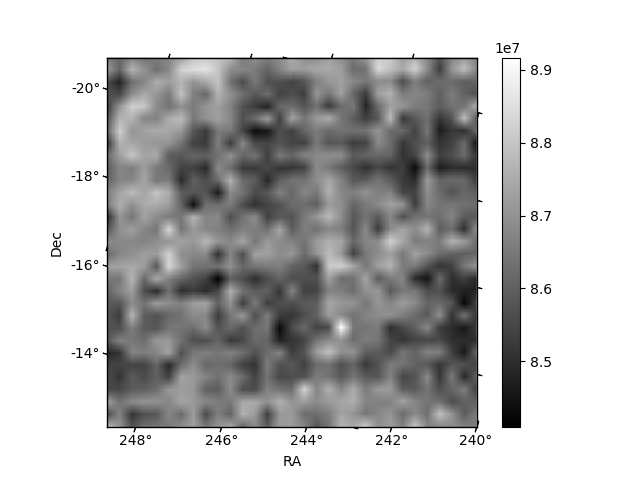
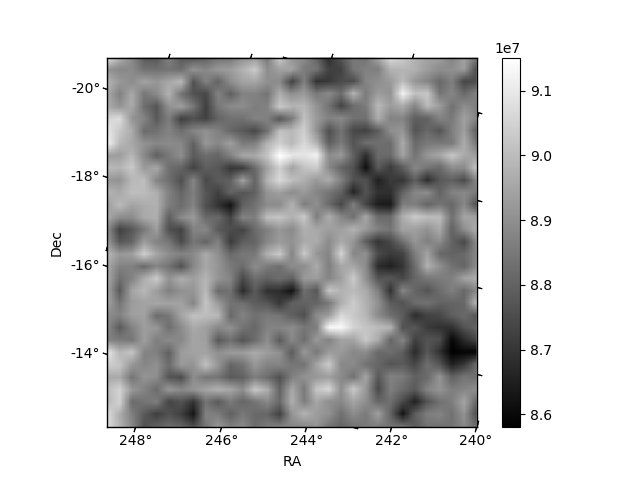
Histogram calculated using DETX and DETY for each event in the final _common_clean file
| Quadrant A | 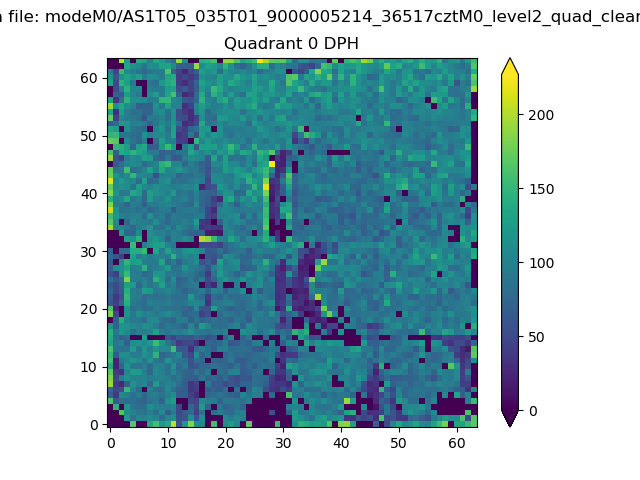 |
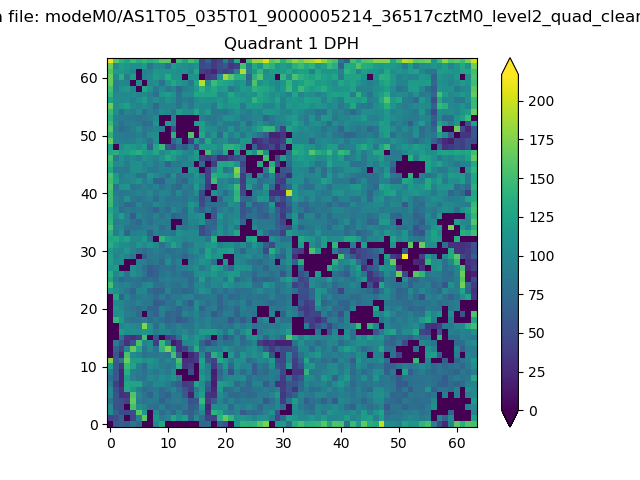 |
Quadrant B |
|---|---|---|---|
| Quadrant D | 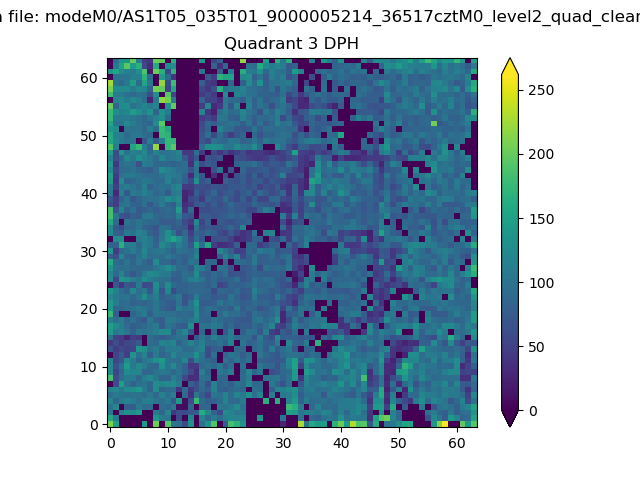 |
 |
Quadrant C |
| Plot type | Count rate plots | Images |
|---|---|---|
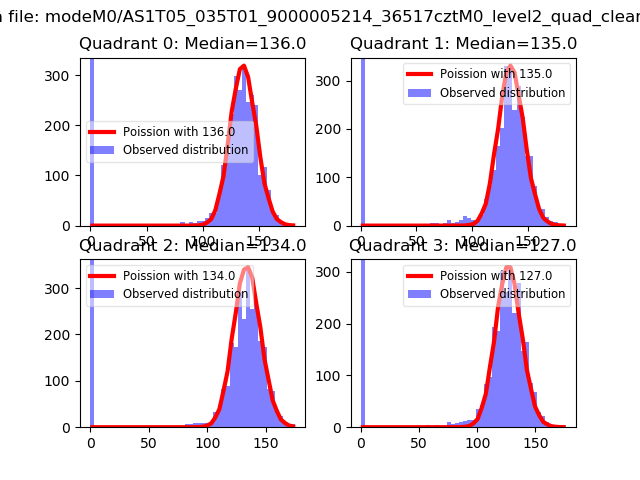
| Comparison with Poisson distribution Blue bars denote a histogram of data divided into 1 sec bins. Red curve is a Poisson curve with rate = median count rate of data. |
 |
 |
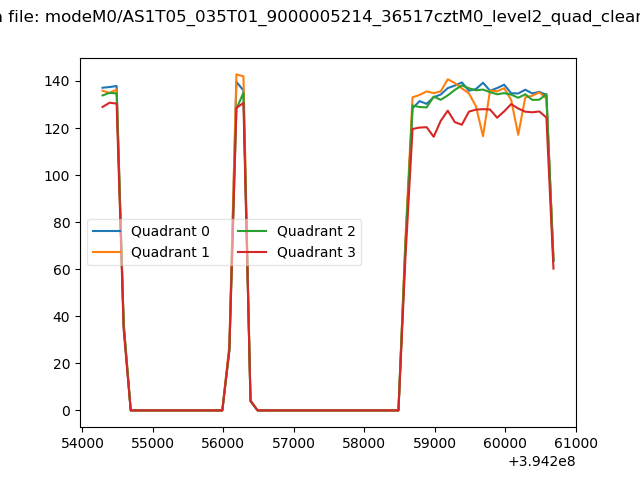
| Quadrant-wise count rates Data is divided into 100 sec bins |
 |
|
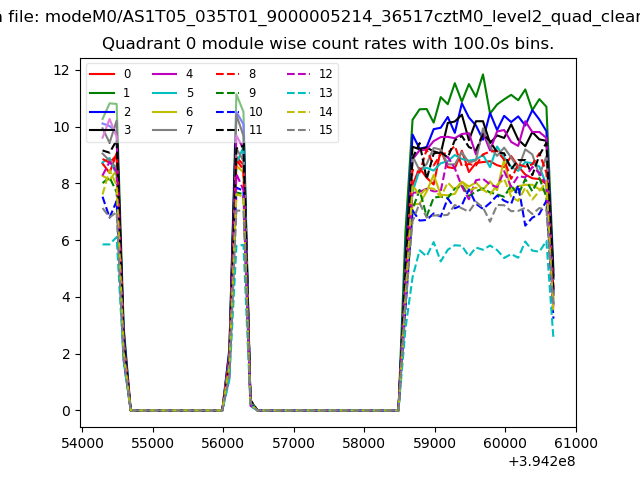
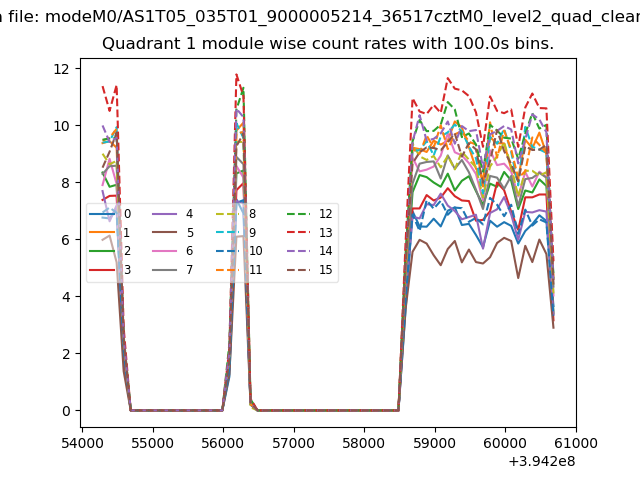
| Module-wise count rates for Quadrant A Data is divided into 100 sec bins |
 |
 |
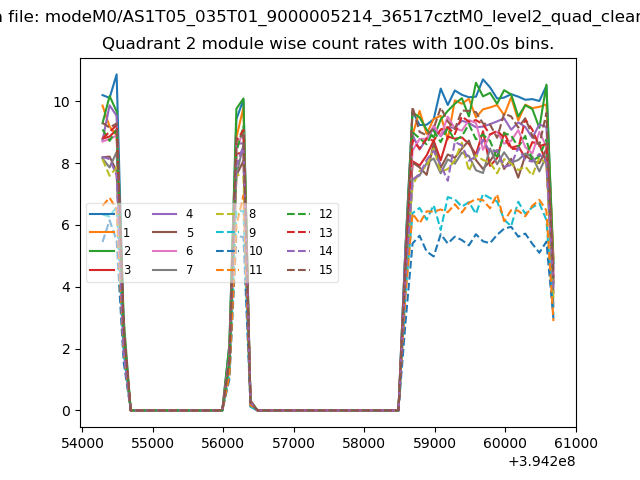
| Module-wise count rates for Quadrant B Data is divided into 100 sec bins |
 |
 |
| Module-wise count rates for Quadrant C Data is divided into 100 sec bins |
 |
 |
| Module-wise count rates for Quadrant D Data is divided into 100 sec bins |
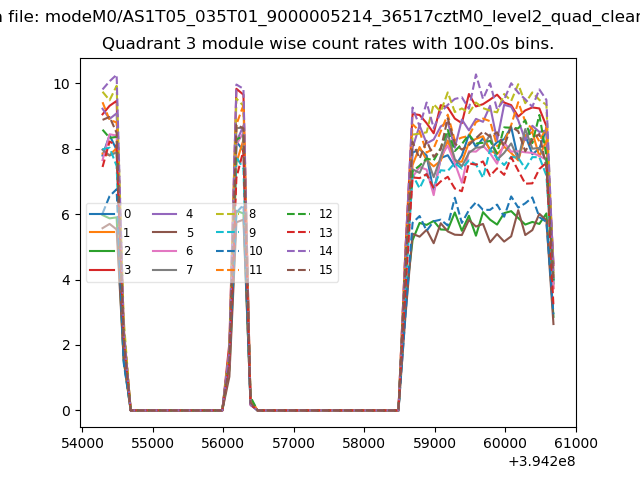 |
 |
| Parameter | Plot |
|---|---|
| CZT HV Monitor | 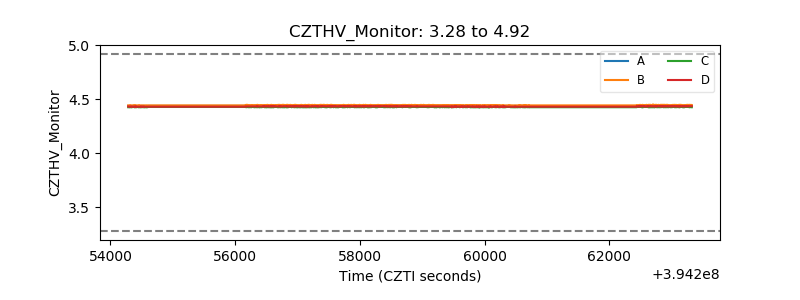 |
| D_VDD | 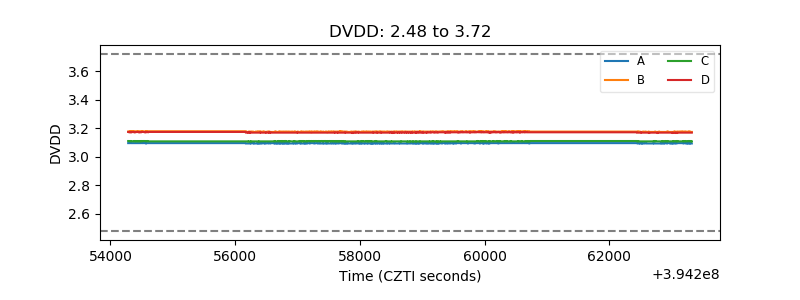 |
| Temperature 1 | 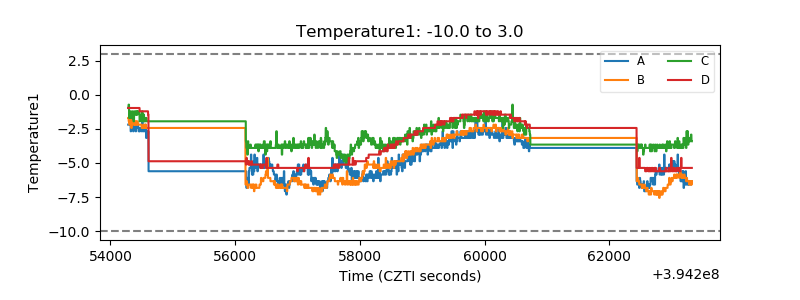 |
| Veto HV Monitor | 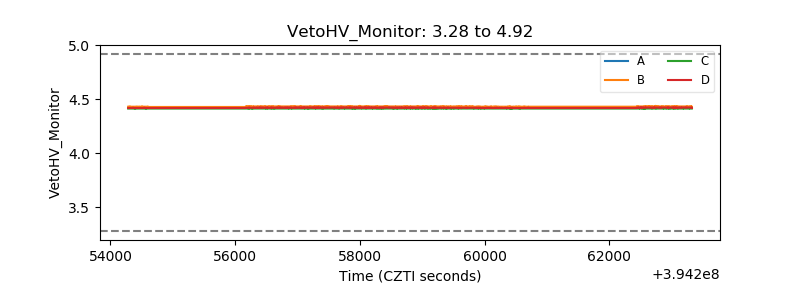 |
| Veto LLD | 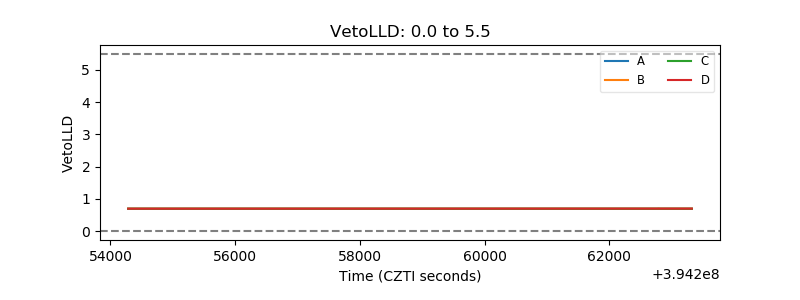 |
| Alpha Counter | 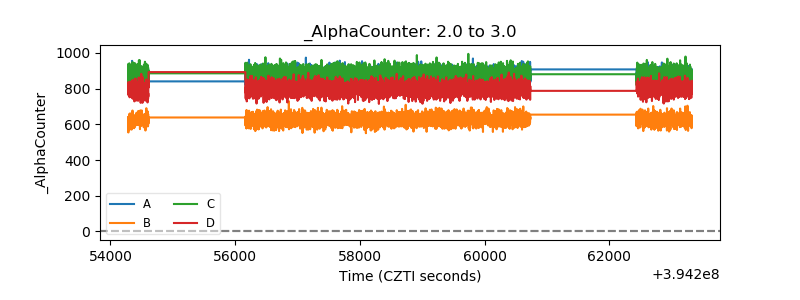 |
| _CPM_Rate | 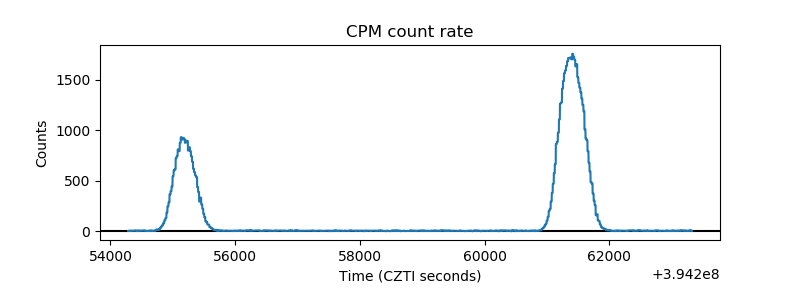 |
| CZT Counter | 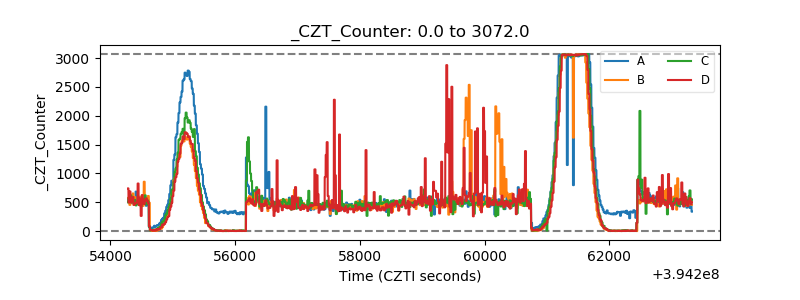 |
| +2.5 Volts monitor | 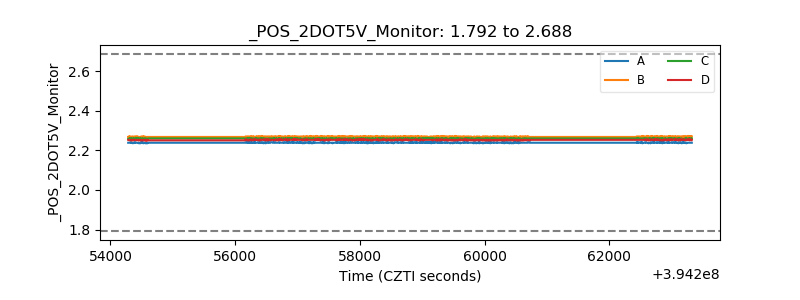 |
| +5 Volts monitor | 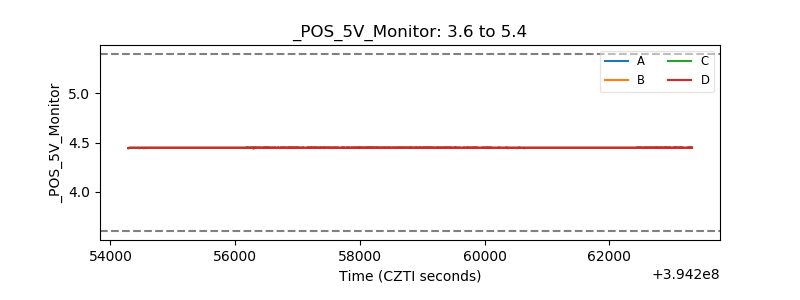 |
| _ROLL_ROT | 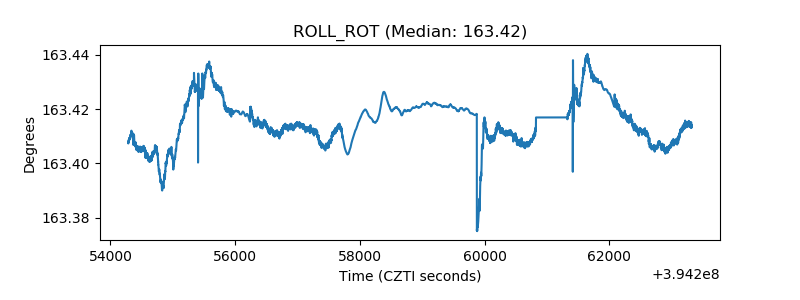 |
| _Roll_DEC | 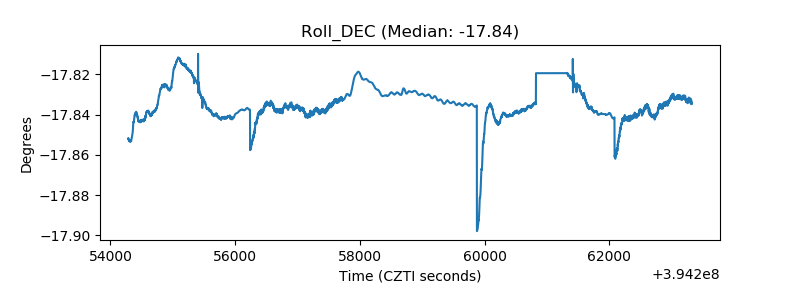 |
| _Roll_RA | 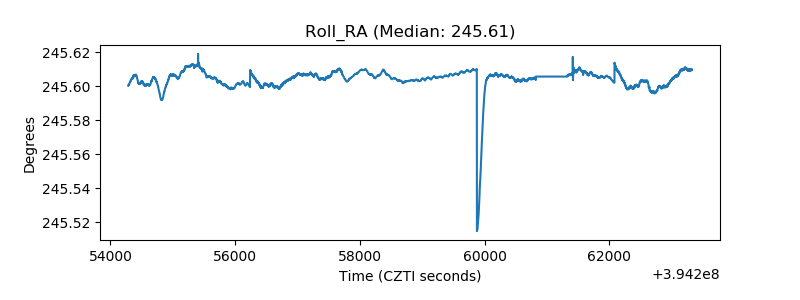 |
| Veto Counter | 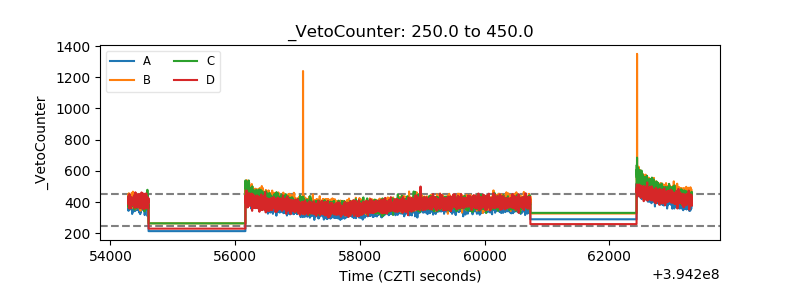 |