| Param | Original file | Final file |
|---|---|---|
| Filename | modeM0/AS1T05_035T01_9000005214_36515cztM0_level2.evt | modeM0/AS1T05_035T01_9000005214_36515cztM0_level2_quad_clean.evt |
| Size (bytes) | 846,437,760 | 124,191,360 |
| Size | 807.2 MB | 118.4 MB |
| Events in quadrant A | 5,271,054 | 773,533 |
| Events in quadrant B | 6,338,076 | 769,726 |
| Events in quadrant C | 5,521,496 | 759,839 |
| Events in quadrant D | 7,778,143 | 714,665 |
| Mode M0 | |||
|---|---|---|---|
| Quadrant | BADHDUFLAG | Total packets | Discarded packets |
| A | 0 | 22537 | 4 |
| B | 0 | 26099 | 3 |
| C | 0 | 22981 | 3 |
| D | 0 | 30595 | 3 |
| Mode SS | |||
|---|---|---|---|
| Quadrant | BADHDUFLAG | Total packets | Discarded packets |
| A | 0 | 218 | 0 |
| B | 0 | 218 | 0 |
| C | 0 | 218 | 0 |
| D | 0 | 218 | 0 |
| Mode M9 | |||
|---|---|---|---|
| Quadrant | BADHDUFLAG | Total packets | Discarded packets |
| A | 0 | 36 | 0 |
| B | 0 | 36 | 0 |
| C | 0 | 36 | 0 |
| D | 0 | 37 | 0 |
| Quadrant | Total seconds | Saturated seconds | Saturation percentage |
|---|---|---|---|
| A | 10734 | 29 | 0.270170% |
| B | 10734 | 240 | 2.235886% |
| C | 10734 | 120 | 1.117943% |
| D | 10734 | 609 | 5.673561% |
Noise dominated data is calculated using 1-second bins in cleaned event files. If a bin has >2000 counts, and if more than 50% of those come from <1% of pixels, then it is considered to be noise-dominated and hence unusable.
| Quadrant | # 1 sec bins | Bins with >0 counts | Bins with >2000 counts | High rate bins dominated by noise | Noise dominated (total time) | Noise dominated (detector-on time) | Marked lightcurve |
|---|---|---|---|---|---|---|---|
| A | 13510 | 10736 | 15 | 15 | 0.11% | 0.14% | 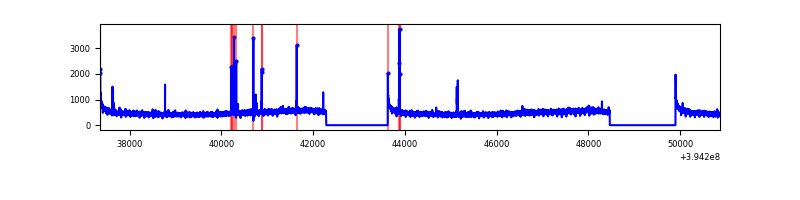 |
| B | 13510 | 10736 | 146 | 146 | 1.08% | 1.36% | 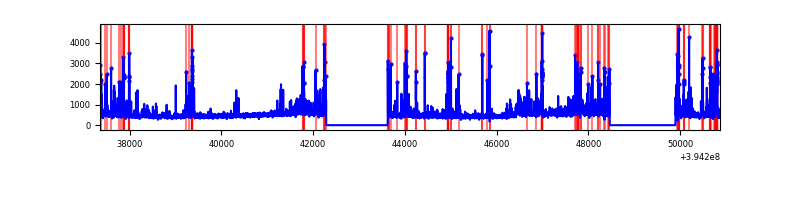 |
| C | 13510 | 10736 | 76 | 76 | 0.56% | 0.71% | 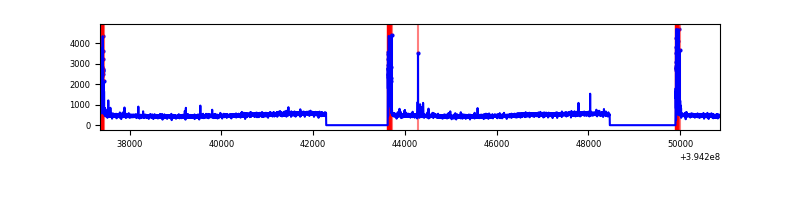 |
| D | 13510 | 10736 | 583 | 583 | 4.32% | 5.43% | 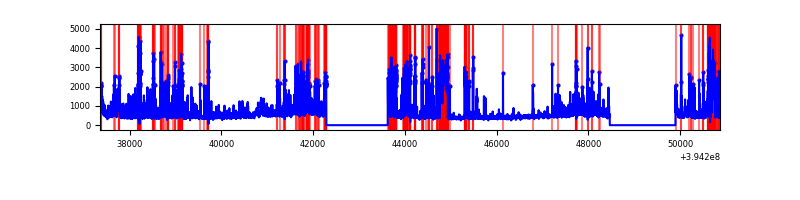 |
Top three noisy pixels from each quadrant. If the there are fewer than three noisy pixels in the level2.evt file, extra rows are filled as -1
| Pixel properties | Quadrant properties | ||||||
|---|---|---|---|---|---|---|---|
| Quadrant | DetID | PixID | Counts | Sigma | Mean | Median | Sigma |
| A | 10 | 83 | 356823 | 1432.0 | 1239 | 1218 | 248.3 |
| A | 15 | 223 | 72499 | 287.04 | 1239 | 1218 | 248.3 |
| A | 9 | 143 | 26028 | 99.91 | 1239 | 1218 | 248.3 |
| B | 5 | 255 | 393280 | 1659.88 | 1223 | 1192 | 236.2 |
| B | 5 | 172 | 380291 | 1604.9 | 1223 | 1192 | 236.2 |
| B | 4 | 171 | 269530 | 1135.99 | 1223 | 1192 | 236.2 |
| C | 15 | 214 | 453613 | 1622.05 | 1194 | 1200 | 278.9 |
| C | 0 | 10 | 397873 | 1422.21 | 1194 | 1200 | 278.9 |
| C | 12 | 249 | 11589 | 37.25 | 1194 | 1200 | 278.9 |
| D | 12 | 227 | 1000415 | 3413.97 | 1178 | 1146 | 292.7 |
| D | 13 | 249 | 809441 | 2761.51 | 1178 | 1146 | 292.7 |
| D | 2 | 250 | 427252 | 1455.78 | 1178 | 1146 | 292.7 |
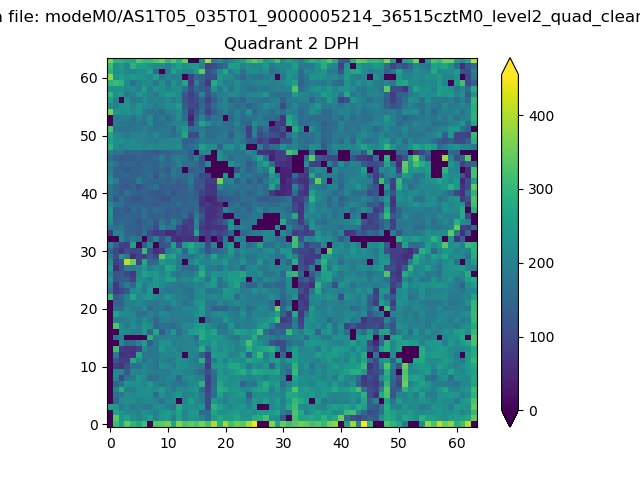
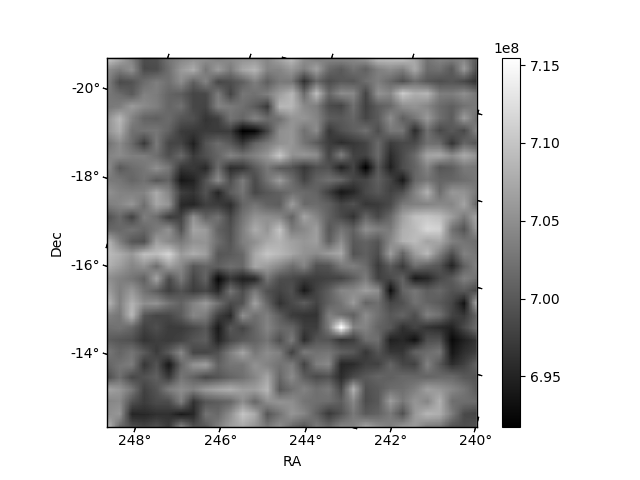
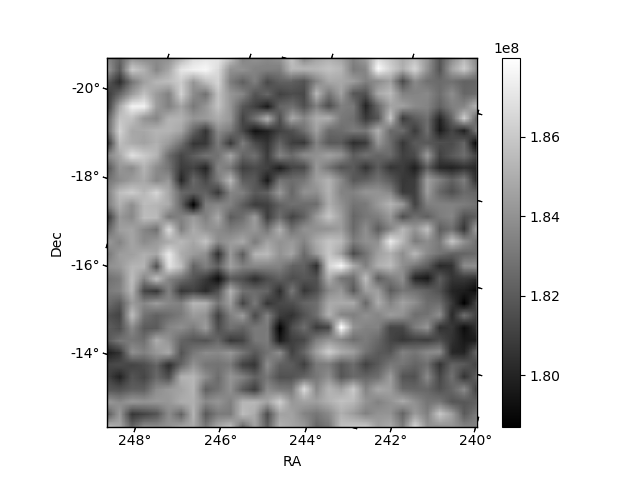
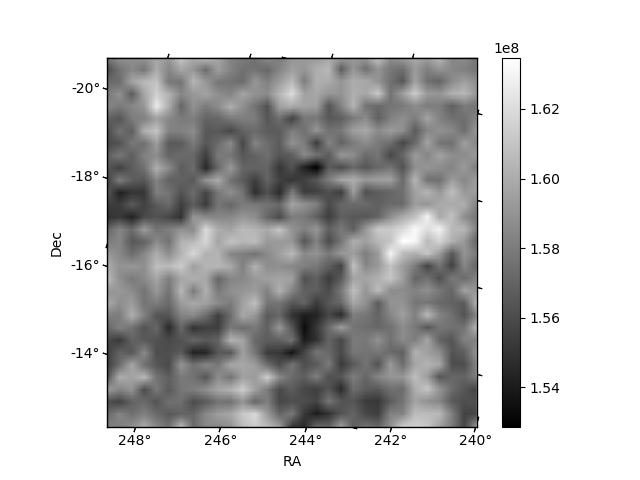
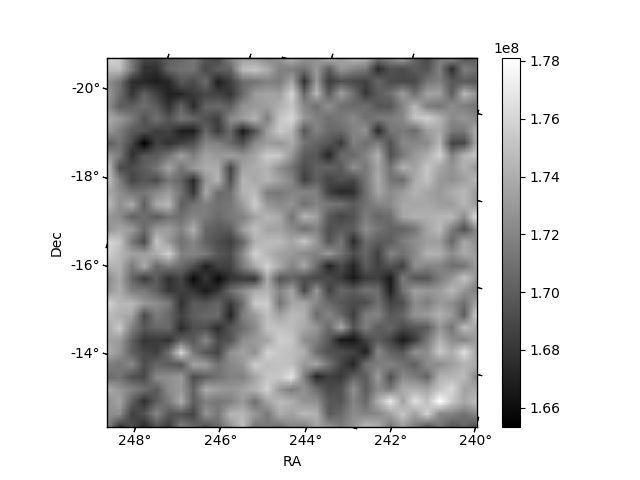
Histogram calculated using DETX and DETY for each event in the final _common_clean file
| Quadrant A | 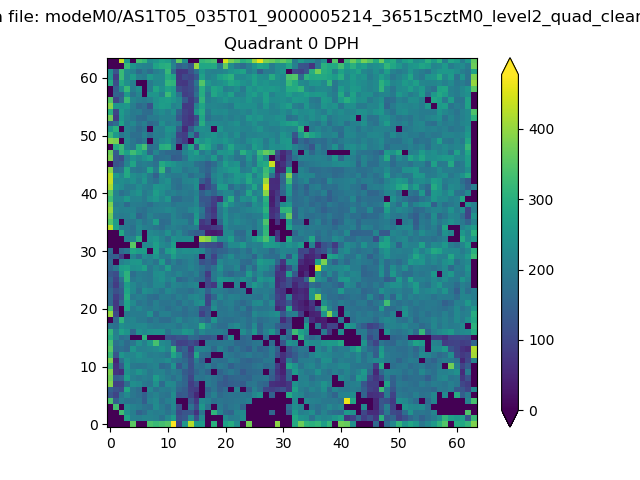 |
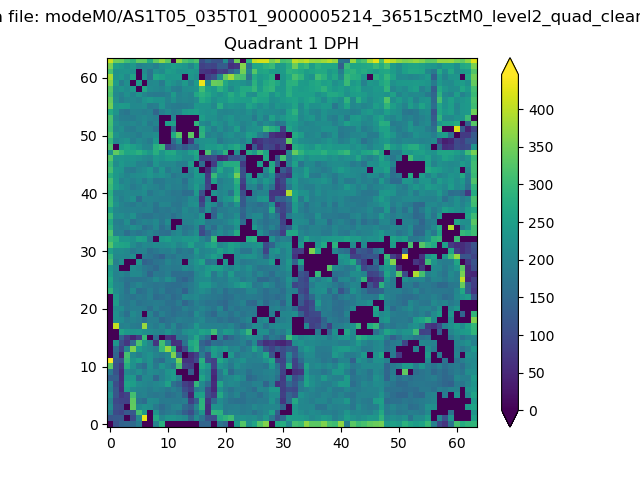 |
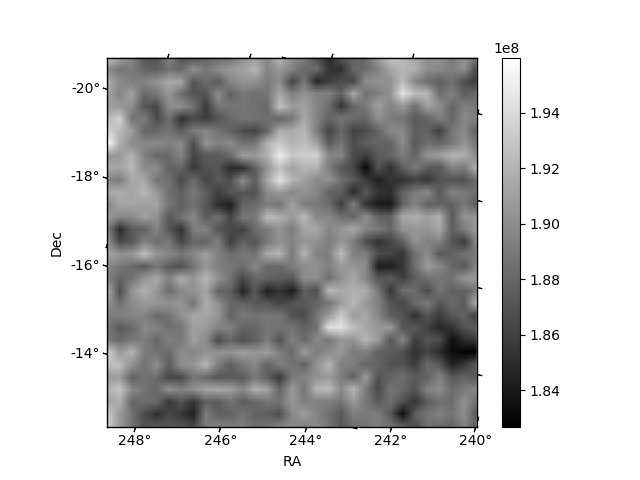
Quadrant B |
|---|---|---|---|
| Quadrant D | 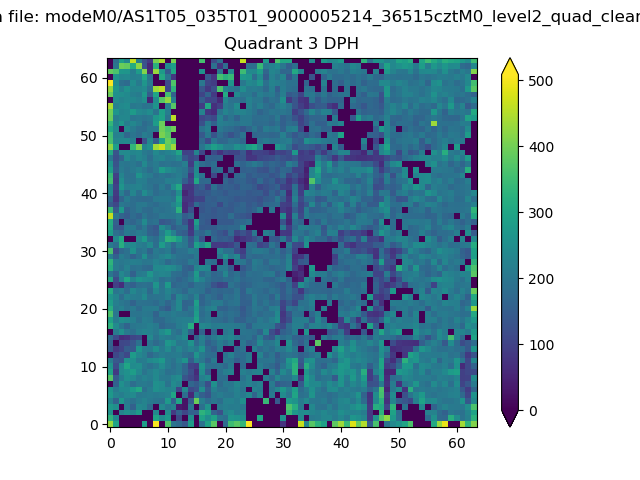 |
 |
Quadrant C |
| Plot type | Count rate plots | Images |
|---|---|---|
| Comparison with Poisson distribution Blue bars denote a histogram of data divided into 1 sec bins. Red curve is a Poisson curve with rate = median count rate of data. |
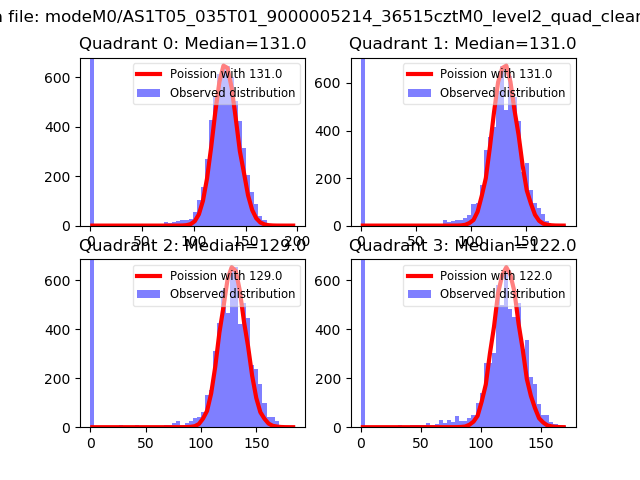 |
 |
| Quadrant-wise count rates Data is divided into 100 sec bins |
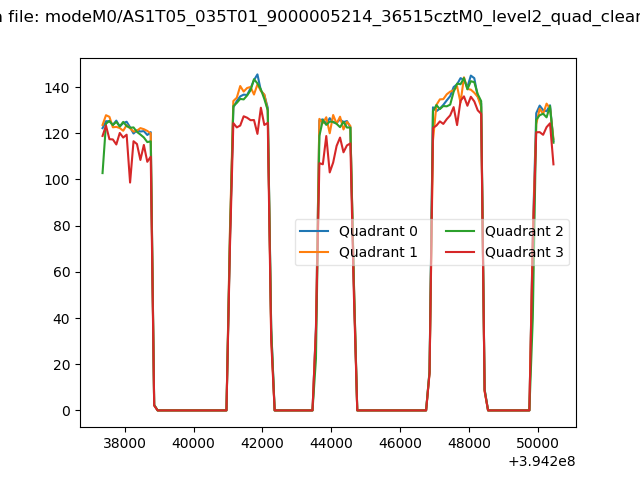 |
|
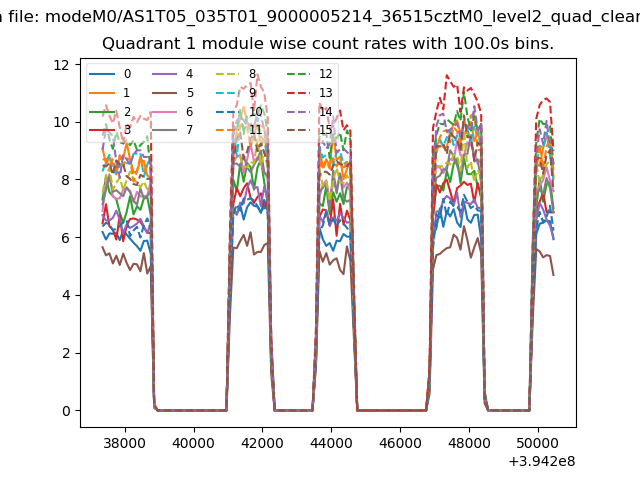
| Module-wise count rates for Quadrant A Data is divided into 100 sec bins |
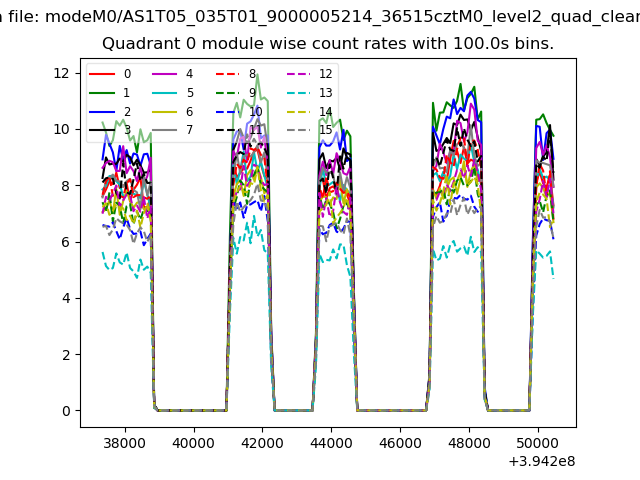 |
 |
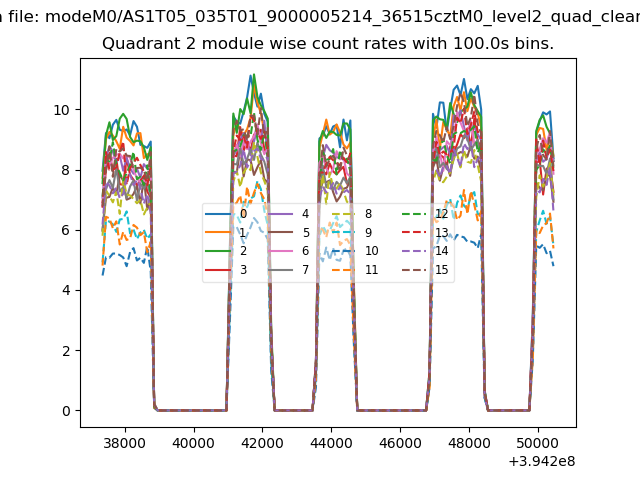
| Module-wise count rates for Quadrant B Data is divided into 100 sec bins |
 |
 |
| Module-wise count rates for Quadrant C Data is divided into 100 sec bins |
 |
 |
| Module-wise count rates for Quadrant D Data is divided into 100 sec bins |
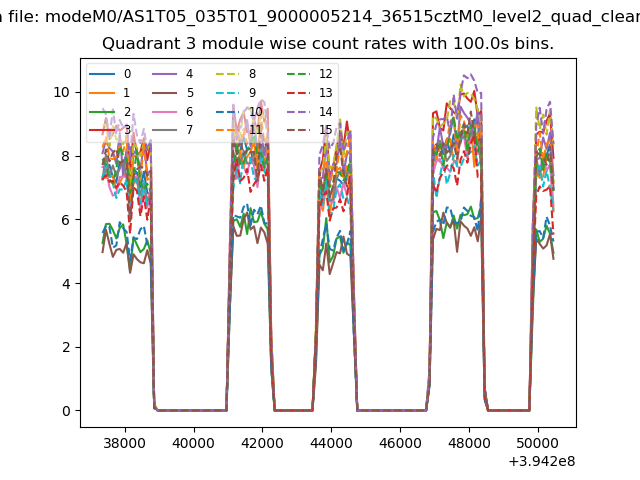 |
 |
| Parameter | Plot |
|---|---|
| CZT HV Monitor | 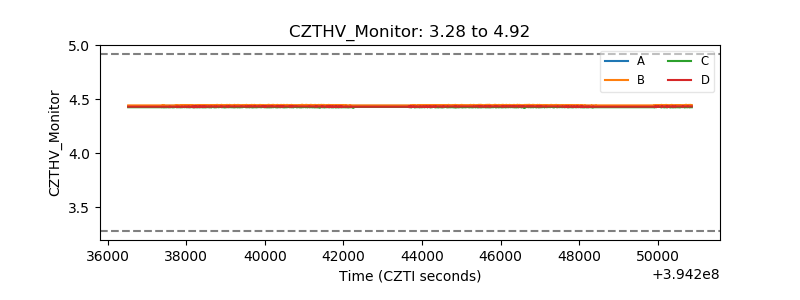 |
| D_VDD | 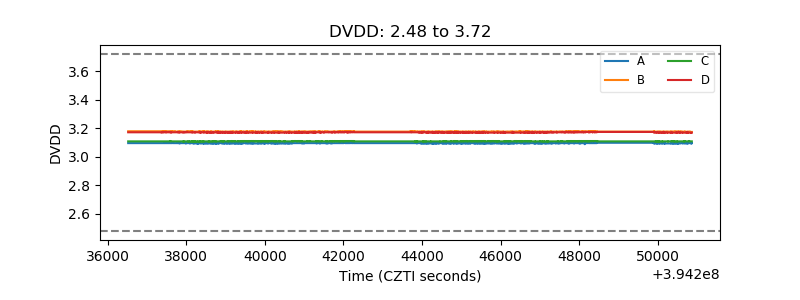 |
| Temperature 1 | 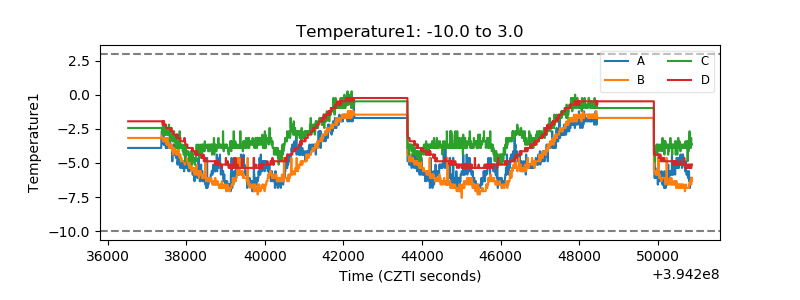 |
| Veto HV Monitor | 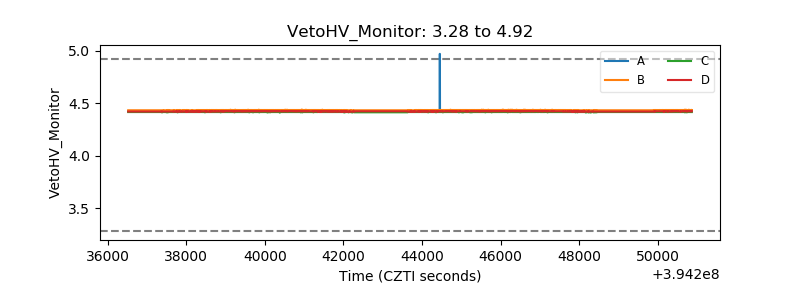 |
| Veto LLD | 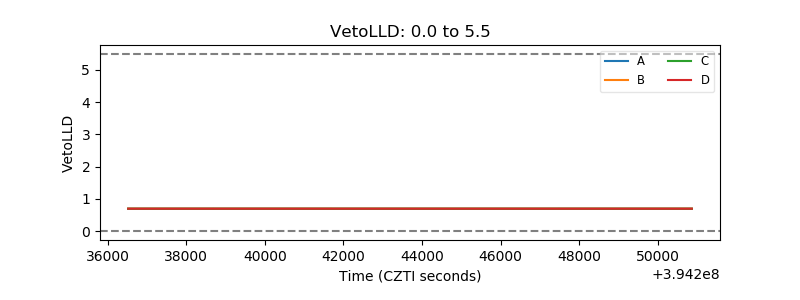 |
| Alpha Counter | 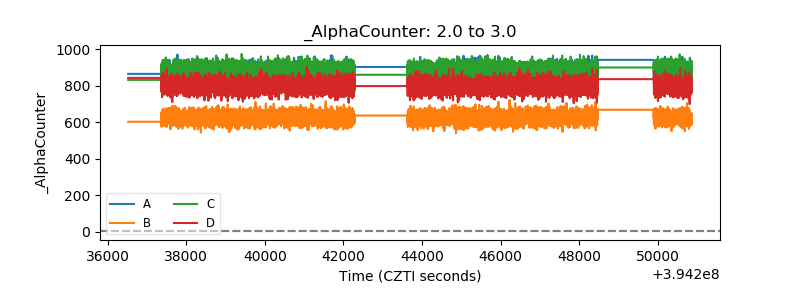 |
| _CPM_Rate | 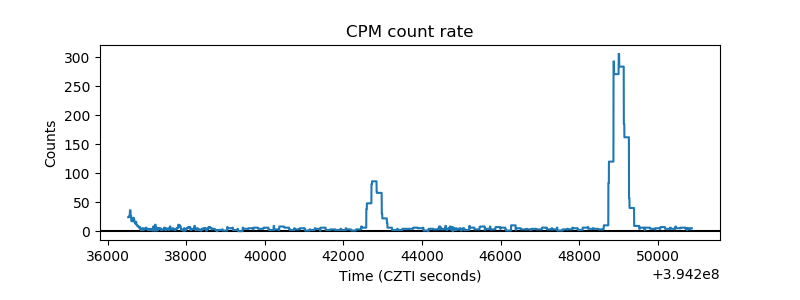 |
| CZT Counter | 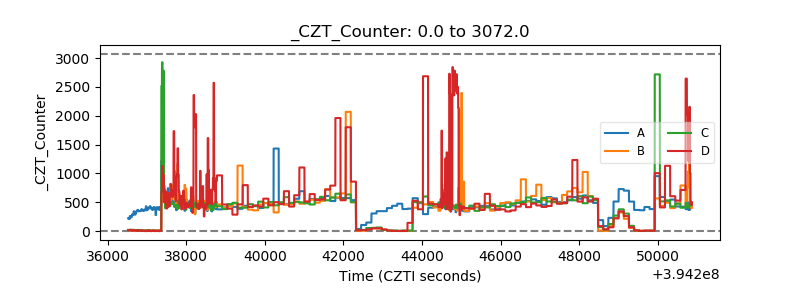 |
| +2.5 Volts monitor | 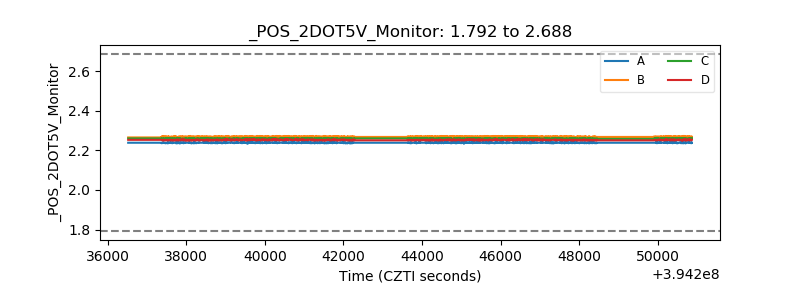 |
| +5 Volts monitor | 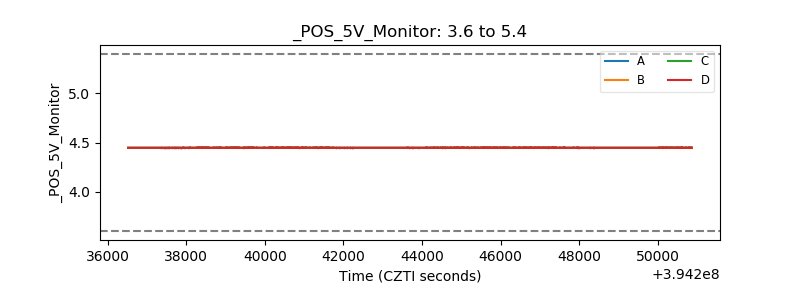 |
| _ROLL_ROT | 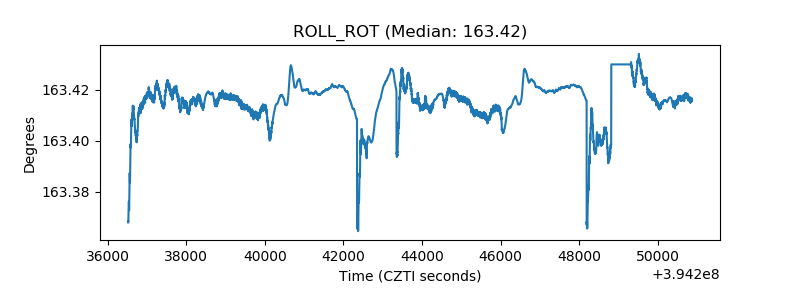 |
| _Roll_DEC | 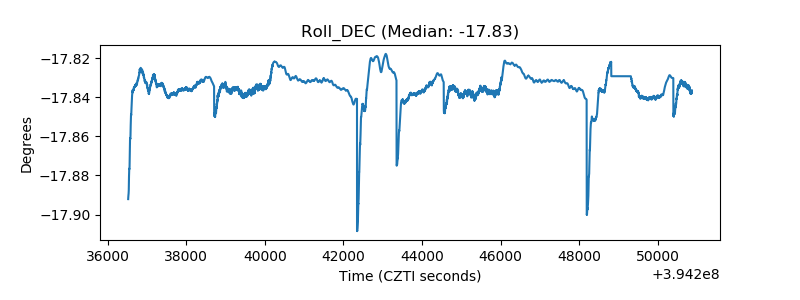 |
| _Roll_RA | 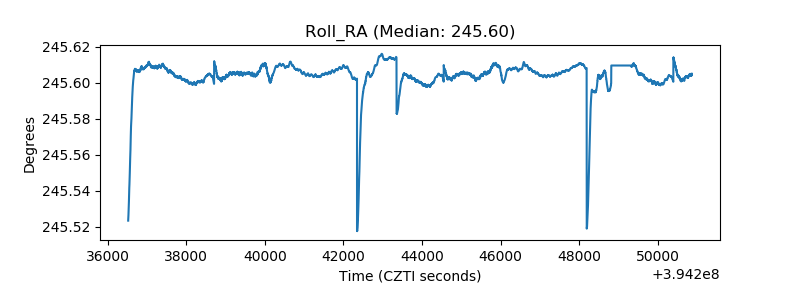 |
| Veto Counter | 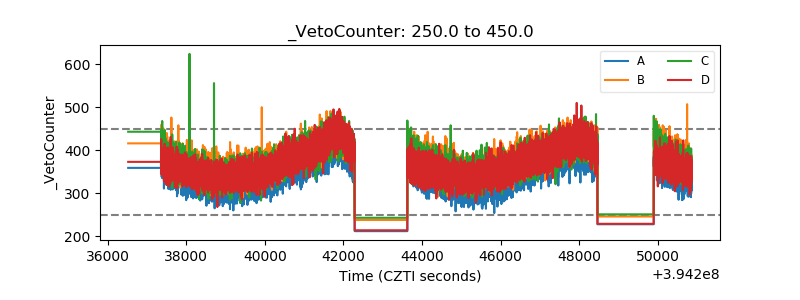 |