| Param | Original file | Final file |
|---|---|---|
| Filename | modeM0/AS1T05_035T01_9000005214_36508cztM0_level2.evt | modeM0/AS1T05_035T01_9000005214_36508cztM0_level2_quad_clean.evt |
| Size (bytes) | 468,826,560 | 98,582,400 |
| Size | 447.1 MB | 94.0 MB |
| Events in quadrant A | 2,793,762 | 680,844 |
| Events in quadrant B | 3,330,816 | 676,668 |
| Events in quadrant C | 2,903,189 | 669,677 |
| Events in quadrant D | 4,821,447 | 597,334 |
| Mode M0 | |||
|---|---|---|---|
| Quadrant | BADHDUFLAG | Total packets | Discarded packets |
| A | 0 | 11311 | 3 |
| B | 0 | 13071 | 2 |
| C | 0 | 11586 | 2 |
| D | 0 | 17777 | 2 |
| Mode SS | |||
|---|---|---|---|
| Quadrant | BADHDUFLAG | Total packets | Discarded packets |
| A | 0 | 106 | 0 |
| B | 0 | 106 | 0 |
| C | 0 | 106 | 0 |
| D | 0 | 106 | 0 |
| Mode M9 | |||
|---|---|---|---|
| Quadrant | BADHDUFLAG | Total packets | Discarded packets |
| A | 0 | 43 | 0 |
| B | 0 | 43 | 0 |
| C | 0 | 43 | 0 |
| D | 0 | 43 | 0 |
| Quadrant | Total seconds | Saturated seconds | Saturation percentage |
|---|---|---|---|
| A | 5152 | 9 | 0.174689% |
| B | 5152 | 148 | 2.872671% |
| C | 5152 | 42 | 0.815217% |
| D | 5152 | 562 | 10.908385% |
Noise dominated data is calculated using 1-second bins in cleaned event files. If a bin has >2000 counts, and if more than 50% of those come from <1% of pixels, then it is considered to be noise-dominated and hence unusable.
| Quadrant | # 1 sec bins | Bins with >0 counts | Bins with >2000 counts | High rate bins dominated by noise | Noise dominated (total time) | Noise dominated (detector-on time) | Marked lightcurve |
|---|---|---|---|---|---|---|---|
| A | 9398 | 5154 | 1 | 1 | 0.01% | 0.02% | 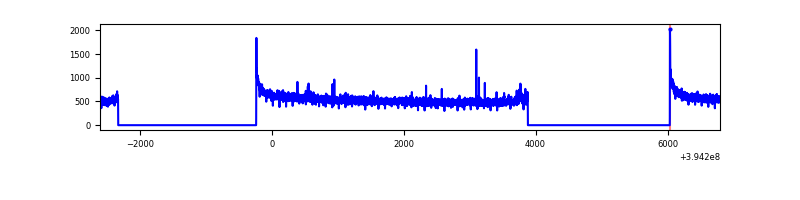 |
| B | 9398 | 5154 | 94 | 94 | 1.00% | 1.82% | 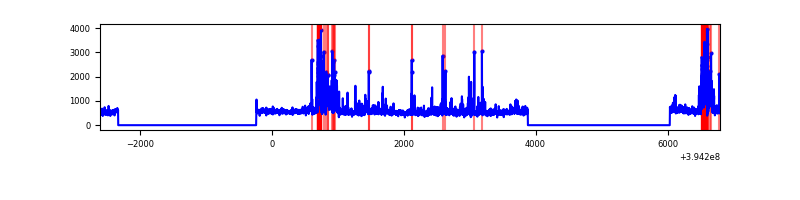 |
| C | 9398 | 5154 | 28 | 28 | 0.30% | 0.54% | 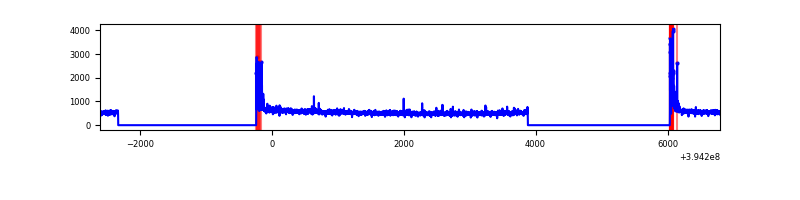 |
| D | 9398 | 5154 | 457 | 457 | 4.86% | 8.87% | 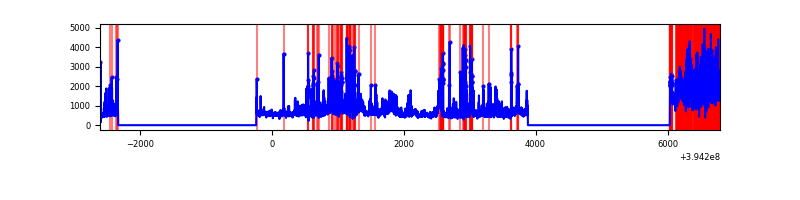 |
Top three noisy pixels from each quadrant. If the there are fewer than three noisy pixels in the level2.evt file, extra rows are filled as -1
| Pixel properties | Quadrant properties | ||||||
|---|---|---|---|---|---|---|---|
| Quadrant | DetID | PixID | Counts | Sigma | Mean | Median | Sigma |
| A | 10 | 83 | 199514 | 1497.66 | 664 | 654 | 132.8 |
| A | 13 | 6 | 11630 | 82.66 | 664 | 654 | 132.8 |
| A | 13 | 254 | 8774 | 61.15 | 664 | 654 | 132.8 |
| B | 5 | 172 | 419075 | 3421.26 | 644 | 630 | 122.3 |
| B | 5 | 255 | 113396 | 921.99 | 644 | 630 | 122.3 |
| B | 0 | 189 | 87187 | 707.7 | 644 | 630 | 122.3 |
| C | 15 | 214 | 225050 | 1524.32 | 635 | 641 | 147.2 |
| C | 0 | 10 | 188082 | 1273.22 | 635 | 641 | 147.2 |
| C | 10 | 49 | 9928 | 63.08 | 635 | 641 | 147.2 |
| D | 12 | 227 | 1393157 | 9387.71 | 613 | 598 | 148.3 |
| D | 13 | 249 | 264288 | 1777.62 | 613 | 598 | 148.3 |
| D | 12 | 235 | 165982 | 1114.91 | 613 | 598 | 148.3 |
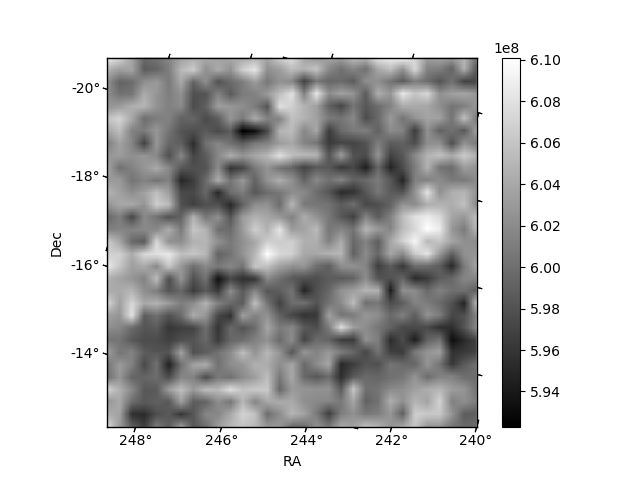
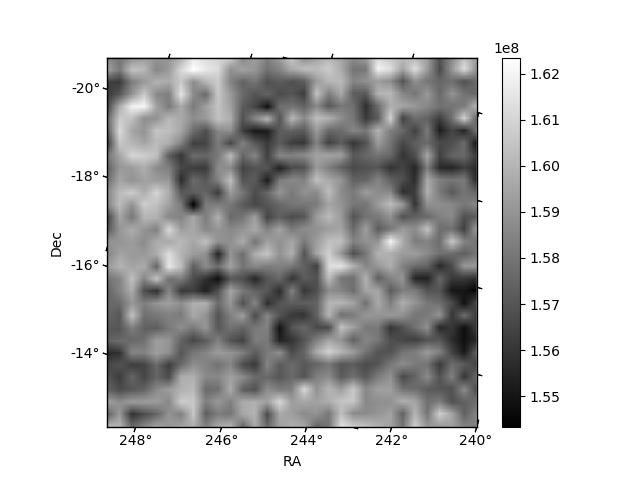
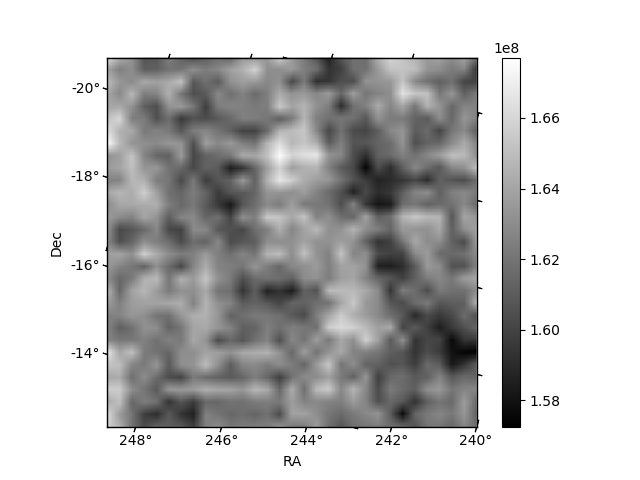
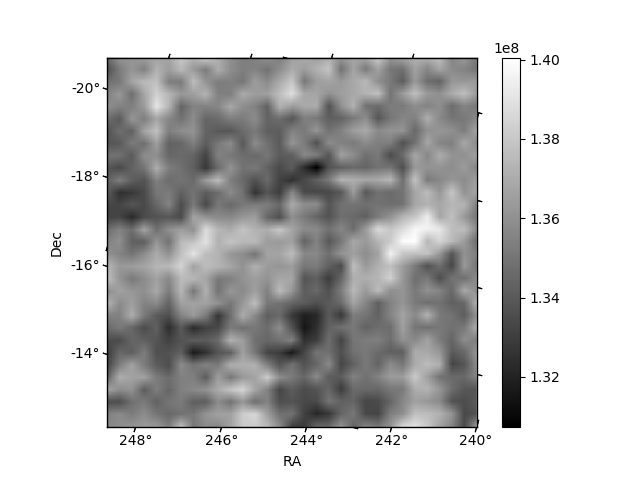
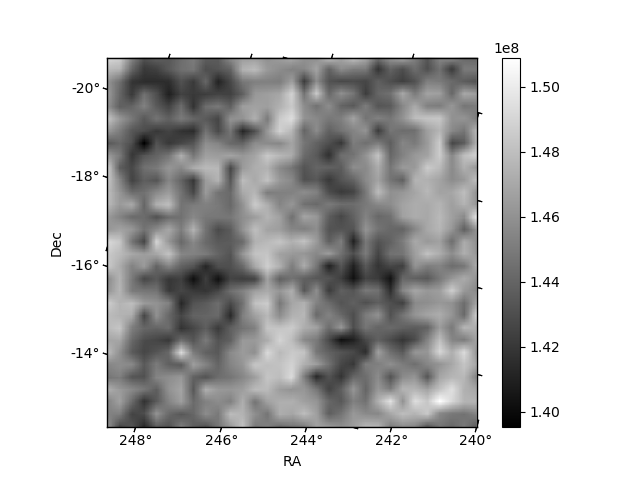
Histogram calculated using DETX and DETY for each event in the final _common_clean file
| Quadrant A | 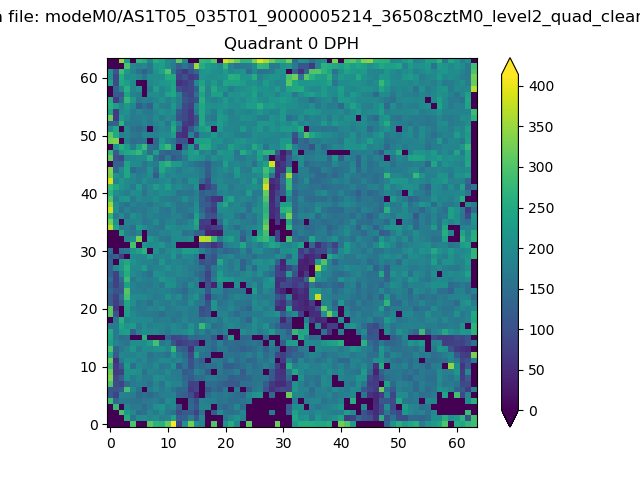 |
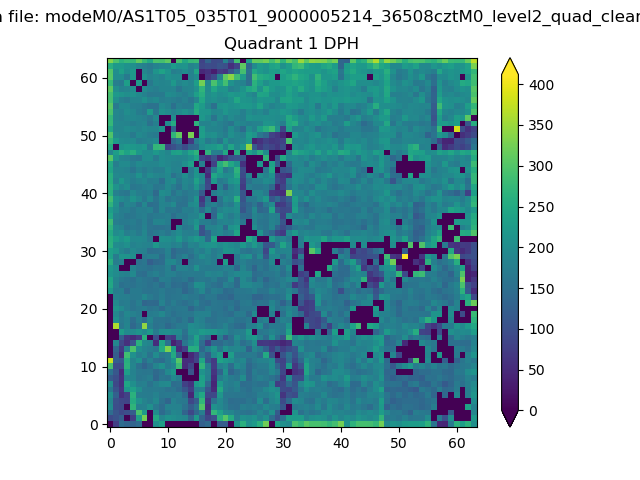 |
Quadrant B |
|---|---|---|---|
| Quadrant D | 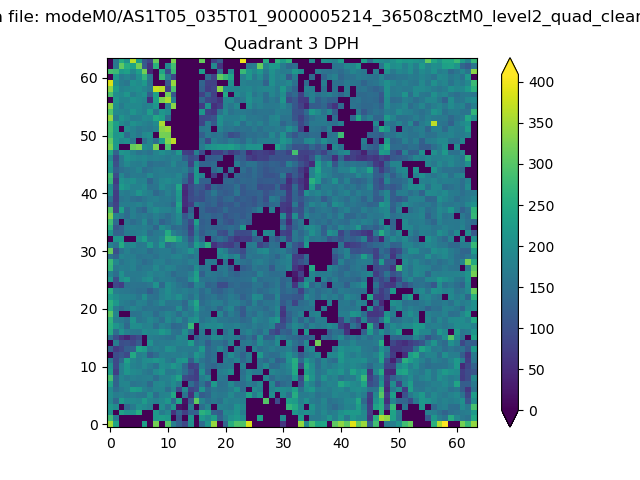 |
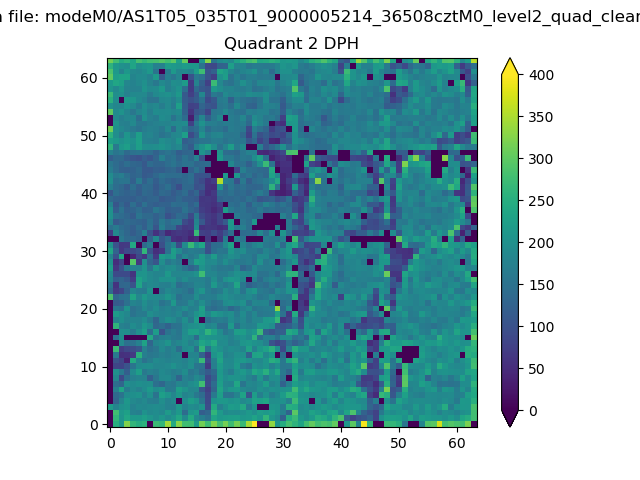 |
Quadrant C |
| Plot type | Count rate plots | Images |
|---|---|---|
| Comparison with Poisson distribution Blue bars denote a histogram of data divided into 1 sec bins. Red curve is a Poisson curve with rate = median count rate of data. |
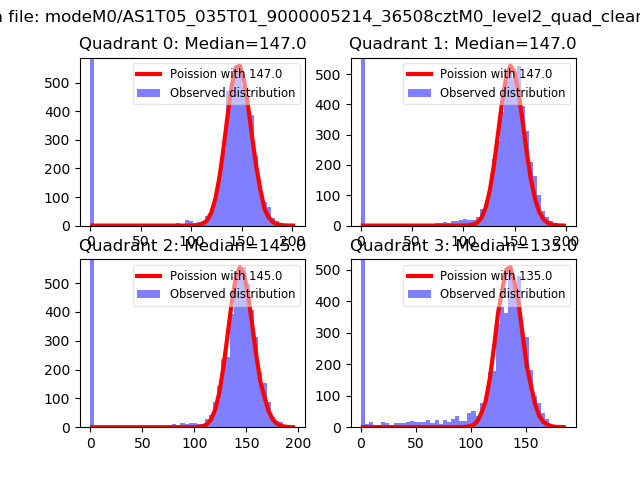 |
 |
| Quadrant-wise count rates Data is divided into 100 sec bins |
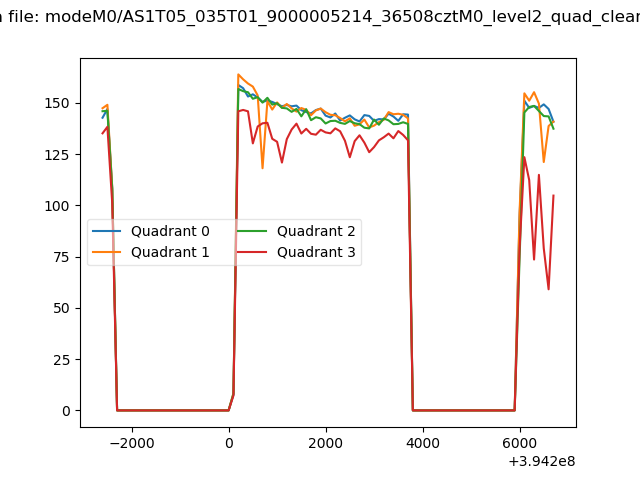 |
|
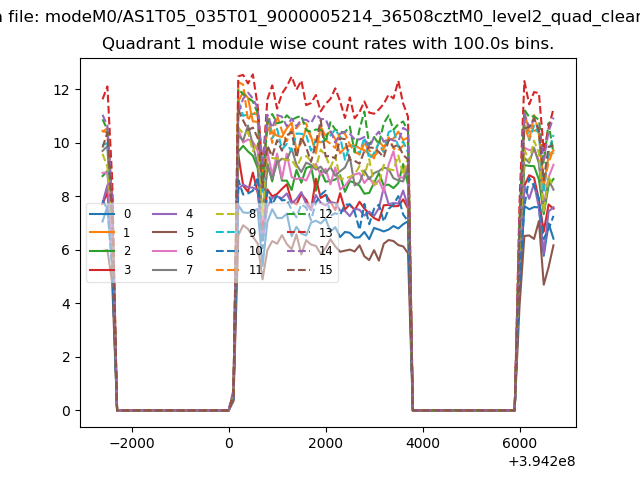
| Module-wise count rates for Quadrant A Data is divided into 100 sec bins |
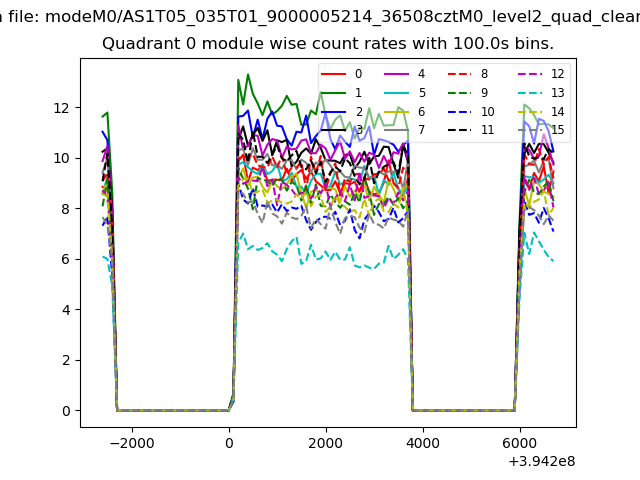 |
 |
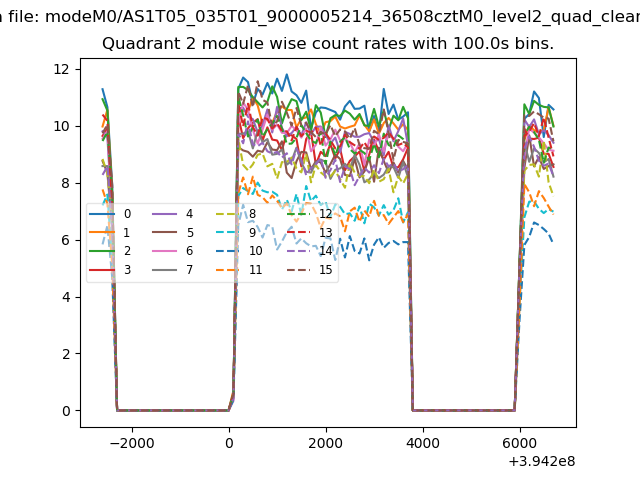
| Module-wise count rates for Quadrant B Data is divided into 100 sec bins |
 |
 |
| Module-wise count rates for Quadrant C Data is divided into 100 sec bins |
 |
 |
| Module-wise count rates for Quadrant D Data is divided into 100 sec bins |
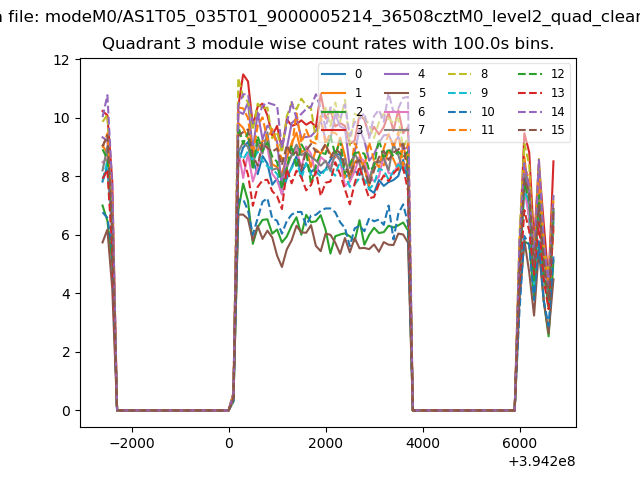 |
 |
| Parameter | Plot |
|---|---|
| CZT HV Monitor | 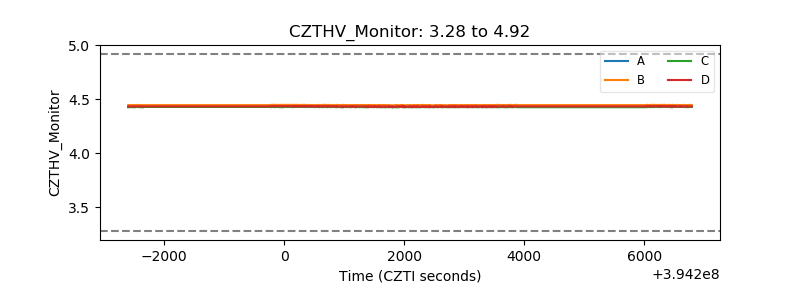 |
| D_VDD | 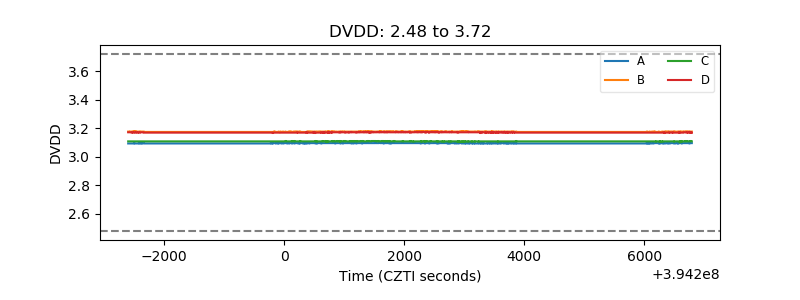 |
| Temperature 1 | 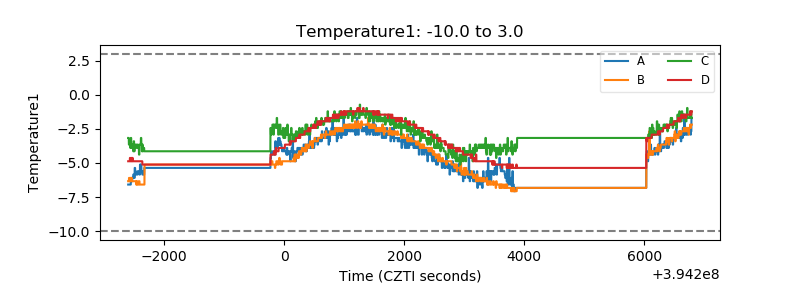 |
| Veto HV Monitor | 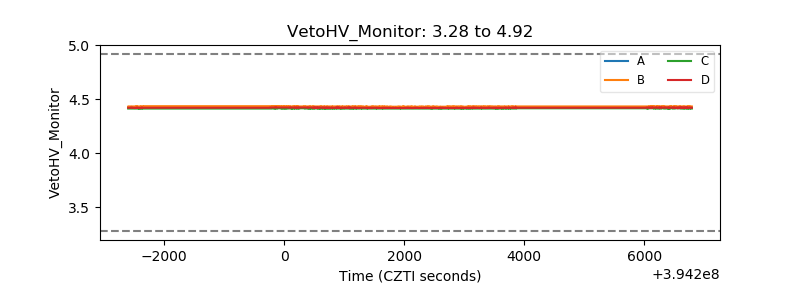 |
| Veto LLD | 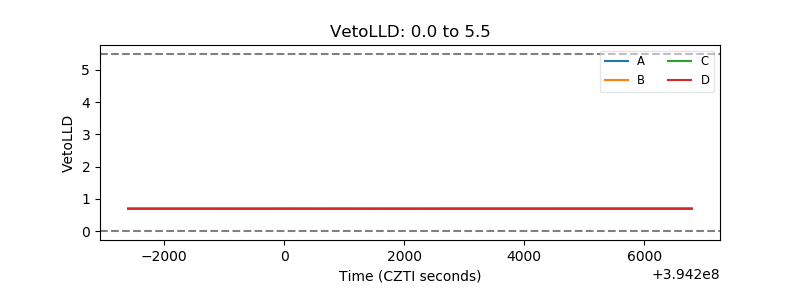 |
| Alpha Counter | 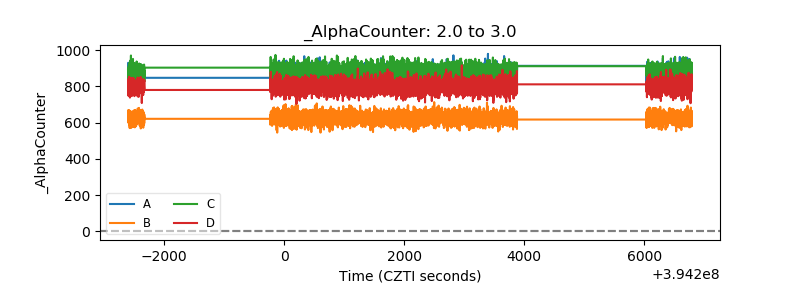 |
| _CPM_Rate | 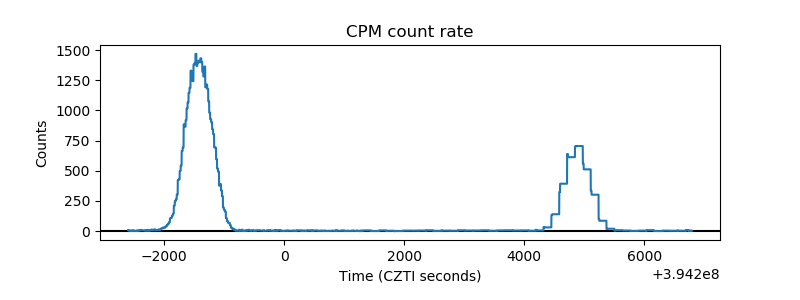 |
| CZT Counter | 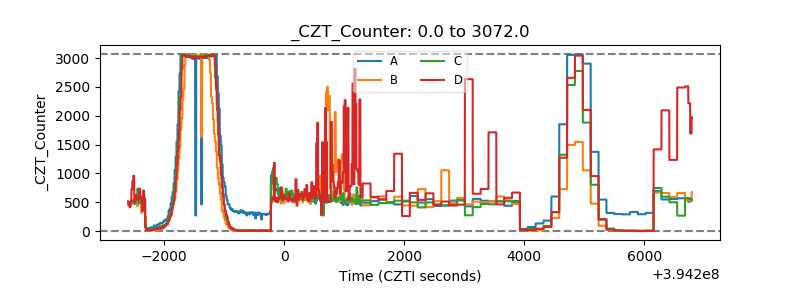 |
| +2.5 Volts monitor | 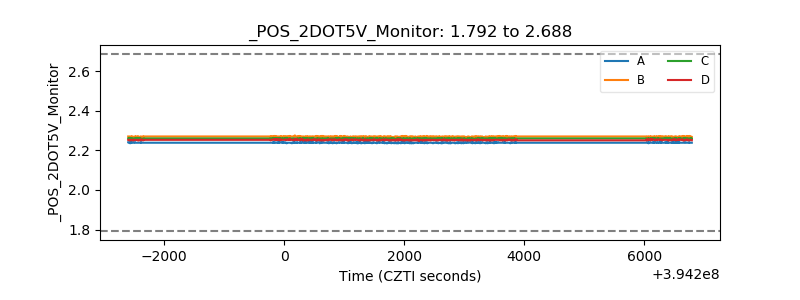 |
| +5 Volts monitor | 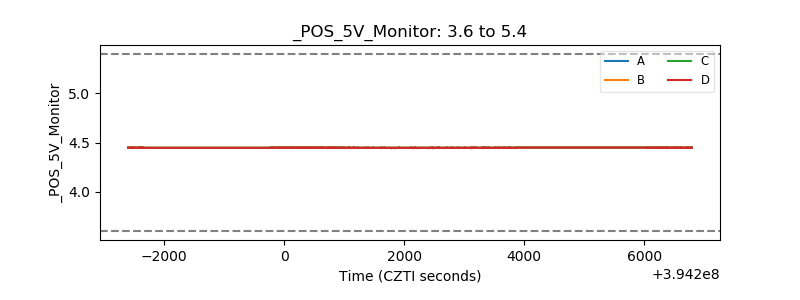 |
| _ROLL_ROT | 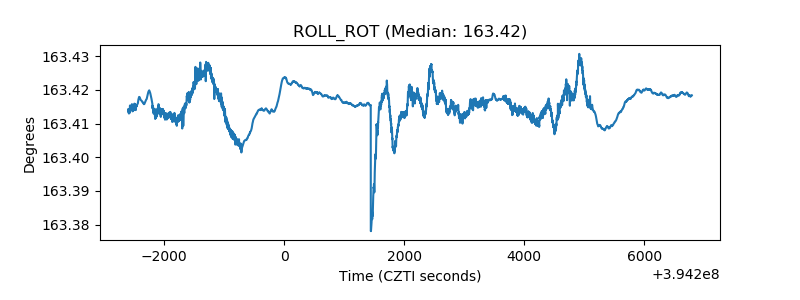 |
| _Roll_DEC | 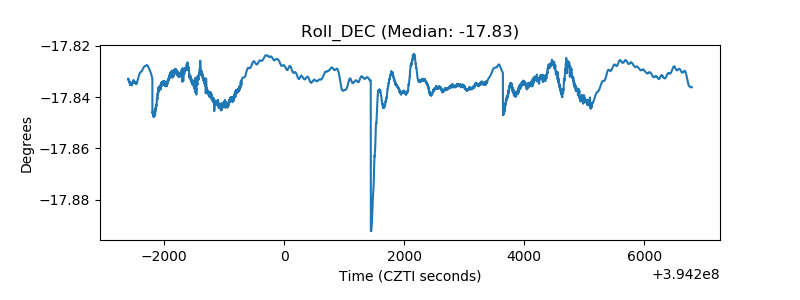 |
| _Roll_RA | 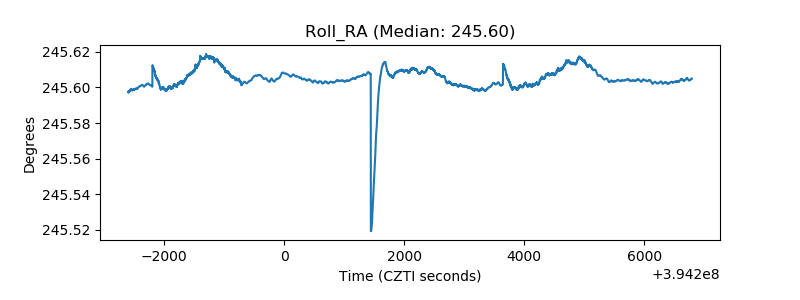 |
| Veto Counter | 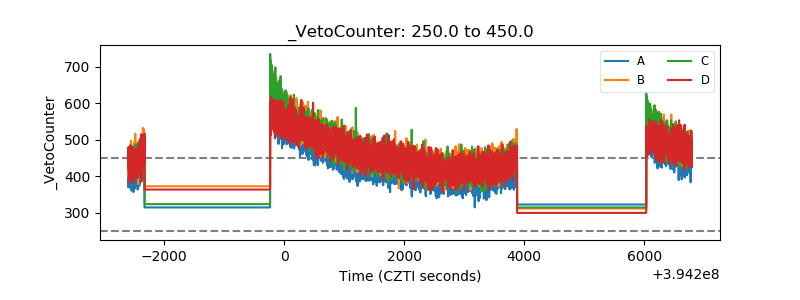 |