| Param | Original file | Final file |
|---|---|---|
| Filename | modeM0/AS1A11_049T05_9000005212_36505cztM0_level2.evt | modeM0/AS1A11_049T05_9000005212_36505cztM0_level2_quad_clean.evt |
| Size (bytes) | 308,882,880 | 53,706,240 |
| Size | 294.6 MB | 51.2 MB |
| Events in quadrant A | 2,022,835 | 349,413 |
| Events in quadrant B | 2,061,471 | 351,796 |
| Events in quadrant C | 1,967,027 | 348,258 |
| Events in quadrant D | 3,058,144 | 322,222 |
| Mode SS | |||
|---|---|---|---|
| Quadrant | BADHDUFLAG | Total packets | Discarded packets |
| A | 0 | 72 | 0 |
| B | 0 | 72 | 0 |
| C | 0 | 72 | 0 |
| D | 0 | 72 | 0 |
| Mode M0 | |||
|---|---|---|---|
| Quadrant | BADHDUFLAG | Total packets | Discarded packets |
| A | 0 | 8121 | 1 |
| B | 0 | 8286 | 1 |
| C | 0 | 7842 | 1 |
| D | 0 | 11409 | 1 |
| Mode M9 | |||
|---|---|---|---|
| Quadrant | BADHDUFLAG | Total packets | Discarded packets |
| A | 0 | 11 | 0 |
| B | 0 | 11 | 0 |
| C | 0 | 11 | 0 |
| D | 0 | 12 | 0 |
| Quadrant | Total seconds | Saturated seconds | Saturation percentage |
|---|---|---|---|
| A | 3591 | 40 | 1.113896% |
| B | 3591 | 41 | 1.141743% |
| C | 3591 | 66 | 1.837928% |
| D | 3591 | 204 | 5.680869% |
Noise dominated data is calculated using 1-second bins in cleaned event files. If a bin has >2000 counts, and if more than 50% of those come from <1% of pixels, then it is considered to be noise-dominated and hence unusable.
| Quadrant | # 1 sec bins | Bins with >0 counts | Bins with >2000 counts | High rate bins dominated by noise | Noise dominated (total time) | Noise dominated (detector-on time) | Marked lightcurve |
|---|---|---|---|---|---|---|---|
| A | 3591 | 3591 | 30 | 30 | 0.84% | 0.84% | 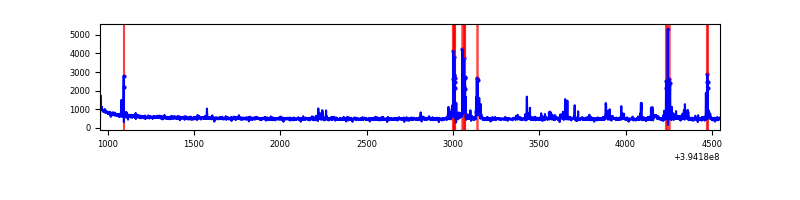 |
| B | 3591 | 3591 | 26 | 26 | 0.72% | 0.72% | 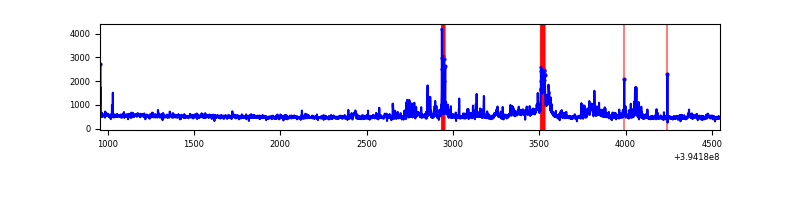 |
| C | 3591 | 3591 | 40 | 40 | 1.11% | 1.11% | 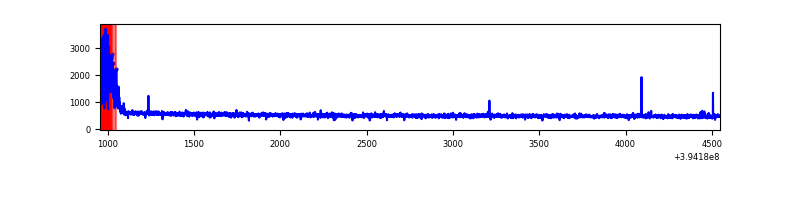 |
| D | 3591 | 3591 | 253 | 253 | 7.05% | 7.05% | 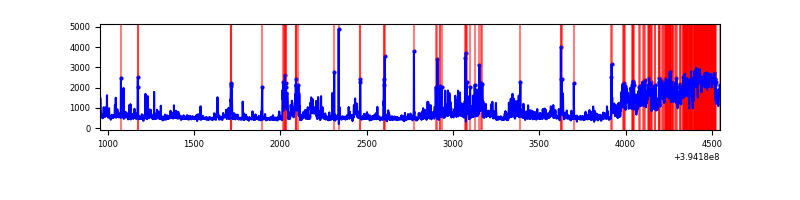 |
Top three noisy pixels from each quadrant. If the there are fewer than three noisy pixels in the level2.evt file, extra rows are filled as -1
| Pixel properties | Quadrant properties | ||||||
|---|---|---|---|---|---|---|---|
| Quadrant | DetID | PixID | Counts | Sigma | Mean | Median | Sigma |
| A | 7 | 3 | 191707 | 2152.14 | 439 | 432 | 88.9 |
| A | 10 | 83 | 113641 | 1273.78 | 439 | 432 | 88.9 |
| A | 9 | 143 | 13971 | 152.33 | 439 | 432 | 88.9 |
| B | 5 | 172 | 247488 | 2966.38 | 431 | 420 | 83.3 |
| B | 0 | 189 | 70279 | 838.75 | 431 | 420 | 83.3 |
| B | 5 | 255 | 12351 | 143.25 | 431 | 420 | 83.3 |
| C | 0 | 10 | 160151 | 1623.21 | 422 | 424 | 98.4 |
| C | 15 | 214 | 151907 | 1539.44 | 422 | 424 | 98.4 |
| C | 15 | 159 | 2932 | 25.49 | 422 | 424 | 98.4 |
| D | 12 | 227 | 687679 | 6658.37 | 423 | 412 | 103.2 |
| D | 1 | 20 | 396679 | 3839.11 | 423 | 412 | 103.2 |
| D | 13 | 249 | 103177 | 995.61 | 423 | 412 | 103.2 |
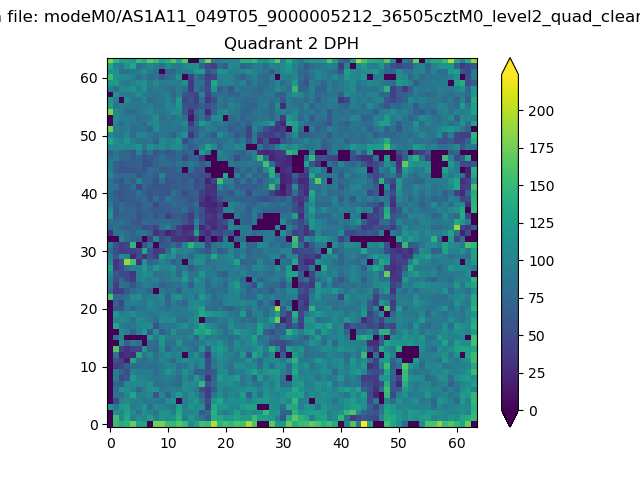
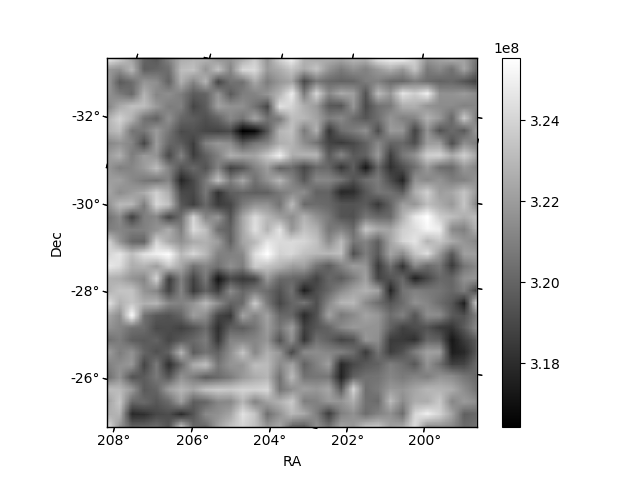
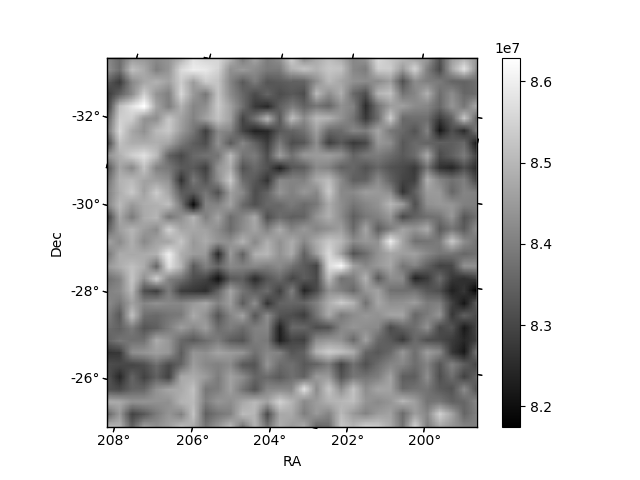
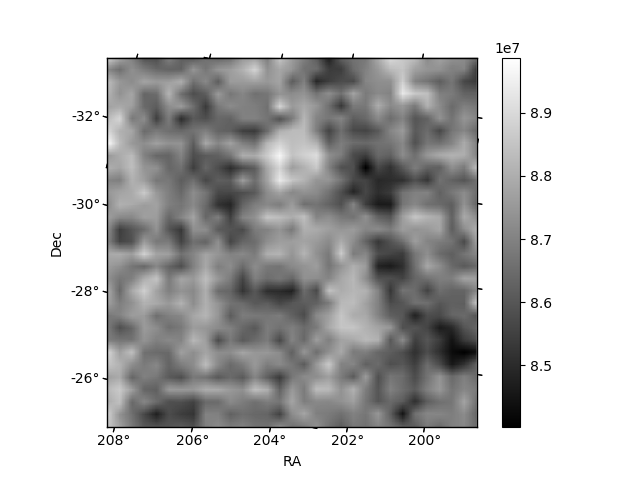
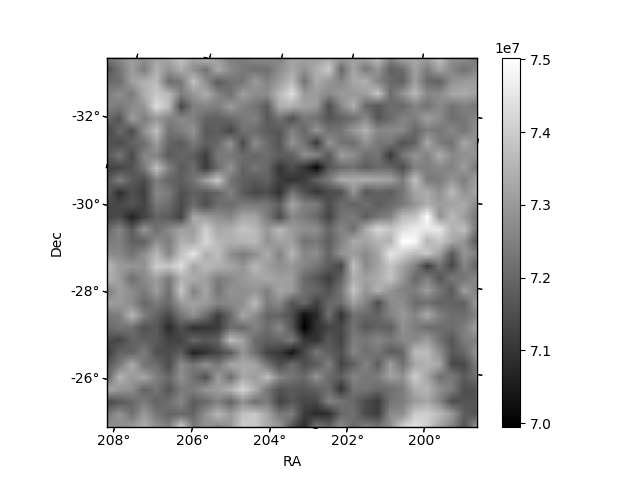
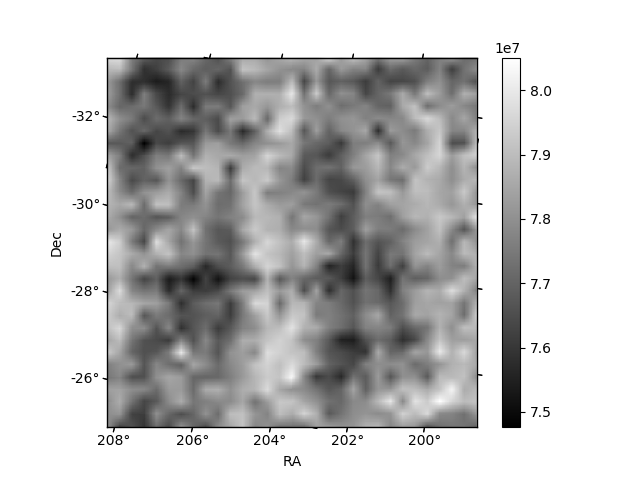
Histogram calculated using DETX and DETY for each event in the final _common_clean file
| Quadrant A | 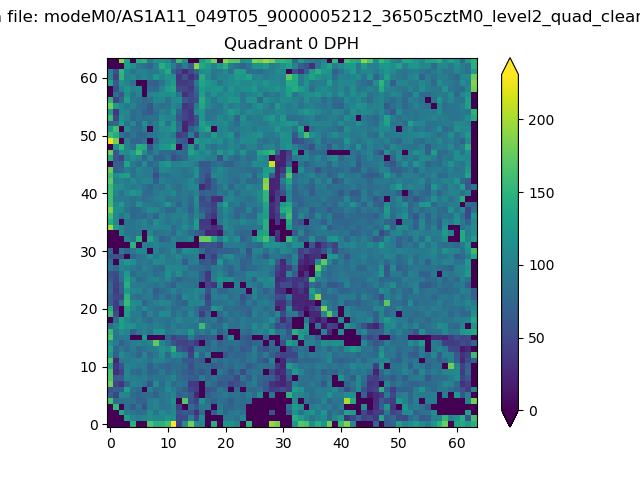 |
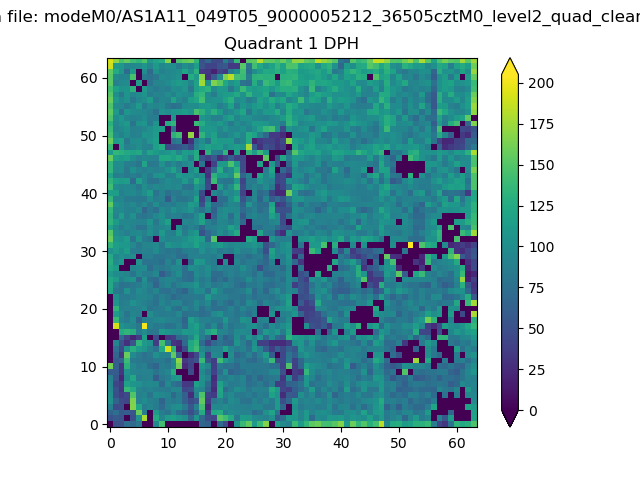 |
Quadrant B |
|---|---|---|---|
| Quadrant D | 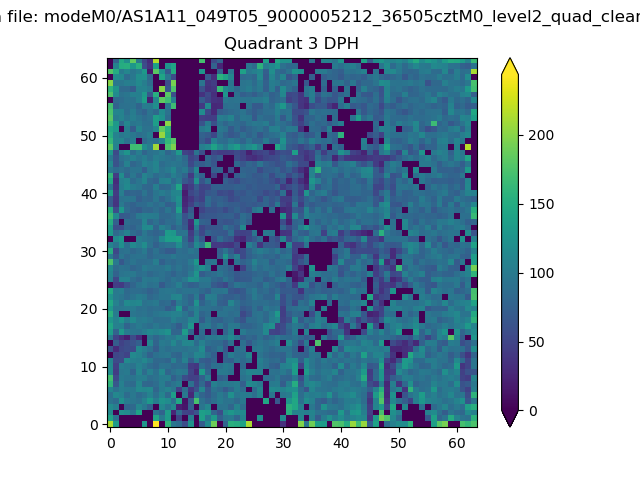 |
 |
Quadrant C |
| Plot type | Count rate plots | Images |
|---|---|---|
| Comparison with Poisson distribution Blue bars denote a histogram of data divided into 1 sec bins. Red curve is a Poisson curve with rate = median count rate of data. |
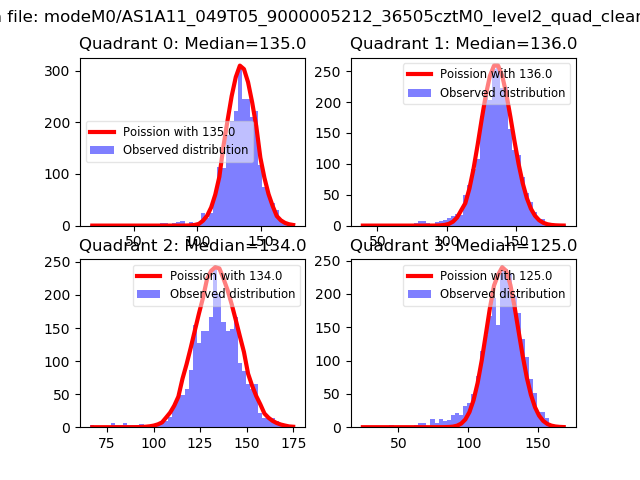 |
 |
| Quadrant-wise count rates Data is divided into 100 sec bins |
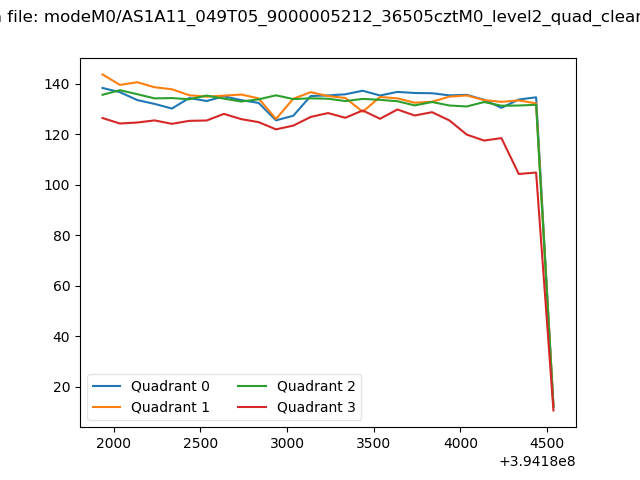 |
|
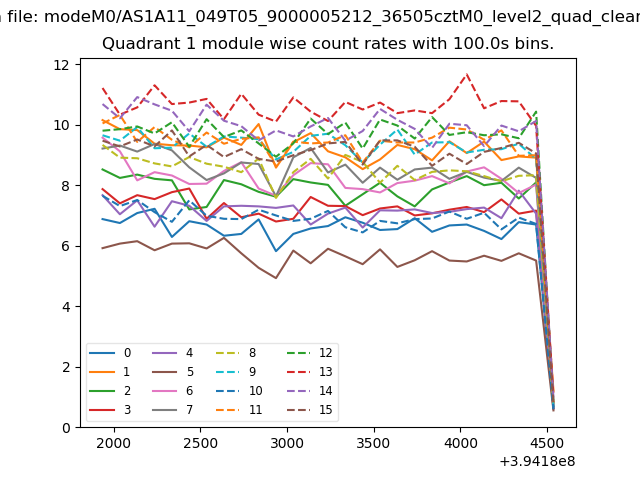
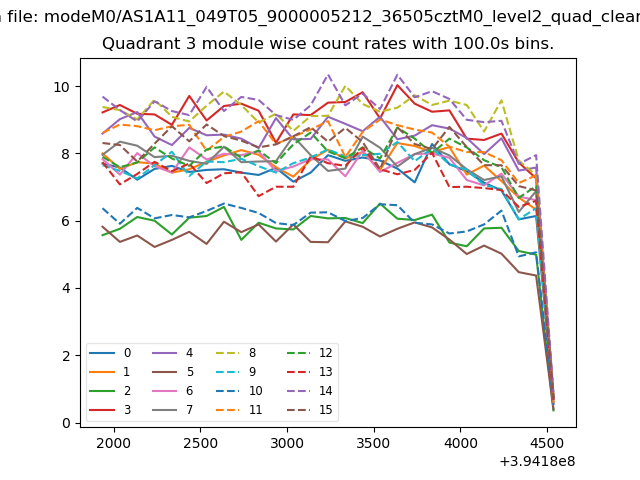
| Module-wise count rates for Quadrant A Data is divided into 100 sec bins |
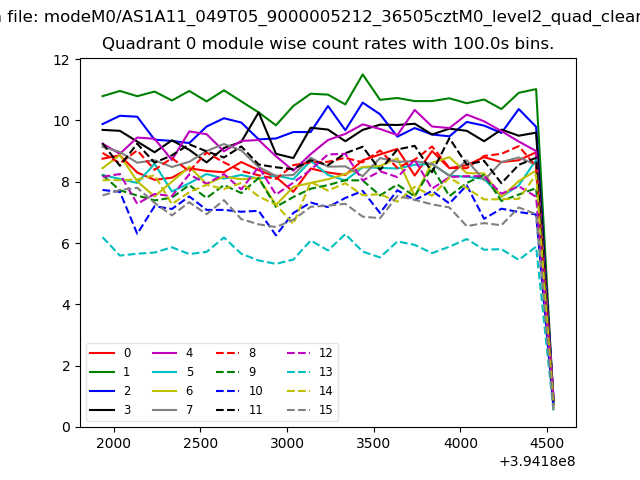 |
 |
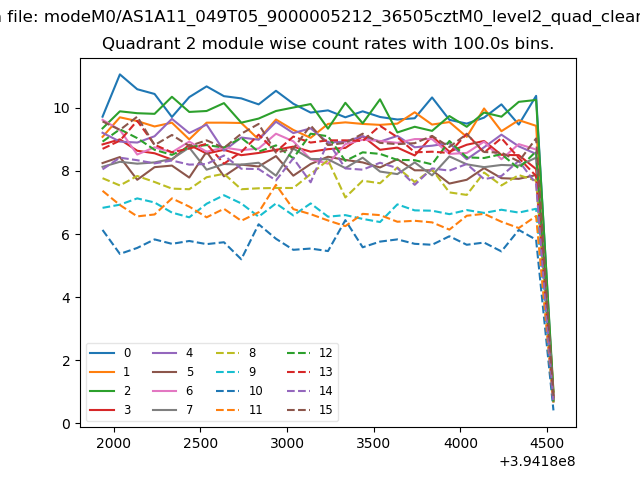
| Module-wise count rates for Quadrant B Data is divided into 100 sec bins |
 |
 |
| Module-wise count rates for Quadrant C Data is divided into 100 sec bins |
 |
 |
| Module-wise count rates for Quadrant D Data is divided into 100 sec bins |
 |
 |
| Parameter | Plot |
|---|---|
| CZT HV Monitor | 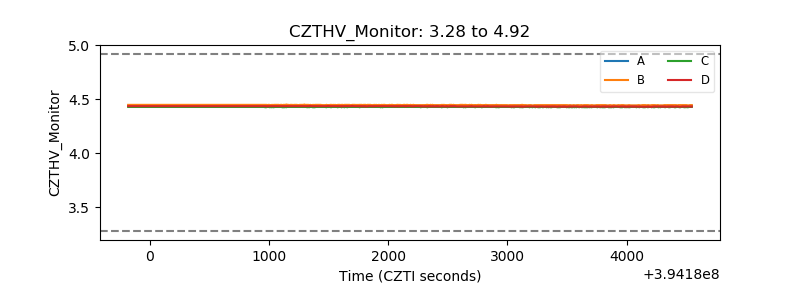 |
| D_VDD | 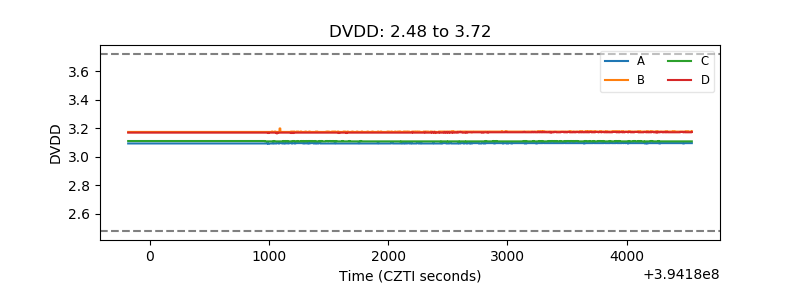 |
| Temperature 1 | 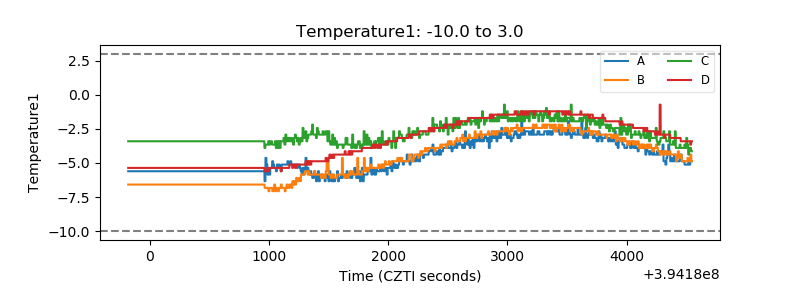 |
| Veto HV Monitor | 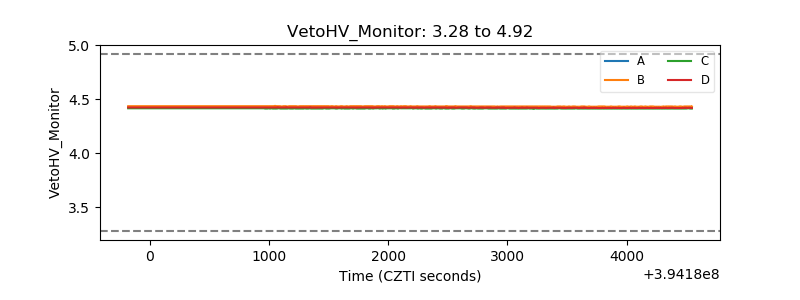 |
| Veto LLD | 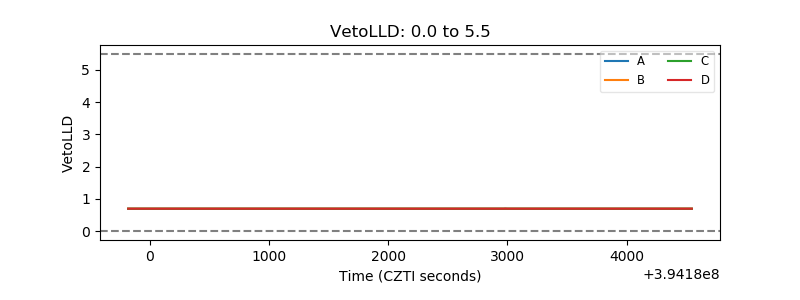 |
| Alpha Counter | 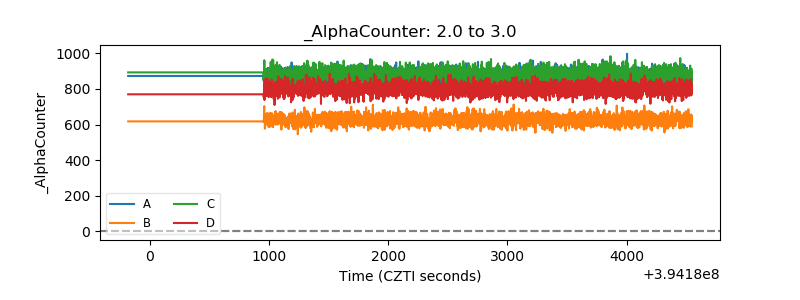 |
| _CPM_Rate | 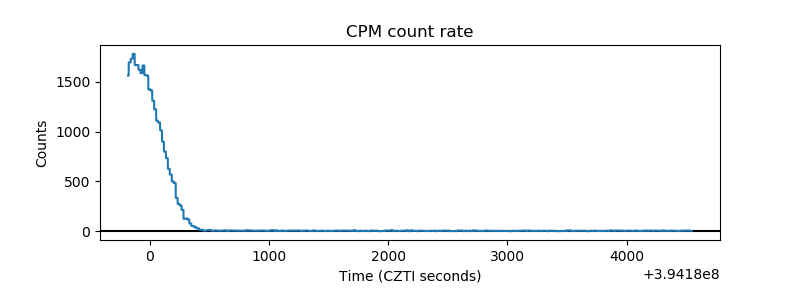 |
| CZT Counter | 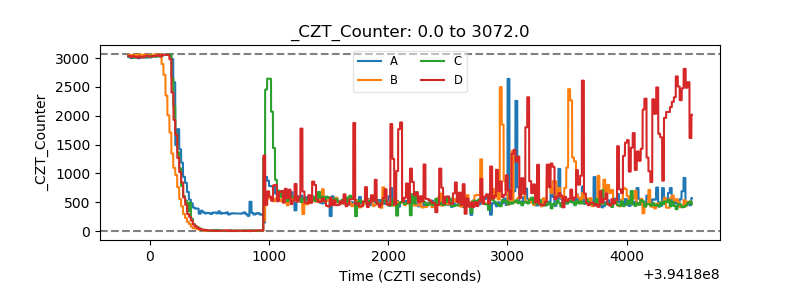 |
| +2.5 Volts monitor | 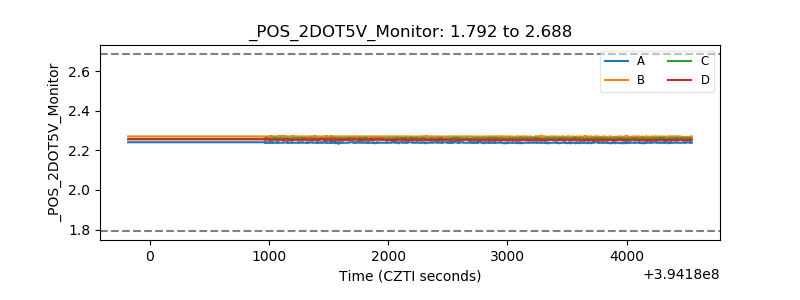 |
| +5 Volts monitor | 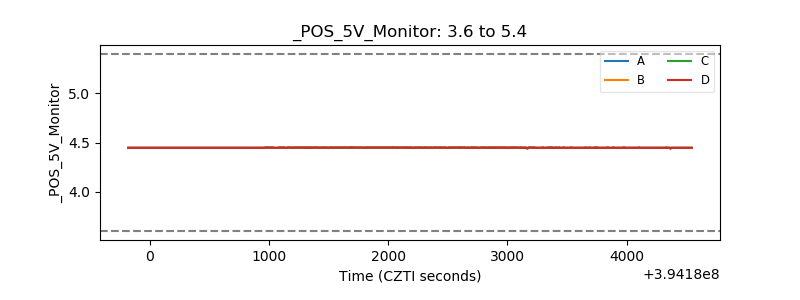 |
| _ROLL_ROT | 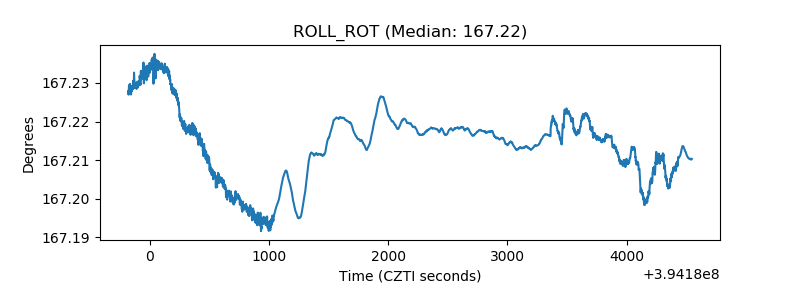 |
| _Roll_DEC | 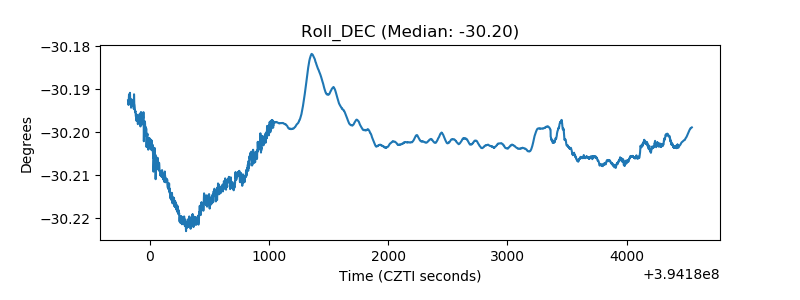 |
| _Roll_RA | 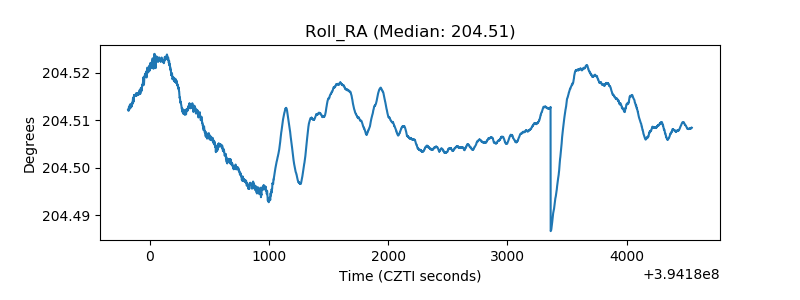 |
| Veto Counter | 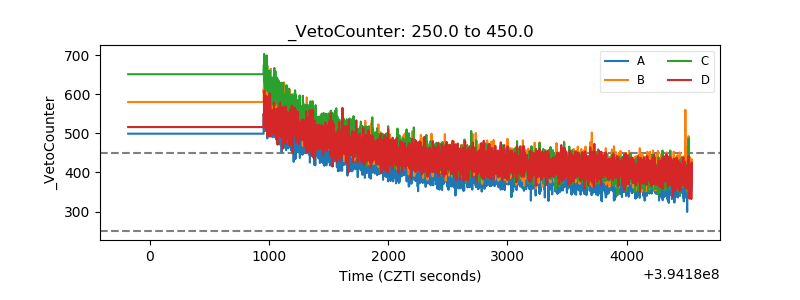 |