| Param | Original file | Final file |
|---|---|---|
| Filename | modeM0/AS1A11_049T05_9000005212_36501cztM0_level2.evt | modeM0/AS1A11_049T05_9000005212_36501cztM0_level2_quad_clean.evt |
| Size (bytes) | 1,265,169,600 | 179,144,640 |
| Size | 1.2 GB | 170.8 MB |
| Events in quadrant A | 7,750,880 | 1,112,678 |
| Events in quadrant B | 10,203,932 | 1,088,375 |
| Events in quadrant C | 8,129,579 | 1,082,845 |
| Events in quadrant D | 11,151,607 | 1,037,893 |
| Mode SS | |||
|---|---|---|---|
| Quadrant | BADHDUFLAG | Total packets | Discarded packets |
| A | 0 | 330 | 0 |
| B | 0 | 330 | 0 |
| C | 0 | 330 | 0 |
| D | 0 | 330 | 0 |
| Mode M0 | |||
|---|---|---|---|
| Quadrant | BADHDUFLAG | Total packets | Discarded packets |
| A | 0 | 33149 | 5 |
| B | 0 | 41111 | 4 |
| C | 0 | 33725 | 4 |
| D | 0 | 44022 | 4 |
| Mode M9 | |||
|---|---|---|---|
| Quadrant | BADHDUFLAG | Total packets | Discarded packets |
| A | 0 | 54 | 0 |
| B | 0 | 54 | 0 |
| C | 0 | 54 | 0 |
| D | 0 | 54 | 0 |
| Quadrant | Total seconds | Saturated seconds | Saturation percentage |
|---|---|---|---|
| A | 15989 | 37 | 0.231409% |
| B | 15989 | 512 | 3.202202% |
| C | 15989 | 115 | 0.719244% |
| D | 15989 | 604 | 3.777597% |
Noise dominated data is calculated using 1-second bins in cleaned event files. If a bin has >2000 counts, and if more than 50% of those come from <1% of pixels, then it is considered to be noise-dominated and hence unusable.
| Quadrant | # 1 sec bins | Bins with >0 counts | Bins with >2000 counts | High rate bins dominated by noise | Noise dominated (total time) | Noise dominated (detector-on time) | Marked lightcurve |
|---|---|---|---|---|---|---|---|
| A | 21510 | 15993 | 14 | 14 | 0.07% | 0.09% | 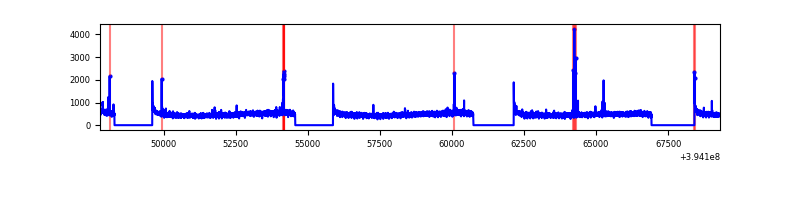 |
| B | 21510 | 15993 | 269 | 269 | 1.25% | 1.68% | 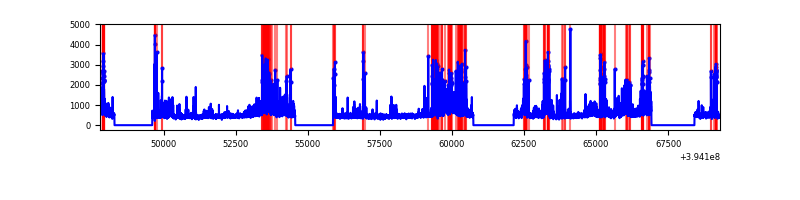 |
| C | 21510 | 15993 | 71 | 71 | 0.33% | 0.44% | 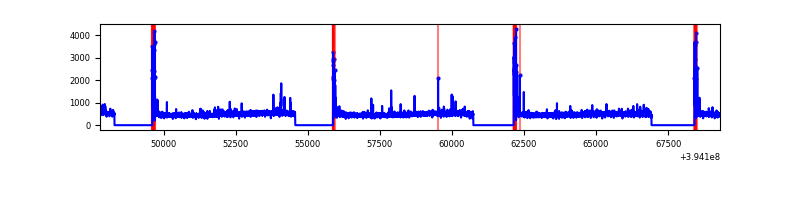 |
| D | 21510 | 15993 | 482 | 482 | 2.24% | 3.01% | 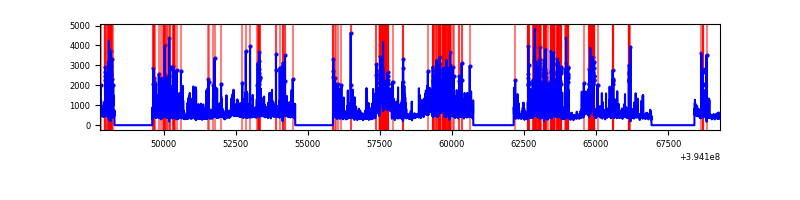 |
Top three noisy pixels from each quadrant. If the there are fewer than three noisy pixels in the level2.evt file, extra rows are filled as -1
| Pixel properties | Quadrant properties | ||||||
|---|---|---|---|---|---|---|---|
| Quadrant | DetID | PixID | Counts | Sigma | Mean | Median | Sigma |
| A | 10 | 83 | 496906 | 1343.66 | 1838 | 1801 | 368.5 |
| A | 15 | 223 | 59471 | 156.51 | 1838 | 1801 | 368.5 |
| A | 9 | 143 | 38778 | 100.35 | 1838 | 1801 | 368.5 |
| B | 5 | 172 | 1503863 | 4372.74 | 1800 | 1749 | 343.5 |
| B | 0 | 189 | 637452 | 1850.57 | 1800 | 1749 | 343.5 |
| B | 5 | 255 | 407874 | 1182.25 | 1800 | 1749 | 343.5 |
| C | 15 | 214 | 681072 | 1670.41 | 1768 | 1780 | 406.7 |
| C | 0 | 10 | 506905 | 1242.13 | 1768 | 1780 | 406.7 |
| C | 0 | 246 | 12376 | 26.06 | 1768 | 1780 | 406.7 |
| D | 12 | 227 | 2493905 | 5867.57 | 1760 | 1713 | 424.7 |
| D | 13 | 249 | 539177 | 1265.4 | 1760 | 1713 | 424.7 |
| D | 2 | 153 | 513645 | 1205.28 | 1760 | 1713 | 424.7 |
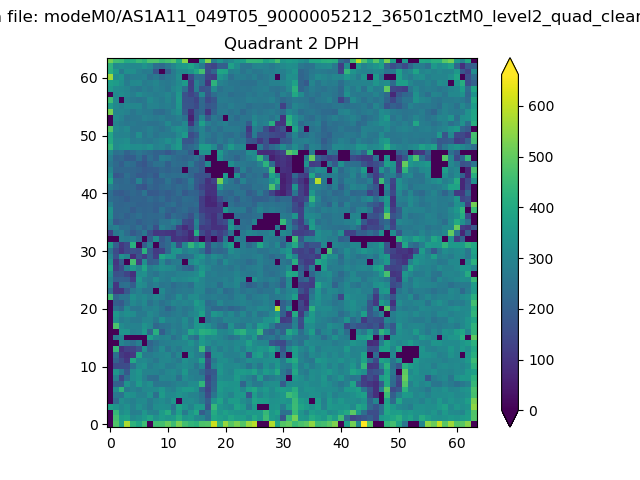
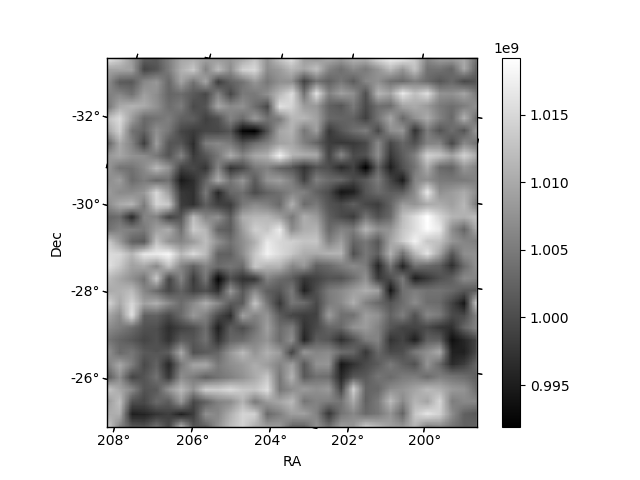
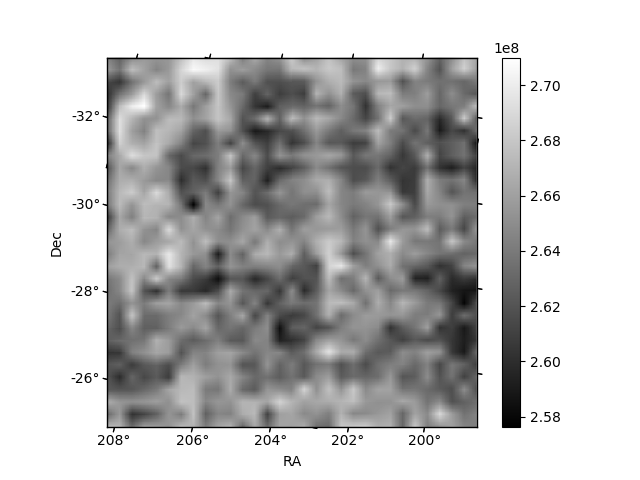
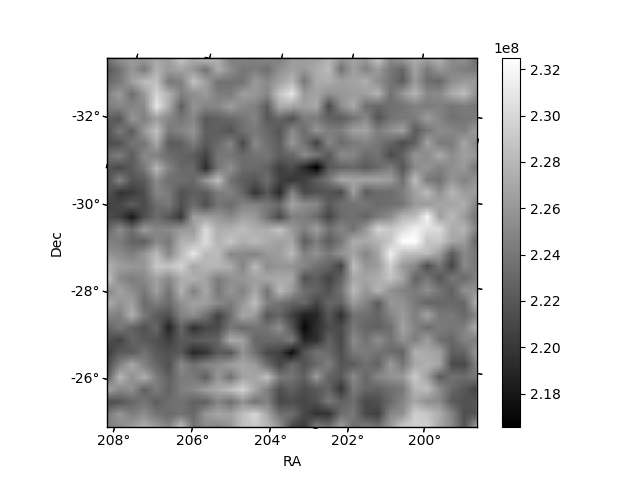
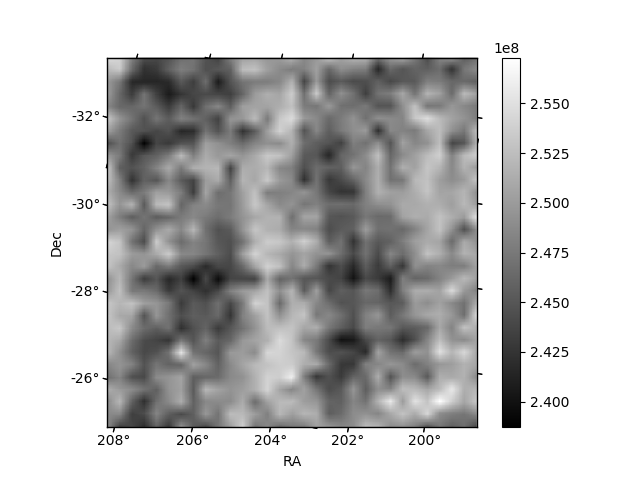
Histogram calculated using DETX and DETY for each event in the final _common_clean file
| Quadrant A | 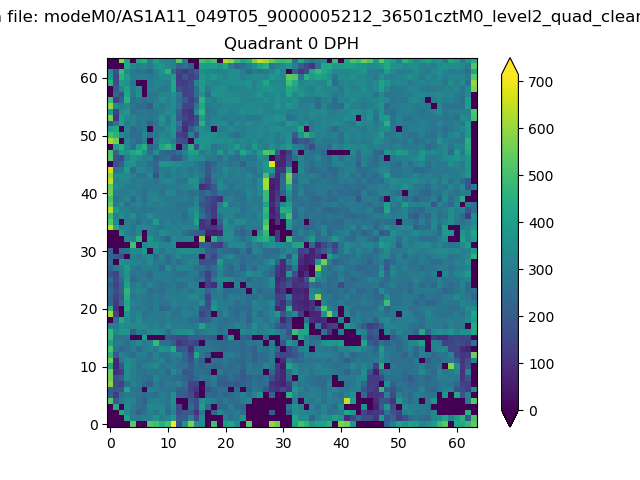 |
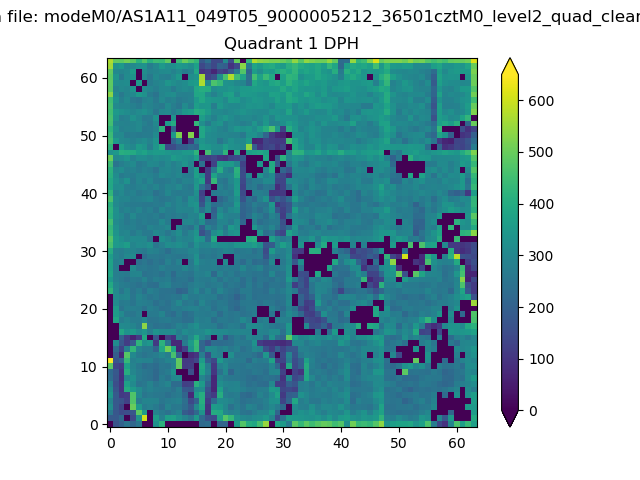 |
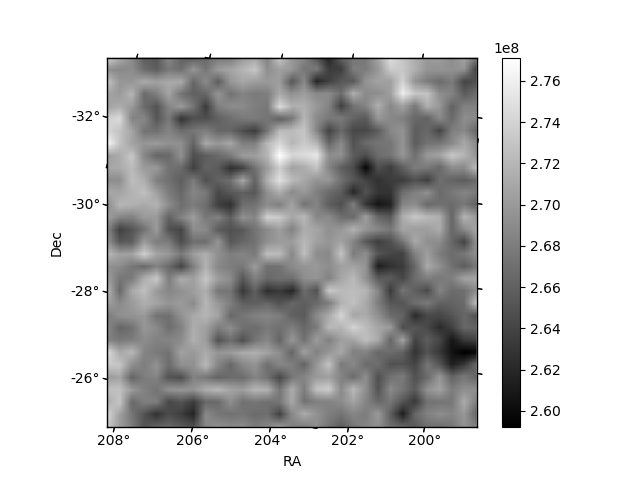
Quadrant B |
|---|---|---|---|
| Quadrant D | 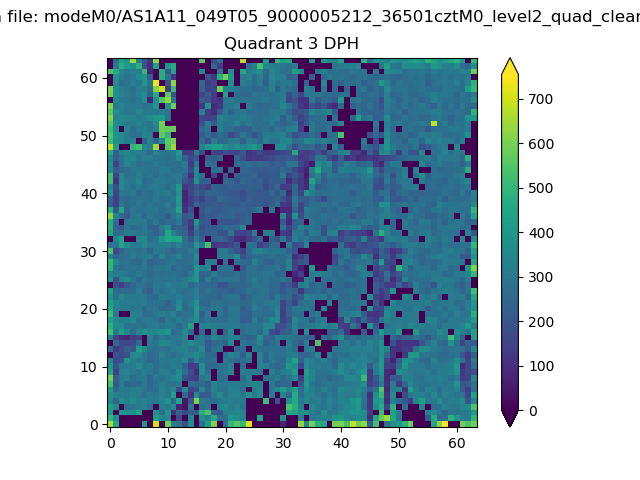 |
 |
Quadrant C |
| Plot type | Count rate plots | Images |
|---|---|---|
| Comparison with Poisson distribution Blue bars denote a histogram of data divided into 1 sec bins. Red curve is a Poisson curve with rate = median count rate of data. |
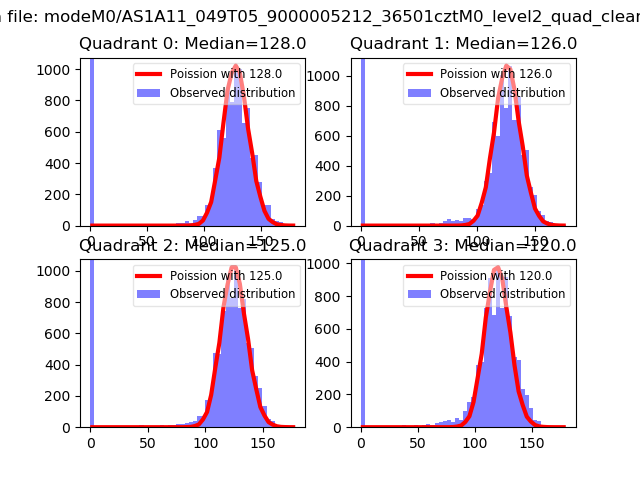 |
 |
| Quadrant-wise count rates Data is divided into 100 sec bins |
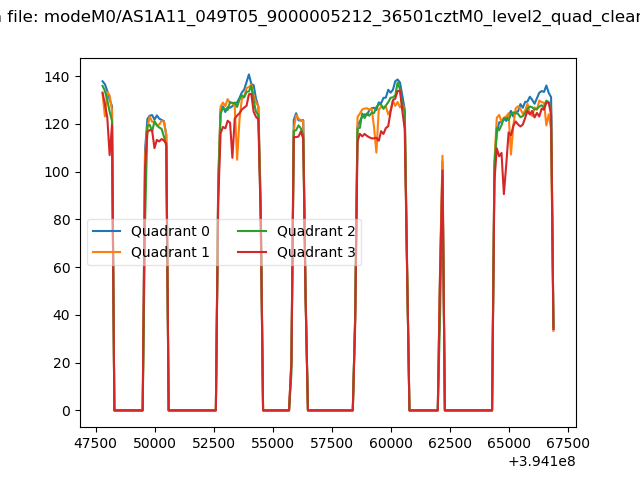 |
|
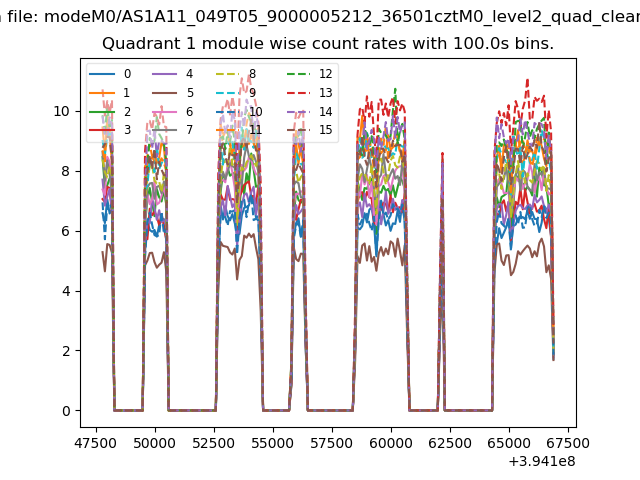
| Module-wise count rates for Quadrant A Data is divided into 100 sec bins |
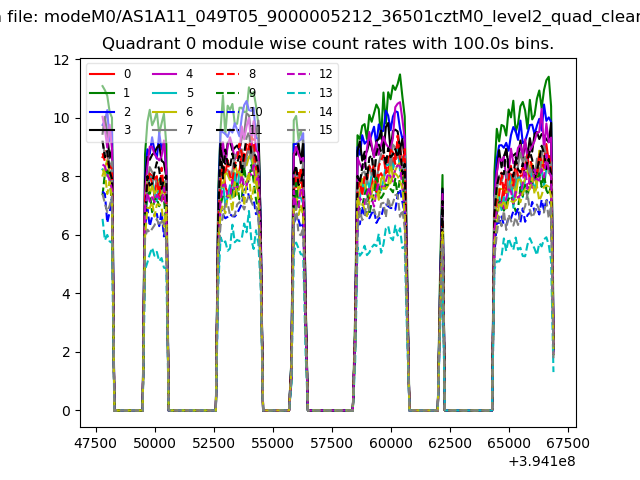 |
 |
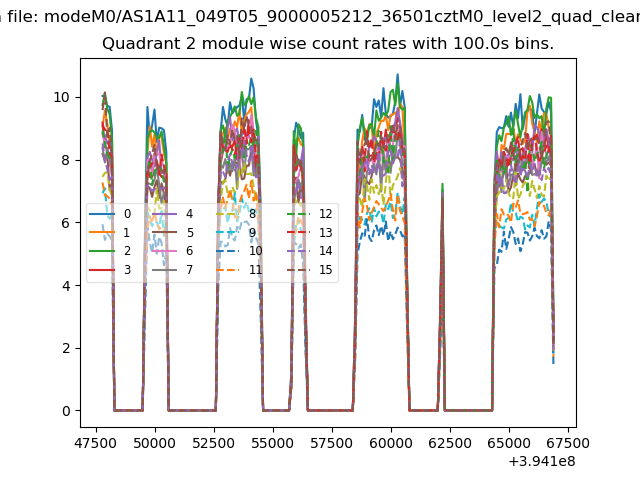
| Module-wise count rates for Quadrant B Data is divided into 100 sec bins |
 |
 |
| Module-wise count rates for Quadrant C Data is divided into 100 sec bins |
 |
 |
| Module-wise count rates for Quadrant D Data is divided into 100 sec bins |
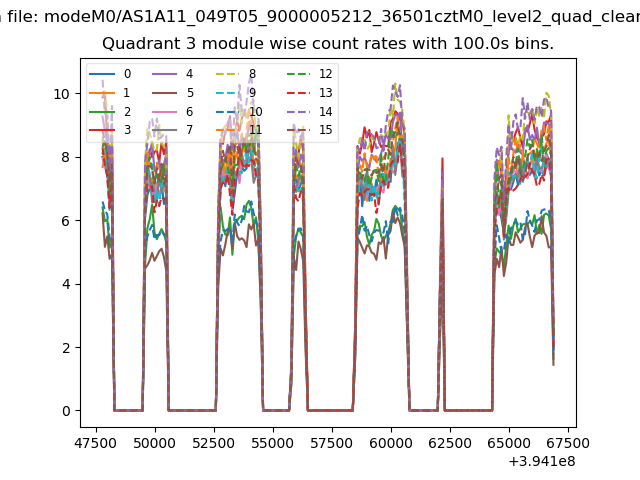 |
 |
| Parameter | Plot |
|---|---|
| CZT HV Monitor | 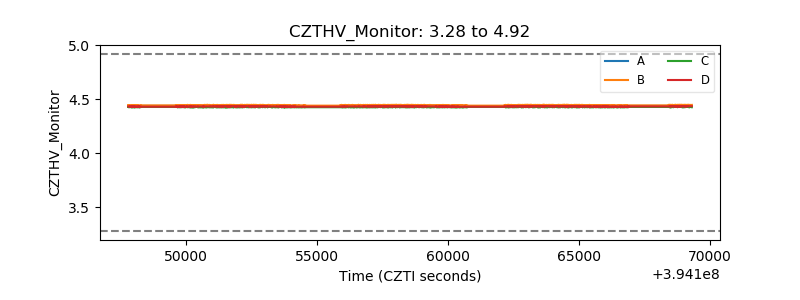 |
| D_VDD |  |
| Temperature 1 | 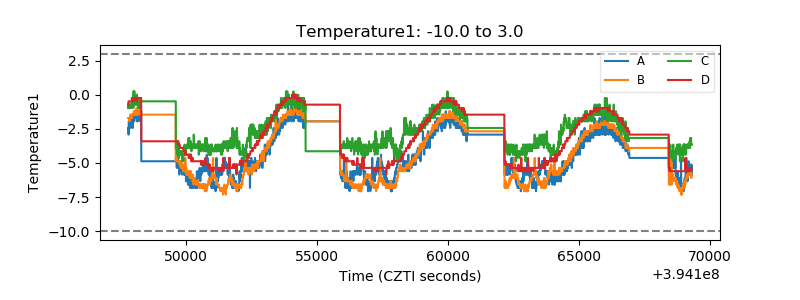 |
| Veto HV Monitor | 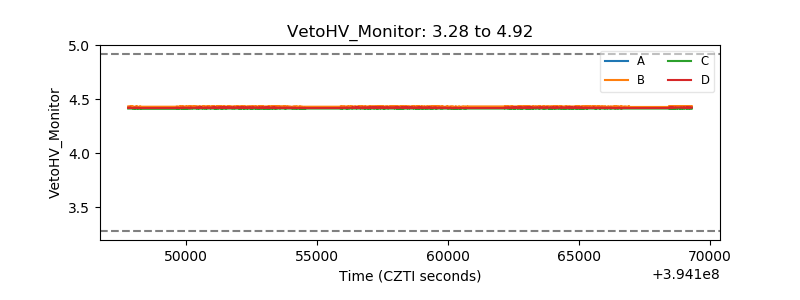 |
| Veto LLD | 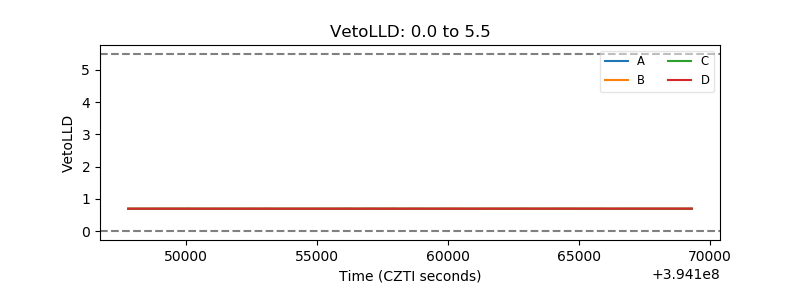 |
| Alpha Counter | 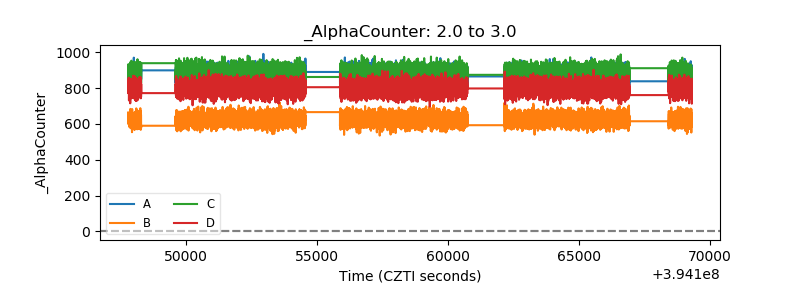 |
| _CPM_Rate | 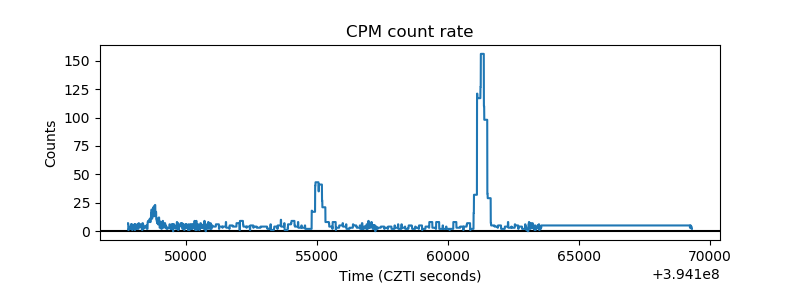 |
| CZT Counter | 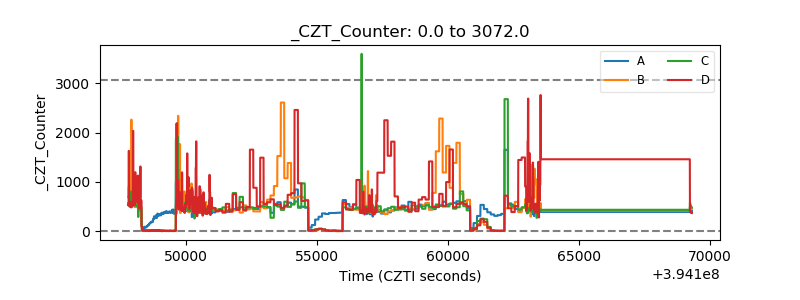 |
| +2.5 Volts monitor | 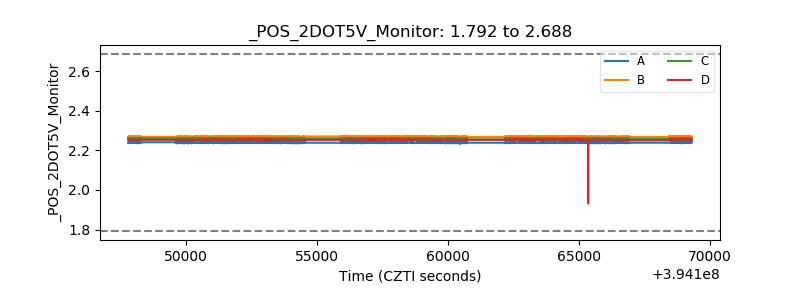 |
| +5 Volts monitor | 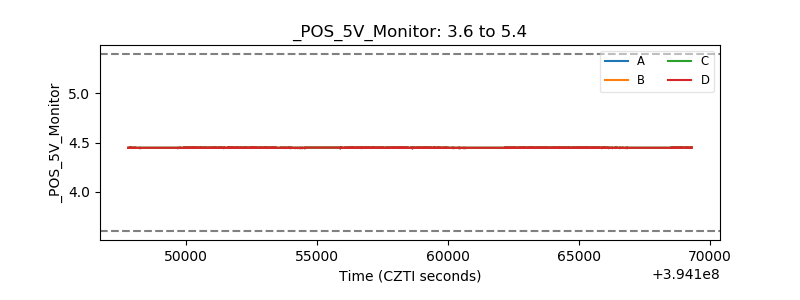 |
| _ROLL_ROT | 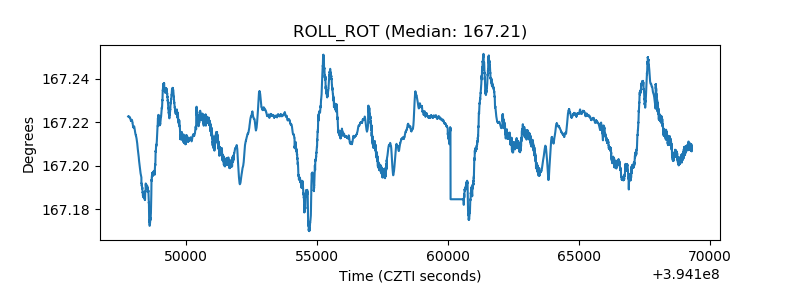 |
| _Roll_DEC | 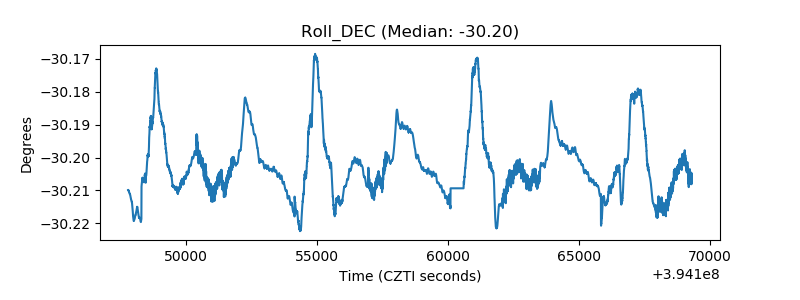 |
| _Roll_RA | 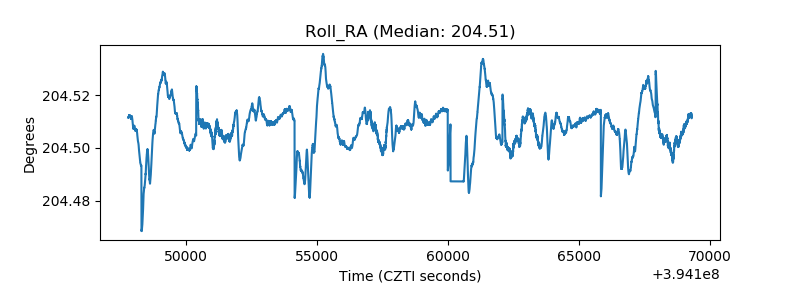 |
| Veto Counter | 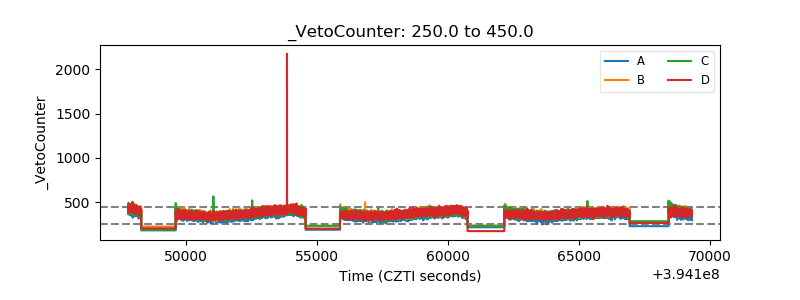 |