| Param | Original file | Final file |
|---|---|---|
| Filename | modeM0/AS1A11_049T05_9000005212_36498cztM0_level2.evt | modeM0/AS1A11_049T05_9000005212_36498cztM0_level2_quad_clean.evt |
| Size (bytes) | 485,435,520 | 79,657,920 |
| Size | 462.9 MB | 76.0 MB |
| Events in quadrant A | 3,027,486 | 508,914 |
| Events in quadrant B | 3,505,201 | 502,324 |
| Events in quadrant C | 3,293,578 | 492,066 |
| Events in quadrant D | 4,454,498 | 476,018 |
| Mode SS | |||
|---|---|---|---|
| Quadrant | BADHDUFLAG | Total packets | Discarded packets |
| A | 0 | 128 | 0 |
| B | 0 | 128 | 0 |
| C | 0 | 128 | 0 |
| D | 0 | 128 | 0 |
| Mode M0 | |||
|---|---|---|---|
| Quadrant | BADHDUFLAG | Total packets | Discarded packets |
| A | 0 | 12997 | 3 |
| B | 0 | 14518 | 2 |
| C | 0 | 13660 | 2 |
| D | 0 | 17560 | 2 |
| Mode M9 | |||
|---|---|---|---|
| Quadrant | BADHDUFLAG | Total packets | Discarded packets |
| A | 0 | 27 | 0 |
| B | 0 | 27 | 0 |
| C | 0 | 27 | 0 |
| D | 0 | 27 | 0 |
| Quadrant | Total seconds | Saturated seconds | Saturation percentage |
|---|---|---|---|
| A | 6197 | 13 | 0.209779% |
| B | 6197 | 149 | 2.404389% |
| C | 6197 | 85 | 1.371631% |
| D | 6197 | 385 | 6.212684% |
Noise dominated data is calculated using 1-second bins in cleaned event files. If a bin has >2000 counts, and if more than 50% of those come from <1% of pixels, then it is considered to be noise-dominated and hence unusable.
| Quadrant | # 1 sec bins | Bins with >0 counts | Bins with >2000 counts | High rate bins dominated by noise | Noise dominated (total time) | Noise dominated (detector-on time) | Marked lightcurve |
|---|---|---|---|---|---|---|---|
| A | 8912 | 6199 | 5 | 5 | 0.06% | 0.08% | 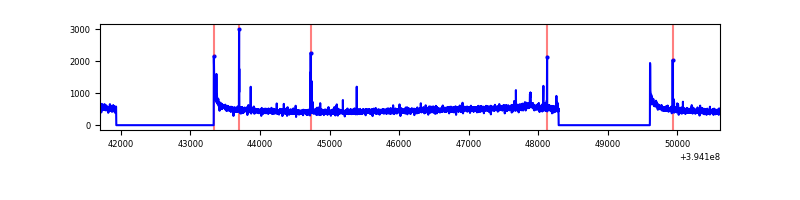 |
| B | 8912 | 6199 | 82 | 82 | 0.92% | 1.32% | 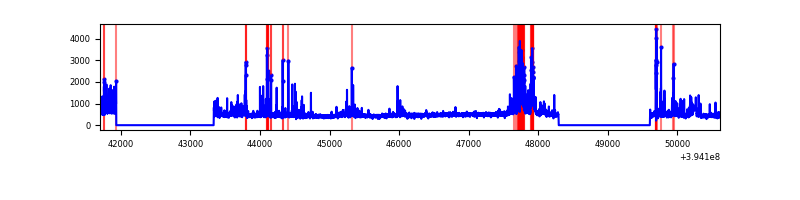 |
| C | 8912 | 6199 | 68 | 68 | 0.76% | 1.10% | 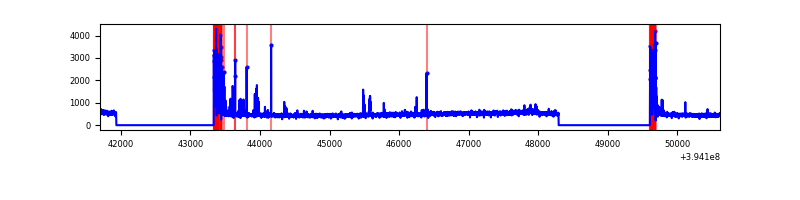 |
| D | 8912 | 6199 | 416 | 416 | 4.67% | 6.71% | 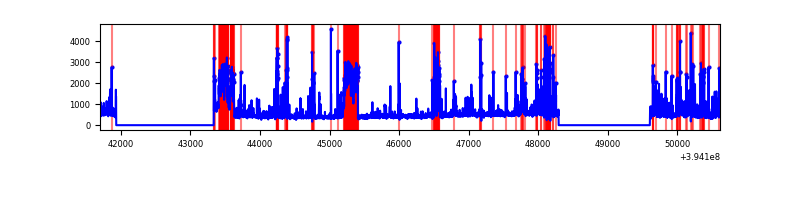 |
Top three noisy pixels from each quadrant. If the there are fewer than three noisy pixels in the level2.evt file, extra rows are filled as -1
| Pixel properties | Quadrant properties | ||||||
|---|---|---|---|---|---|---|---|
| Quadrant | DetID | PixID | Counts | Sigma | Mean | Median | Sigma |
| A | 10 | 83 | 215434 | 1499.84 | 706 | 694 | 143.2 |
| A | 15 | 223 | 38067 | 261.03 | 706 | 694 | 143.2 |
| A | 7 | 3 | 17991 | 120.81 | 706 | 694 | 143.2 |
| B | 5 | 172 | 369855 | 2772.11 | 694 | 677 | 133.2 |
| B | 5 | 255 | 180465 | 1350.01 | 694 | 677 | 133.2 |
| B | 0 | 214 | 47788 | 353.75 | 694 | 677 | 133.2 |
| C | 0 | 10 | 363644 | 2273.28 | 677 | 683 | 159.7 |
| C | 15 | 214 | 263357 | 1645.17 | 677 | 683 | 159.7 |
| C | 0 | 246 | 14201 | 84.67 | 677 | 683 | 159.7 |
| D | 12 | 227 | 838766 | 5078.54 | 672 | 653 | 165.0 |
| D | 2 | 153 | 287537 | 1738.37 | 672 | 653 | 165.0 |
| D | 2 | 250 | 198176 | 1196.89 | 672 | 653 | 165.0 |
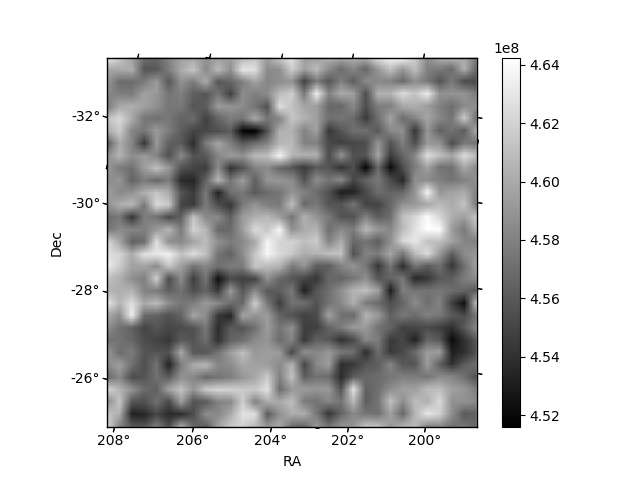
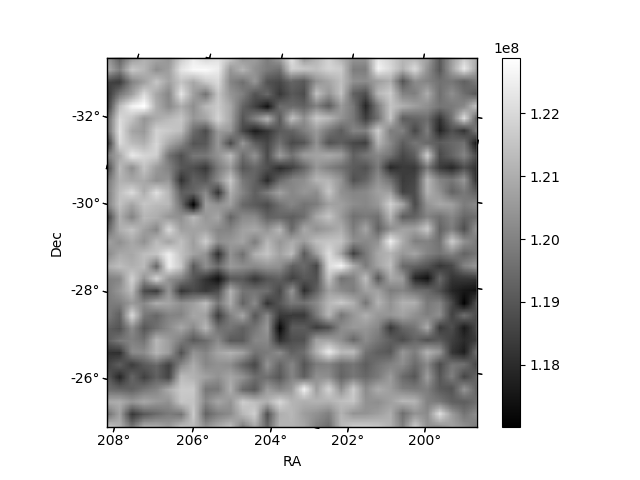
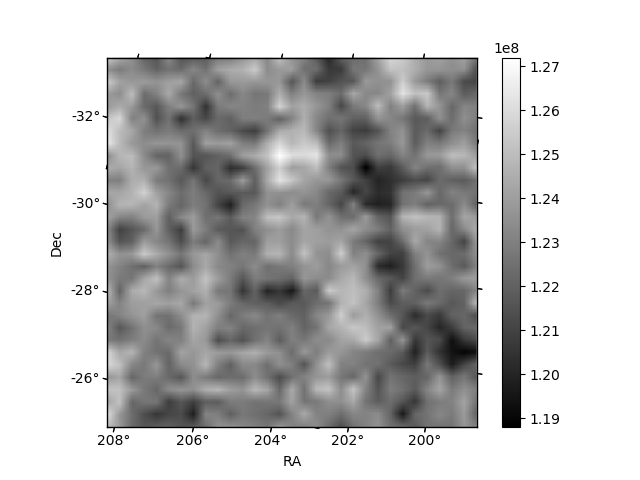
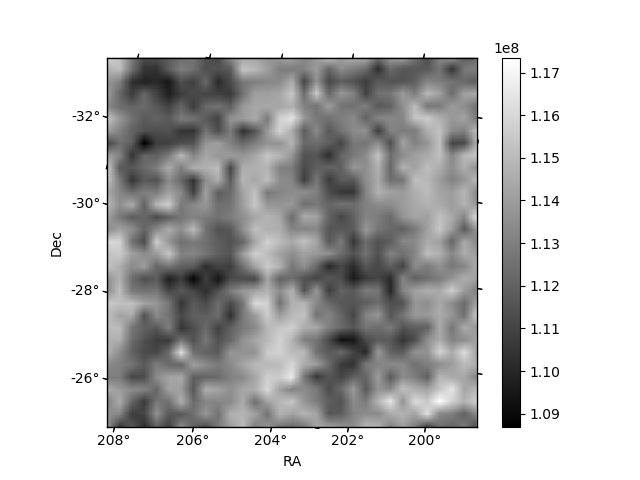
Histogram calculated using DETX and DETY for each event in the final _common_clean file
| Quadrant A | 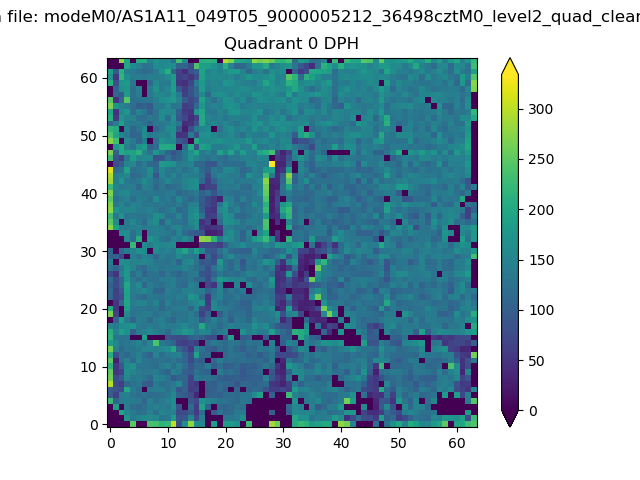 |
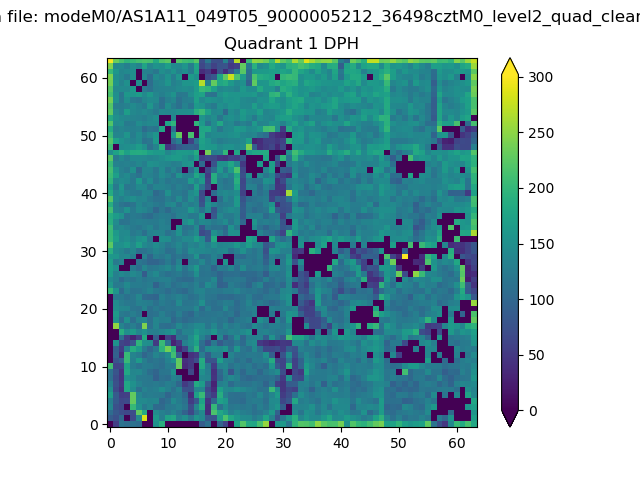 |
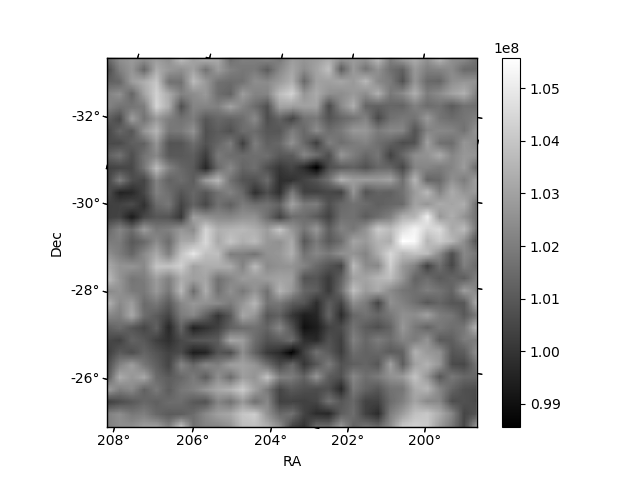
Quadrant B |
|---|---|---|---|
| Quadrant D | 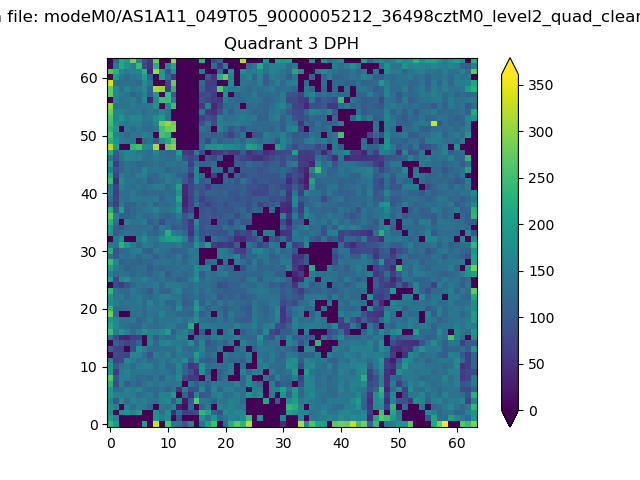 |
 |
Quadrant C |
| Plot type | Count rate plots | Images |
|---|---|---|
| Comparison with Poisson distribution Blue bars denote a histogram of data divided into 1 sec bins. Red curve is a Poisson curve with rate = median count rate of data. |
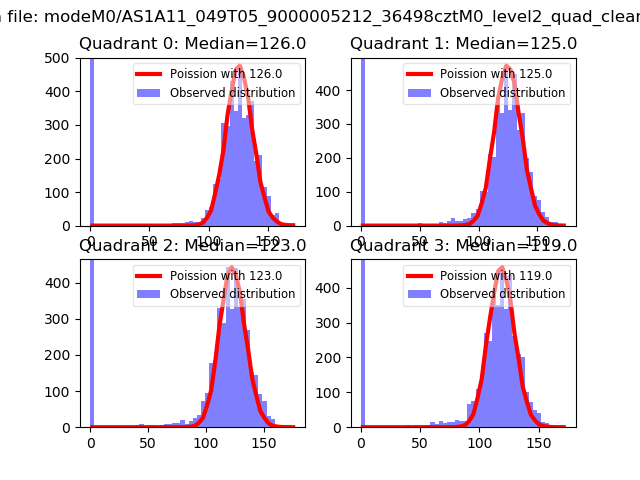 |
 |
| Quadrant-wise count rates Data is divided into 100 sec bins |
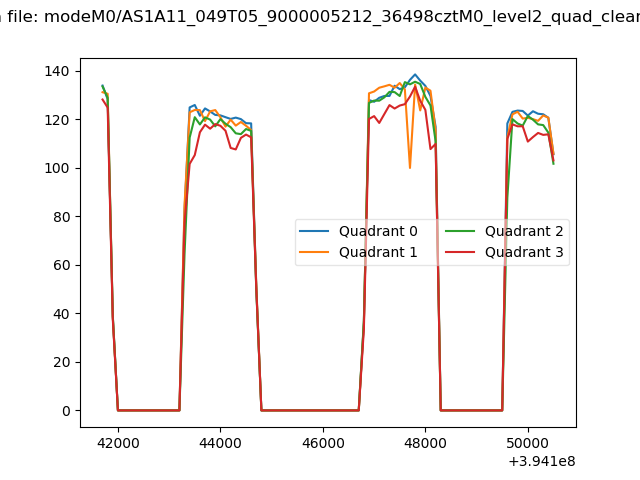 |
|
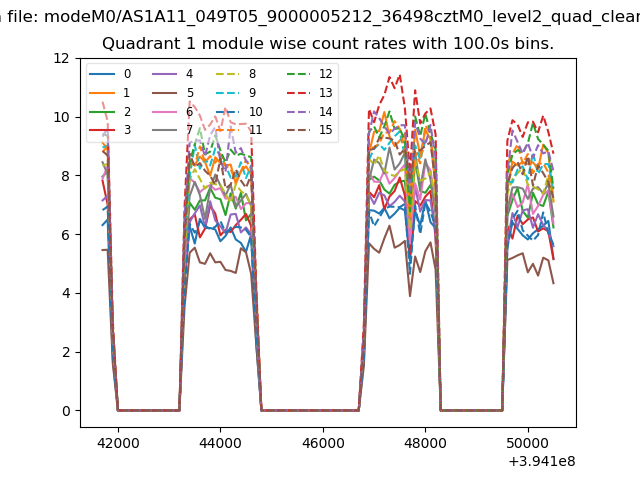
| Module-wise count rates for Quadrant A Data is divided into 100 sec bins |
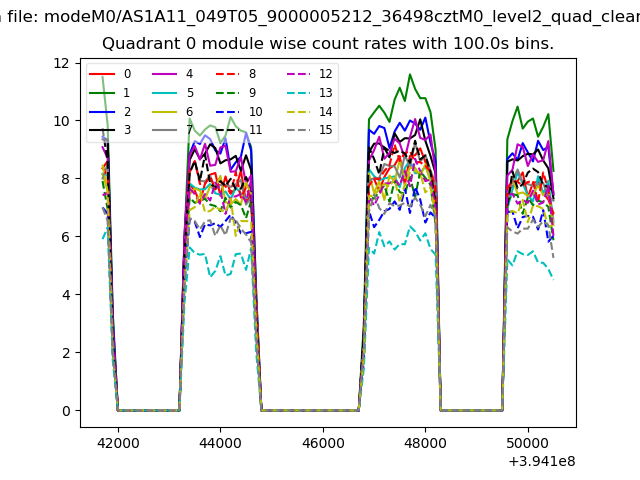 |
 |
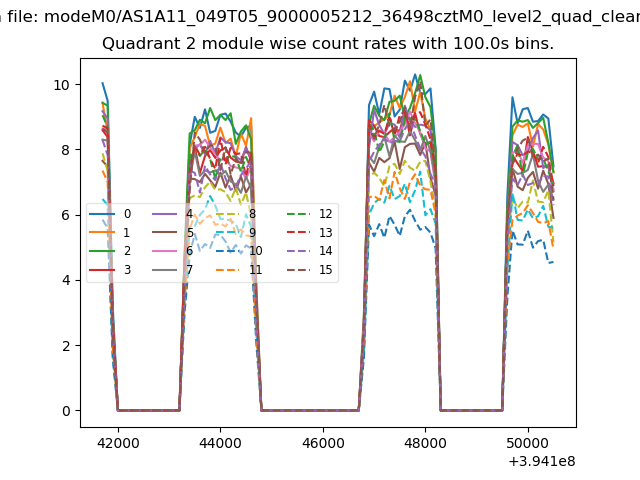
| Module-wise count rates for Quadrant B Data is divided into 100 sec bins |
 |
 |
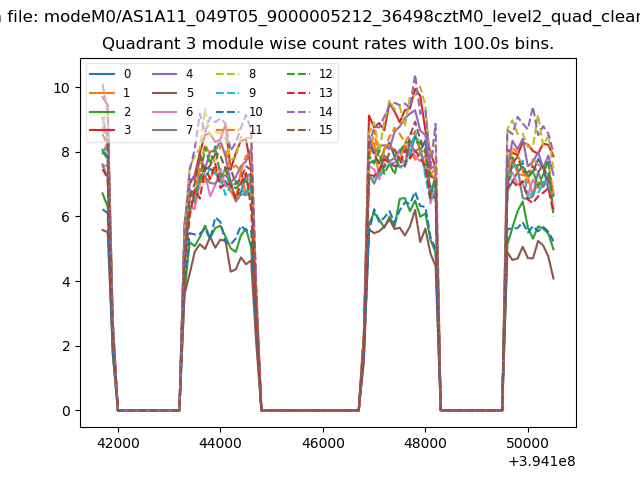
| Module-wise count rates for Quadrant C Data is divided into 100 sec bins |
 |
 |
| Module-wise count rates for Quadrant D Data is divided into 100 sec bins |
 |
 |
| Parameter | Plot |
|---|---|
| CZT HV Monitor | 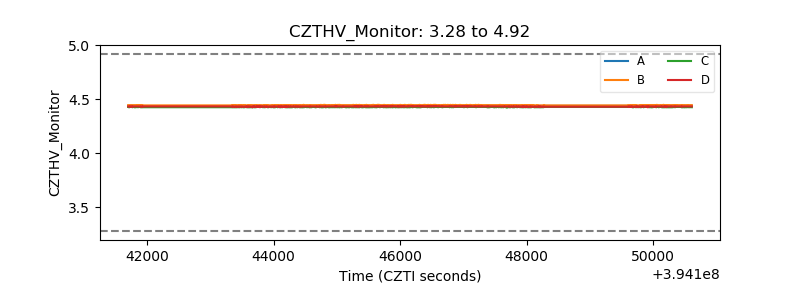 |
| D_VDD | 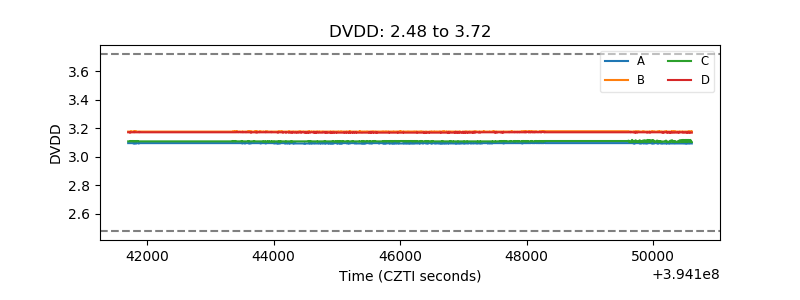 |
| Temperature 1 | 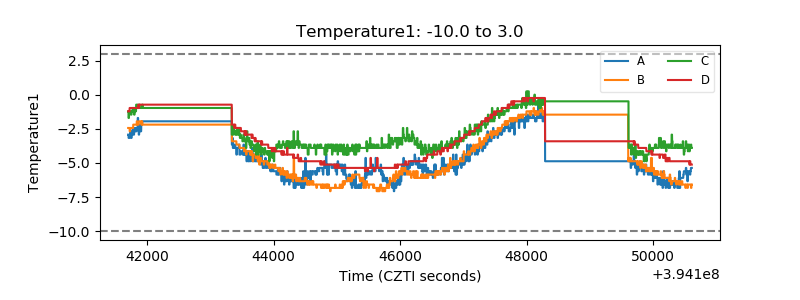 |
| Veto HV Monitor | 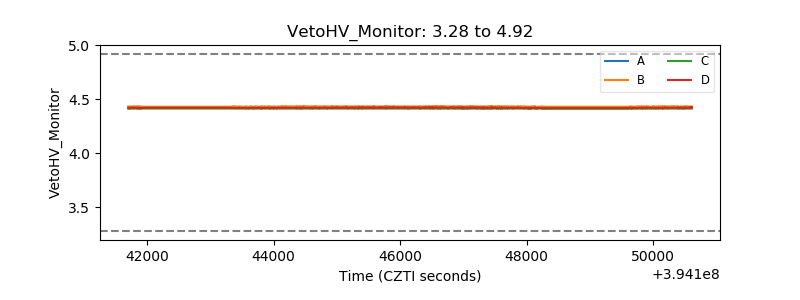 |
| Veto LLD | 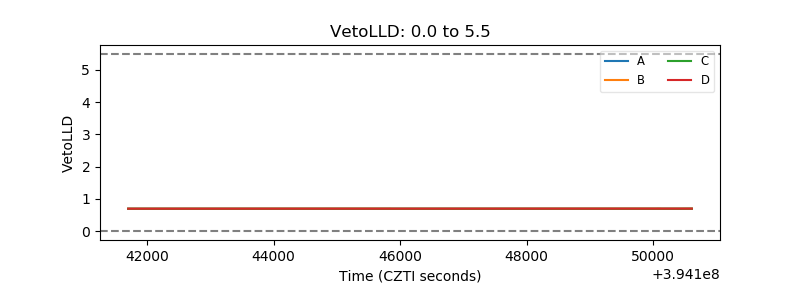 |
| Alpha Counter | 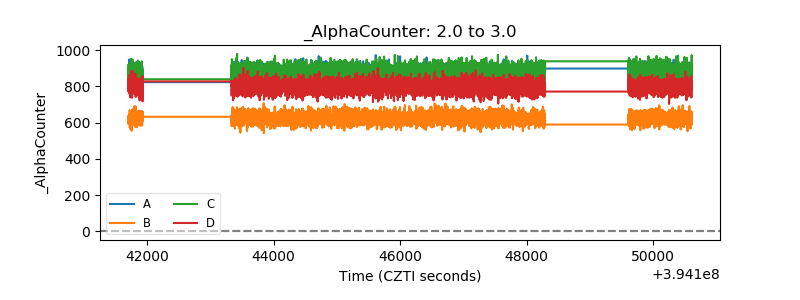 |
| _CPM_Rate | 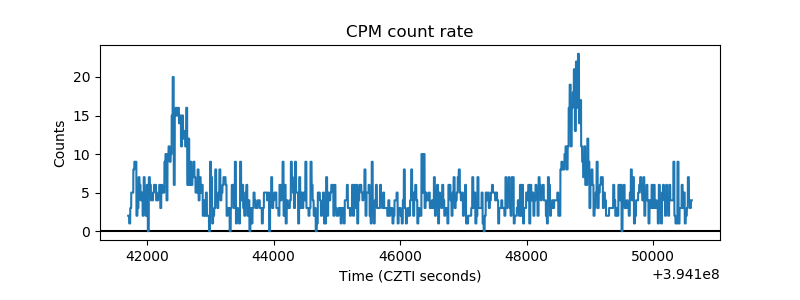 |
| CZT Counter | 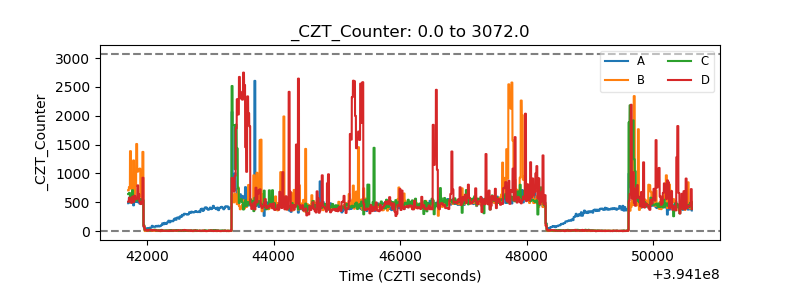 |
| +2.5 Volts monitor | 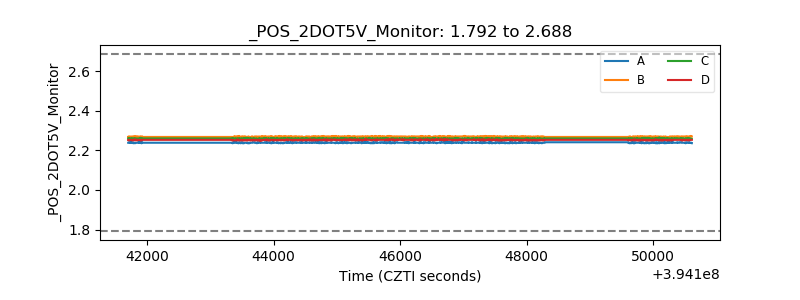 |
| +5 Volts monitor | 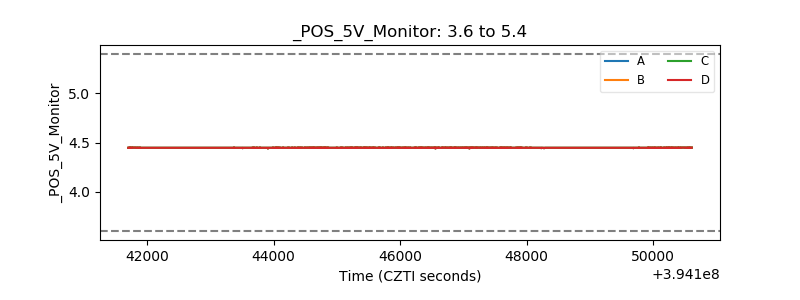 |
| _ROLL_ROT | 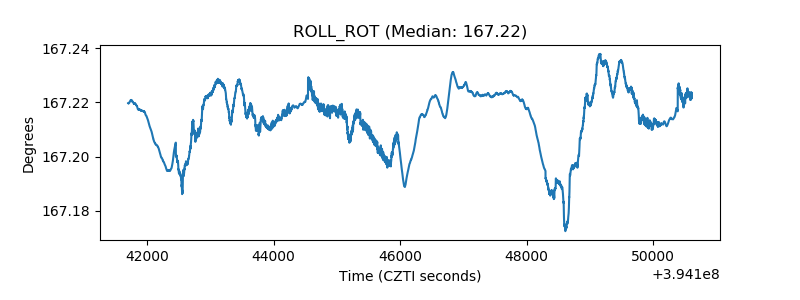 |
| _Roll_DEC | 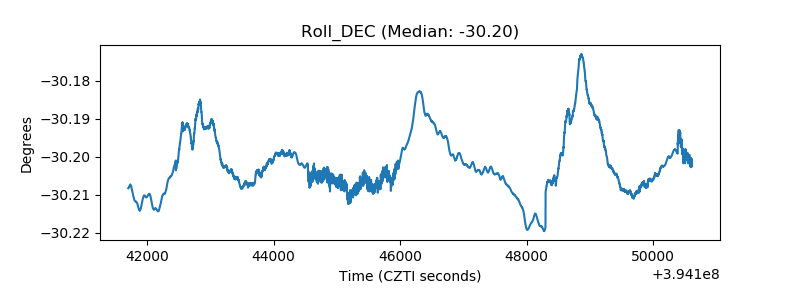 |
| _Roll_RA | 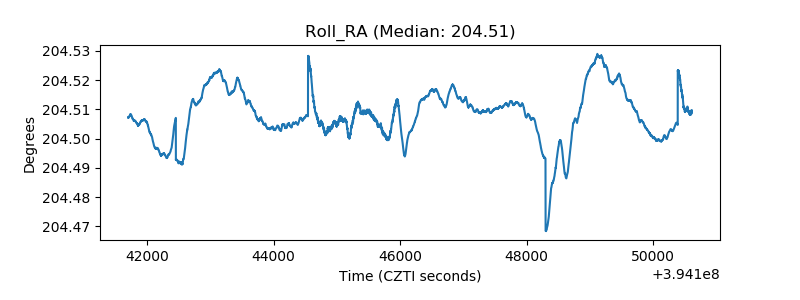 |
| Veto Counter | 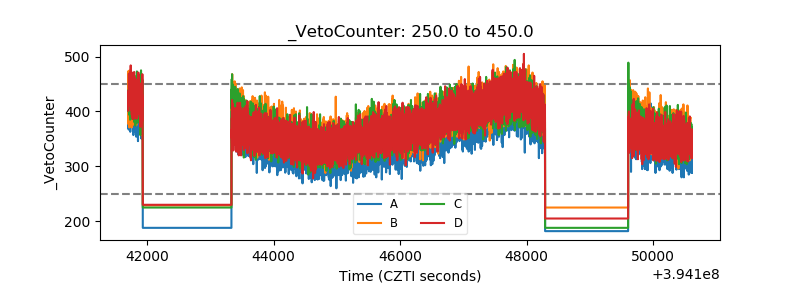 |