| Param | Original file | Final file |
|---|---|---|
| Filename | modeM0/AS1A11_049T05_9000005212_36496cztM0_level2.evt | modeM0/AS1A11_049T05_9000005212_36496cztM0_level2_quad_clean.evt |
| Size (bytes) | 412,407,360 | 67,340,160 |
| Size | 393.3 MB | 64.2 MB |
| Events in quadrant A | 2,643,553 | 429,875 |
| Events in quadrant B | 2,944,671 | 420,564 |
| Events in quadrant C | 2,937,634 | 407,430 |
| Events in quadrant D | 3,590,572 | 396,757 |
| Mode SS | |||
|---|---|---|---|
| Quadrant | BADHDUFLAG | Total packets | Discarded packets |
| A | 0 | 112 | 0 |
| B | 0 | 112 | 0 |
| C | 0 | 112 | 0 |
| D | 0 | 112 | 0 |
| Mode M0 | |||
|---|---|---|---|
| Quadrant | BADHDUFLAG | Total packets | Discarded packets |
| A | 0 | 11431 | 3 |
| B | 0 | 12359 | 2 |
| C | 0 | 12251 | 2 |
| D | 0 | 14510 | 2 |
| Mode M9 | |||
|---|---|---|---|
| Quadrant | BADHDUFLAG | Total packets | Discarded packets |
| A | 0 | 19 | 0 |
| B | 0 | 19 | 0 |
| C | 0 | 19 | 0 |
| D | 0 | 20 | 0 |
| Quadrant | Total seconds | Saturated seconds | Saturation percentage |
|---|---|---|---|
| A | 5491 | 8 | 0.145693% |
| B | 5491 | 48 | 0.874158% |
| C | 5491 | 108 | 1.966855% |
| D | 5491 | 152 | 2.768166% |
Noise dominated data is calculated using 1-second bins in cleaned event files. If a bin has >2000 counts, and if more than 50% of those come from <1% of pixels, then it is considered to be noise-dominated and hence unusable.
| Quadrant | # 1 sec bins | Bins with >0 counts | Bins with >2000 counts | High rate bins dominated by noise | Noise dominated (total time) | Noise dominated (detector-on time) | Marked lightcurve |
|---|---|---|---|---|---|---|---|
| A | 7164 | 5492 | 2 | 2 | 0.03% | 0.04% | 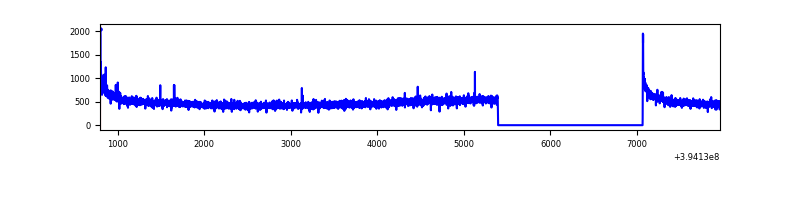 |
| B | 7164 | 5492 | 24 | 24 | 0.34% | 0.44% | 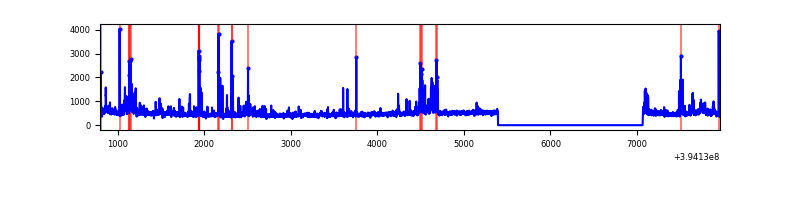 |
| C | 7164 | 5492 | 78 | 78 | 1.09% | 1.42% | 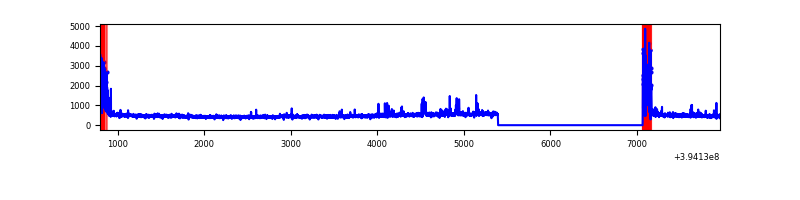 |
| D | 7164 | 5492 | 177 | 177 | 2.47% | 3.22% | 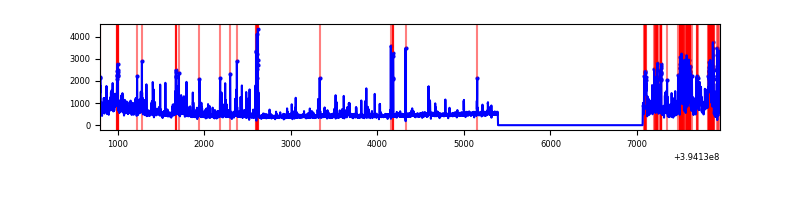 |
Top three noisy pixels from each quadrant. If the there are fewer than three noisy pixels in the level2.evt file, extra rows are filled as -1
| Pixel properties | Quadrant properties | ||||||
|---|---|---|---|---|---|---|---|
| Quadrant | DetID | PixID | Counts | Sigma | Mean | Median | Sigma |
| A | 10 | 83 | 209677 | 1647.65 | 624 | 613 | 126.9 |
| A | 13 | 254 | 9639 | 71.13 | 624 | 613 | 126.9 |
| A | 9 | 143 | 7885 | 57.31 | 624 | 613 | 126.9 |
| B | 5 | 172 | 154938 | 1294.48 | 615 | 600 | 119.2 |
| B | 0 | 229 | 105785 | 882.22 | 615 | 600 | 119.2 |
| B | 5 | 255 | 100033 | 833.97 | 615 | 600 | 119.2 |
| C | 0 | 10 | 334770 | 2439.43 | 591 | 593 | 137.0 |
| C | 15 | 214 | 234380 | 1706.6 | 591 | 593 | 137.0 |
| C | 0 | 207 | 39746 | 285.81 | 591 | 593 | 137.0 |
| D | 12 | 227 | 688631 | 4704.13 | 595 | 577 | 146.3 |
| D | 12 | 235 | 169897 | 1157.62 | 595 | 577 | 146.3 |
| D | 13 | 249 | 139971 | 953.02 | 595 | 577 | 146.3 |
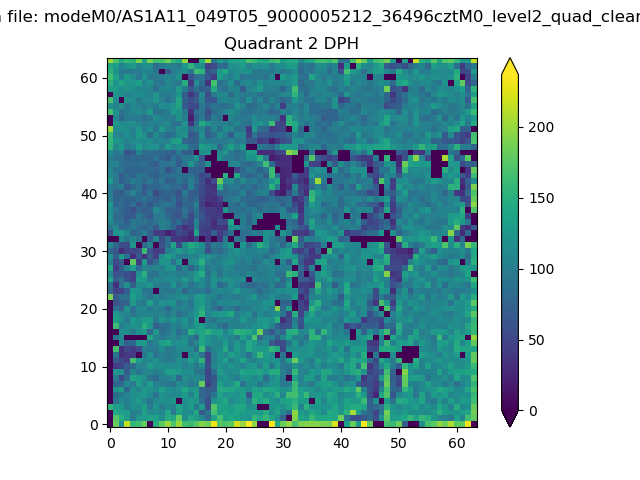
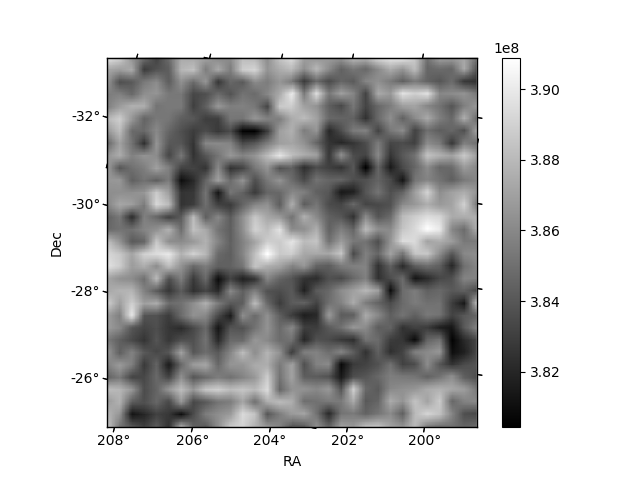
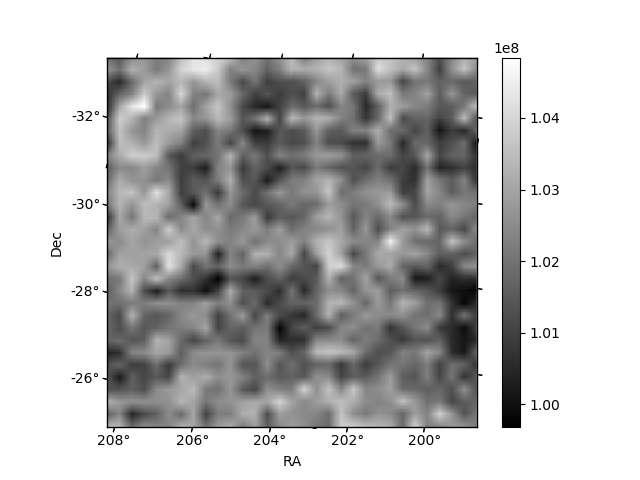
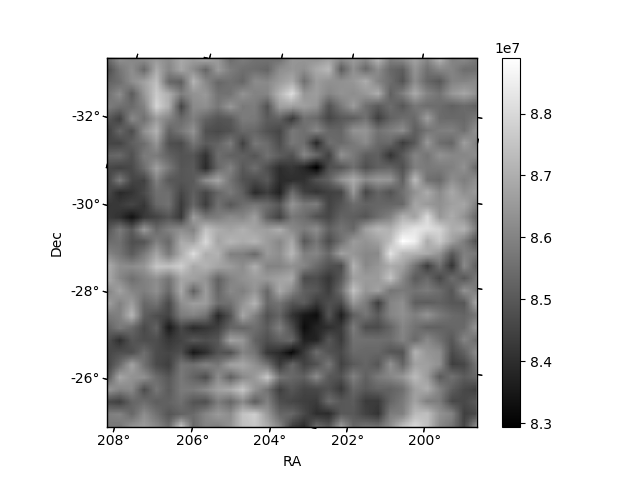
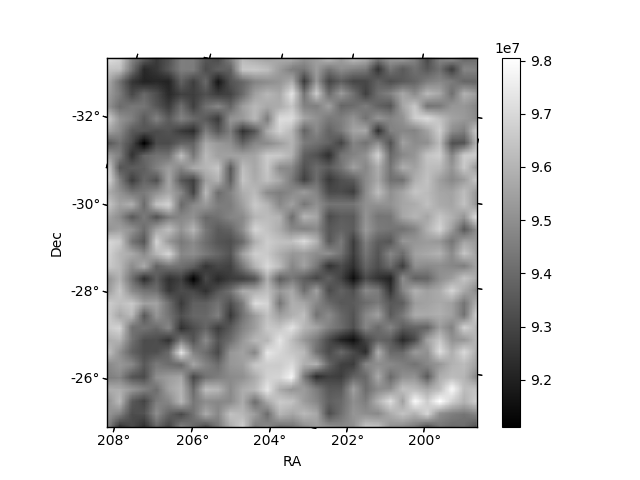
Histogram calculated using DETX and DETY for each event in the final _common_clean file
| Quadrant A | 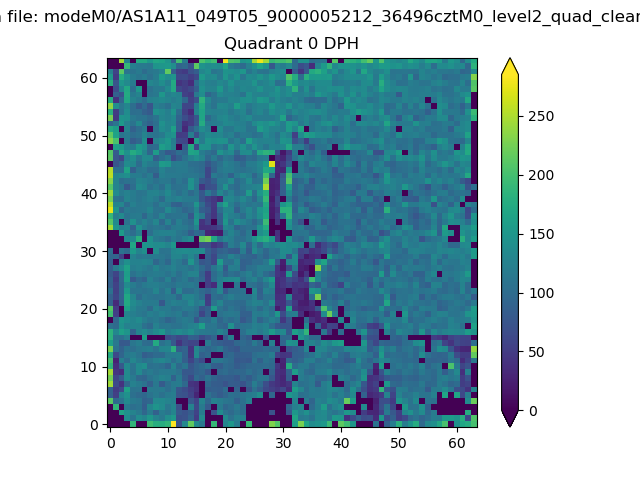 |
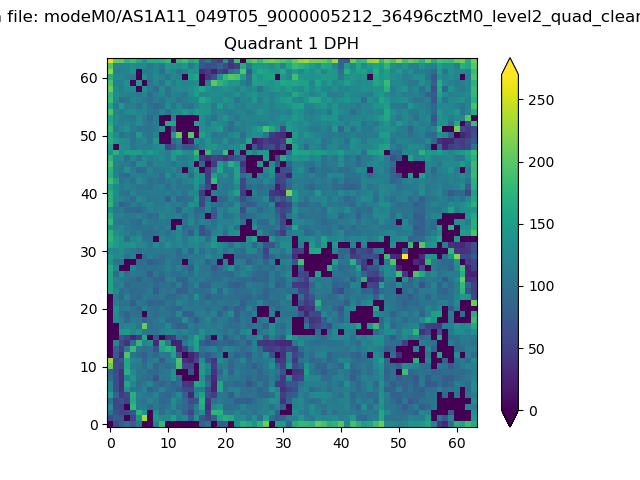 |
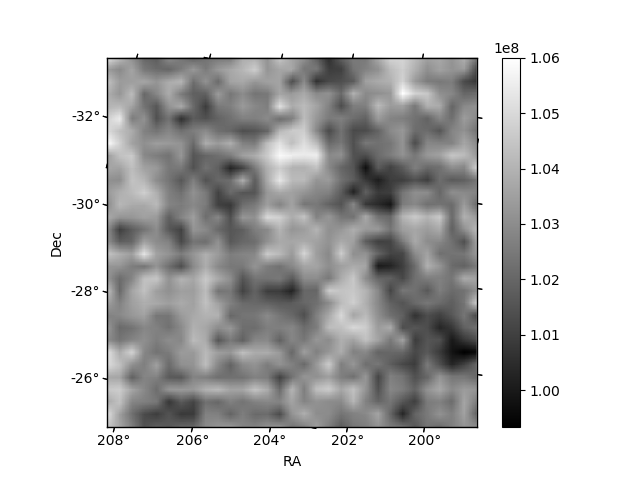
Quadrant B |
|---|---|---|---|
| Quadrant D | 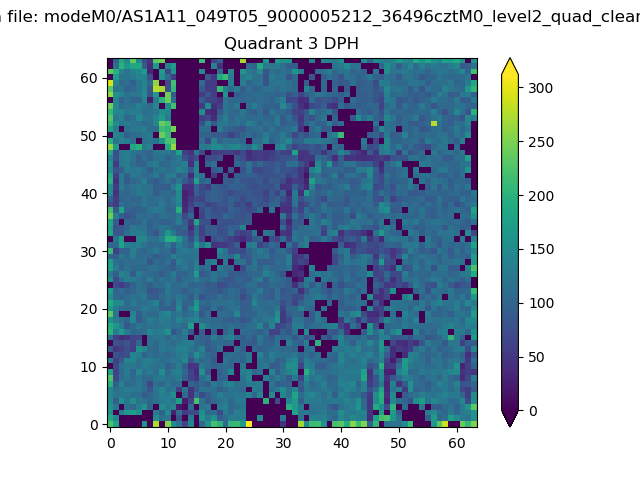 |
 |
Quadrant C |
| Plot type | Count rate plots | Images |
|---|---|---|
| Comparison with Poisson distribution Blue bars denote a histogram of data divided into 1 sec bins. Red curve is a Poisson curve with rate = median count rate of data. |
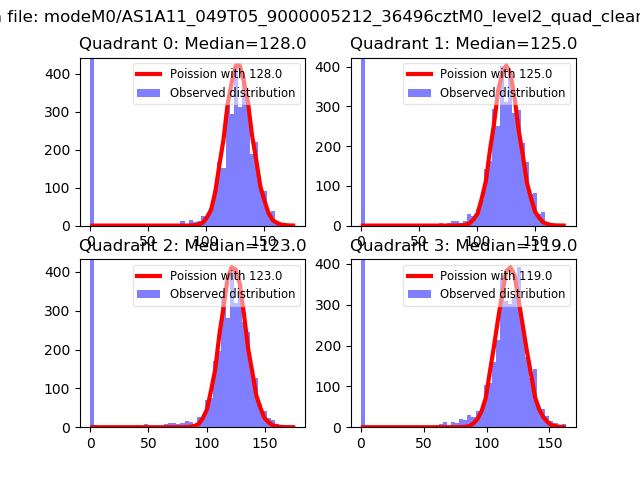 |
 |
| Quadrant-wise count rates Data is divided into 100 sec bins |
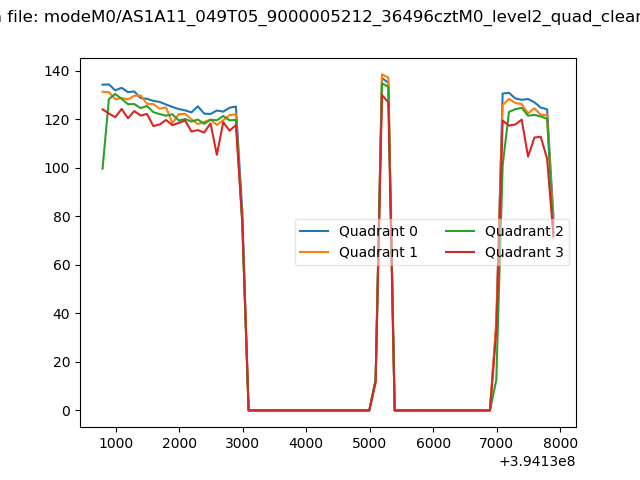 |
|
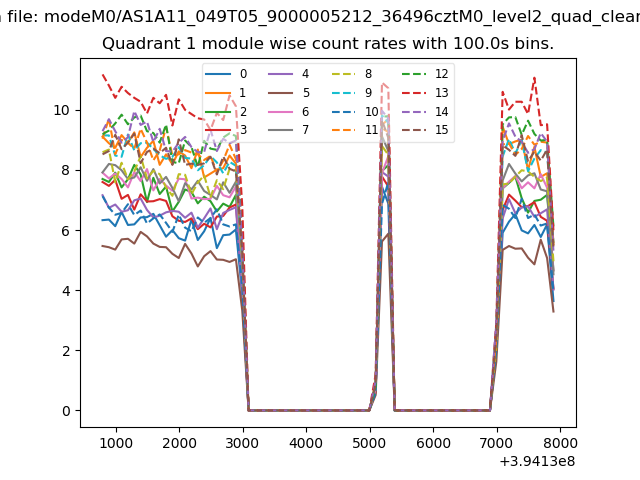
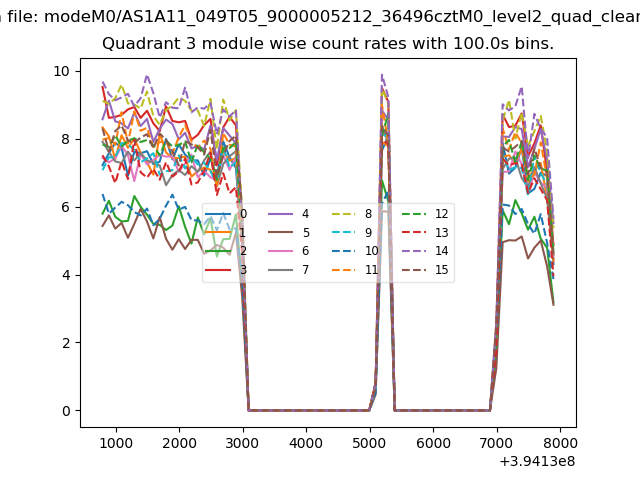
| Module-wise count rates for Quadrant A Data is divided into 100 sec bins |
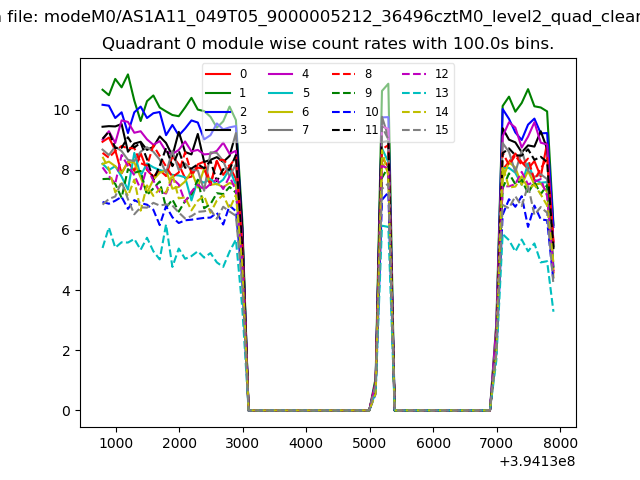 |
 |
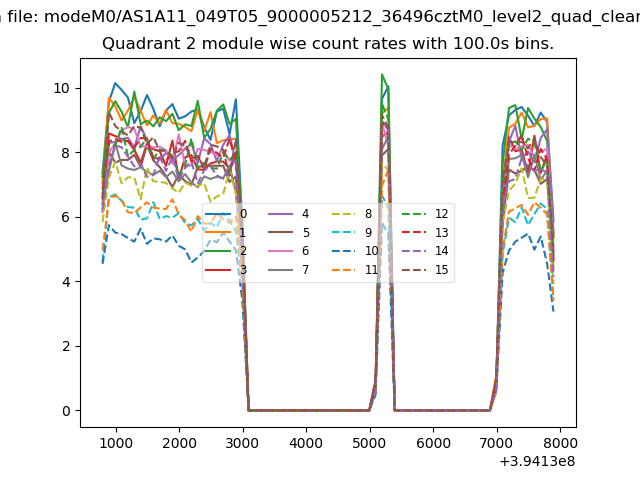
| Module-wise count rates for Quadrant B Data is divided into 100 sec bins |
 |
 |
| Module-wise count rates for Quadrant C Data is divided into 100 sec bins |
 |
 |
| Module-wise count rates for Quadrant D Data is divided into 100 sec bins |
 |
 |
| Parameter | Plot |
|---|---|
| CZT HV Monitor | 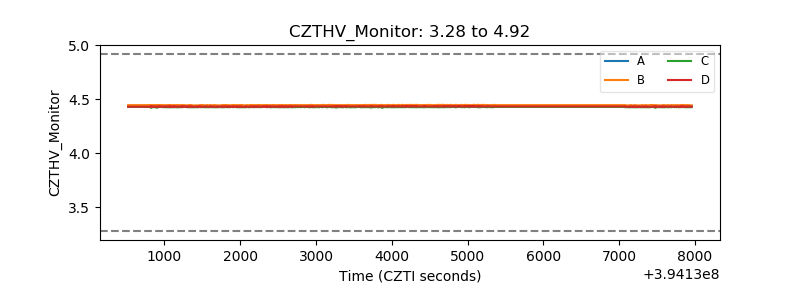 |
| D_VDD | 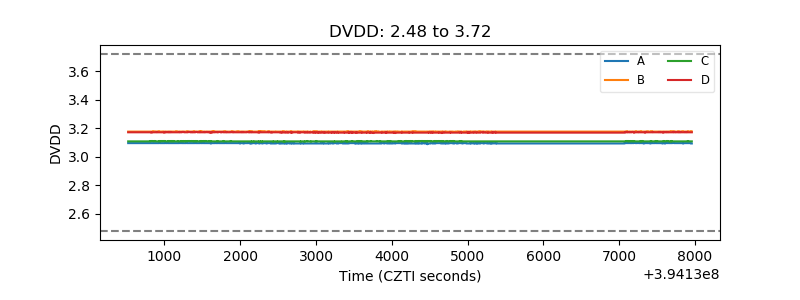 |
| Temperature 1 | 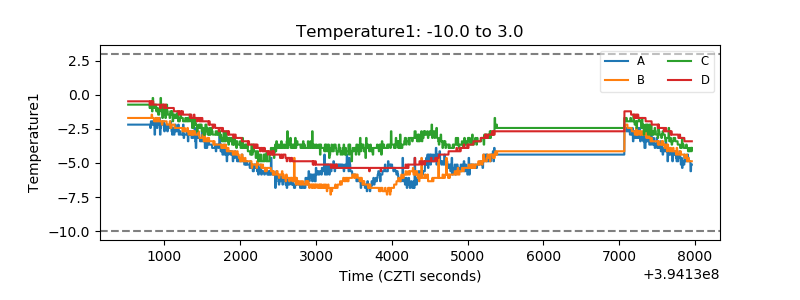 |
| Veto HV Monitor |  |
| Veto LLD | 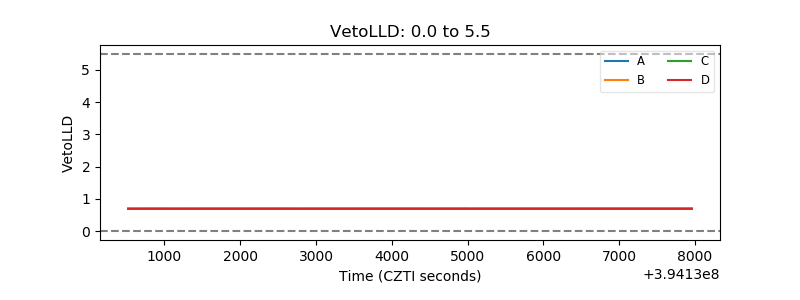 |
| Alpha Counter | 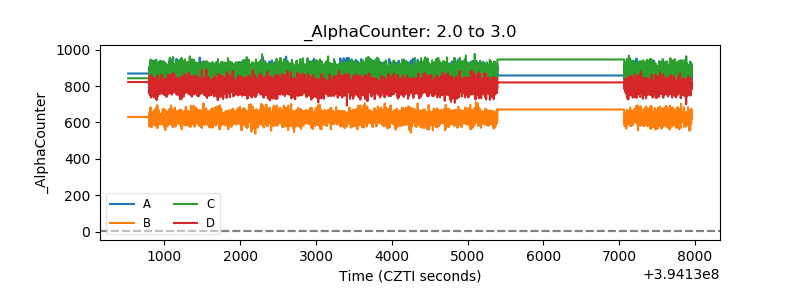 |
| _CPM_Rate | 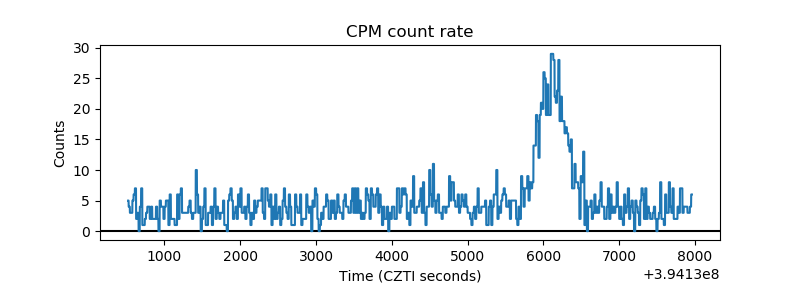 |
| CZT Counter | 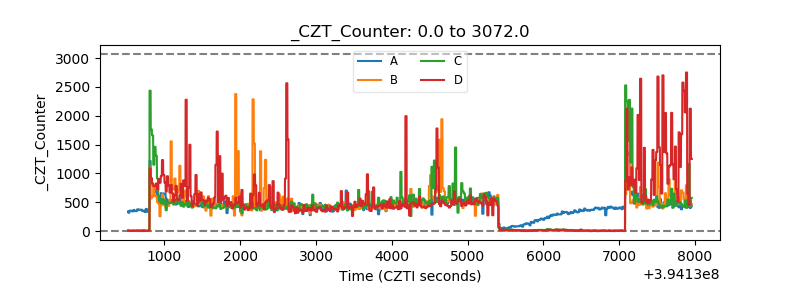 |
| +2.5 Volts monitor | 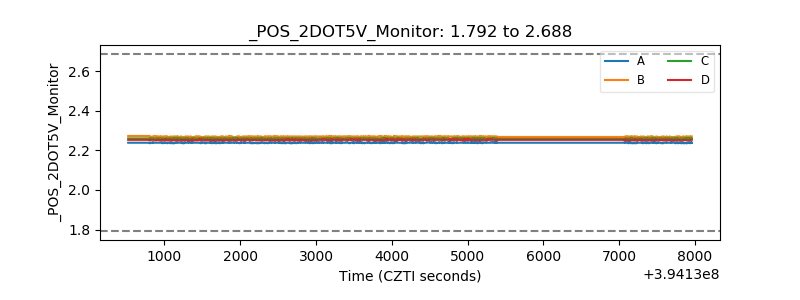 |
| +5 Volts monitor | 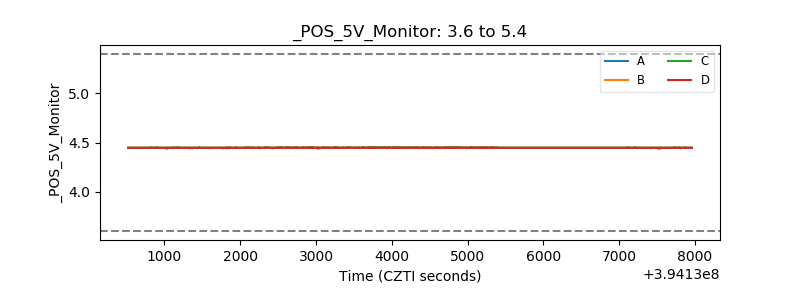 |
| _ROLL_ROT | 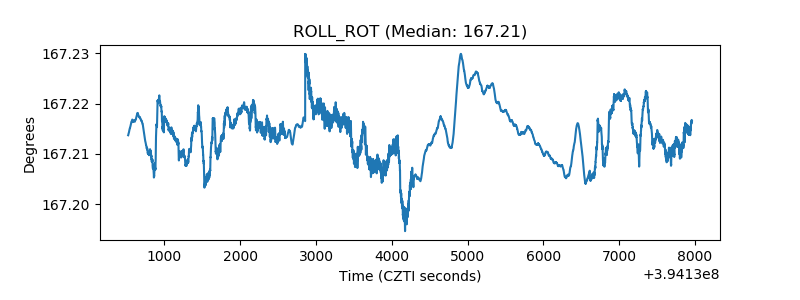 |
| _Roll_DEC | 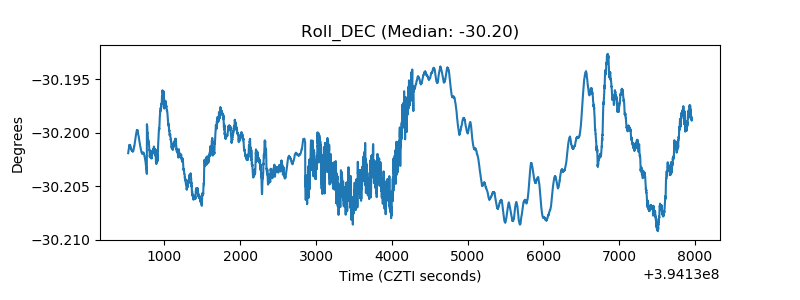 |
| _Roll_RA | 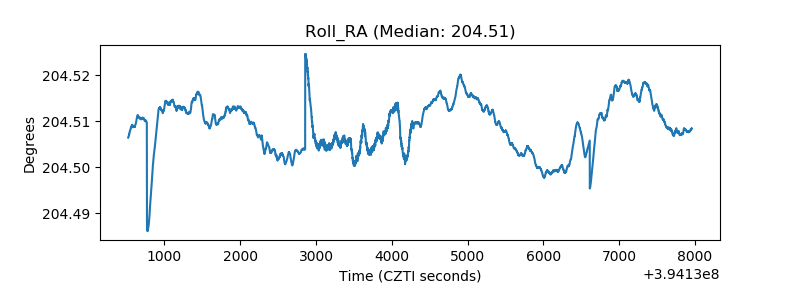 |
| Veto Counter | 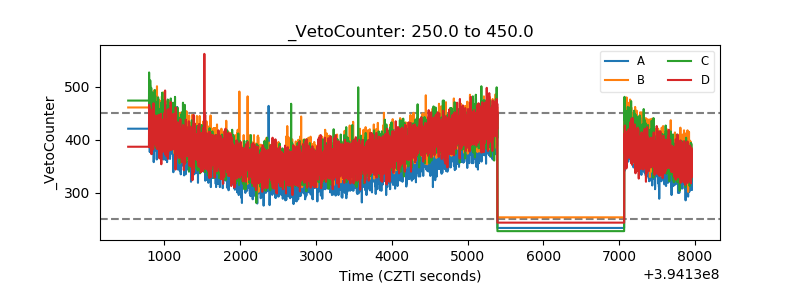 |