| Param | Original file | Final file |
|---|---|---|
| Filename | modeM0/AS1A11_049T05_9000005212_36495cztM0_level2.evt | modeM0/AS1A11_049T05_9000005212_36495cztM0_level2_quad_clean.evt |
| Size (bytes) | 403,225,920 | 72,578,880 |
| Size | 384.5 MB | 69.2 MB |
| Events in quadrant A | 2,560,517 | 477,022 |
| Events in quadrant B | 2,759,700 | 466,557 |
| Events in quadrant C | 2,658,148 | 453,731 |
| Events in quadrant D | 3,882,960 | 439,102 |
| Mode SS | |||
|---|---|---|---|
| Quadrant | BADHDUFLAG | Total packets | Discarded packets |
| A | 0 | 104 | 0 |
| B | 0 | 104 | 0 |
| C | 0 | 104 | 0 |
| D | 0 | 104 | 0 |
| Mode M0 | |||
|---|---|---|---|
| Quadrant | BADHDUFLAG | Total packets | Discarded packets |
| A | 0 | 10873 | 3 |
| B | 0 | 11536 | 2 |
| C | 0 | 11118 | 2 |
| D | 0 | 15081 | 2 |
| Mode M9 | |||
|---|---|---|---|
| Quadrant | BADHDUFLAG | Total packets | Discarded packets |
| A | 0 | 22 | 0 |
| B | 0 | 22 | 0 |
| C | 0 | 22 | 0 |
| D | 0 | 23 | 0 |
| Quadrant | Total seconds | Saturated seconds | Saturation percentage |
|---|---|---|---|
| A | 5161 | 9 | 0.174385% |
| B | 5161 | 28 | 0.542531% |
| C | 5161 | 80 | 1.550087% |
| D | 5161 | 112 | 2.170122% |
Noise dominated data is calculated using 1-second bins in cleaned event files. If a bin has >2000 counts, and if more than 50% of those come from <1% of pixels, then it is considered to be noise-dominated and hence unusable.
| Quadrant | # 1 sec bins | Bins with >0 counts | Bins with >2000 counts | High rate bins dominated by noise | Noise dominated (total time) | Noise dominated (detector-on time) | Marked lightcurve |
|---|---|---|---|---|---|---|---|
| A | 7163 | 5162 | 2 | 2 | 0.03% | 0.04% | 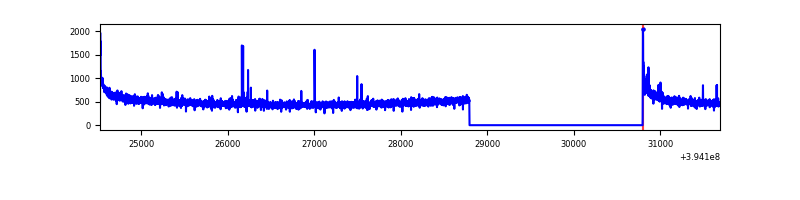 |
| B | 7163 | 5162 | 19 | 19 | 0.27% | 0.37% | 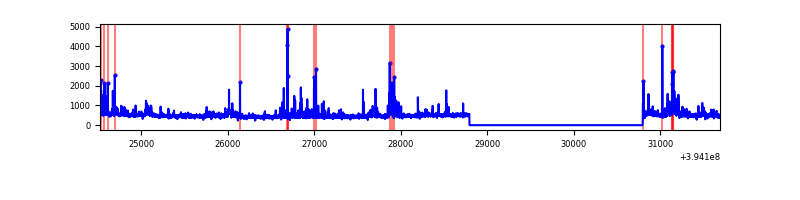 |
| C | 7163 | 5162 | 44 | 44 | 0.61% | 0.85% | 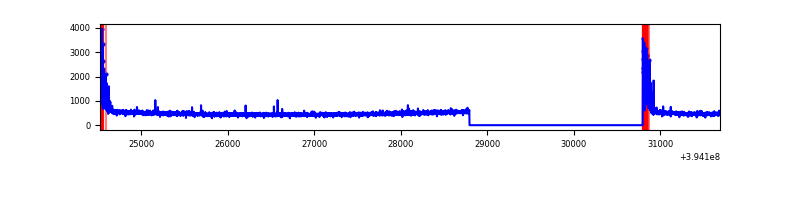 |
| D | 7163 | 5162 | 115 | 115 | 1.61% | 2.23% | 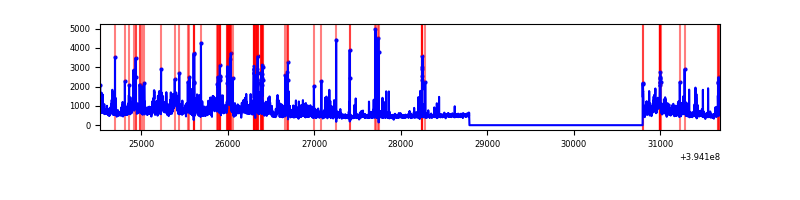 |
Top three noisy pixels from each quadrant. If the there are fewer than three noisy pixels in the level2.evt file, extra rows are filled as -1
| Pixel properties | Quadrant properties | ||||||
|---|---|---|---|---|---|---|---|
| Quadrant | DetID | PixID | Counts | Sigma | Mean | Median | Sigma |
| A | 10 | 83 | 207951 | 1720.49 | 598 | 588 | 120.5 |
| A | 12 | 189 | 21069 | 169.93 | 598 | 588 | 120.5 |
| A | 15 | 223 | 10402 | 81.43 | 598 | 588 | 120.5 |
| B | 5 | 172 | 192871 | 1705.65 | 587 | 572 | 112.7 |
| B | 5 | 255 | 138054 | 1219.44 | 587 | 572 | 112.7 |
| B | 4 | 232 | 39670 | 346.79 | 587 | 572 | 112.7 |
| C | 0 | 10 | 236508 | 1796.81 | 564 | 568 | 131.3 |
| C | 15 | 214 | 221048 | 1679.08 | 564 | 568 | 131.3 |
| C | 13 | 61 | 3711 | 23.94 | 564 | 568 | 131.3 |
| D | 12 | 235 | 855900 | 6133.72 | 569 | 553 | 139.4 |
| D | 12 | 227 | 204932 | 1465.61 | 569 | 553 | 139.4 |
| D | 2 | 250 | 193828 | 1385.98 | 569 | 553 | 139.4 |
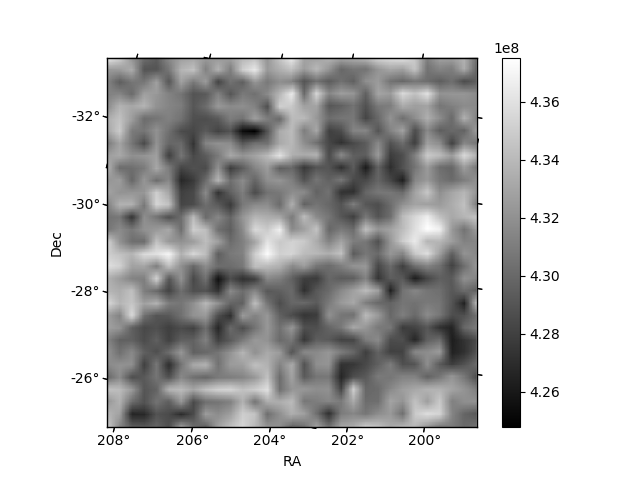
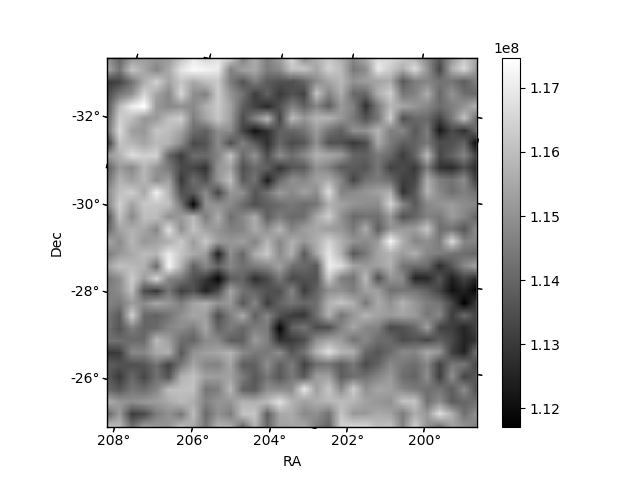
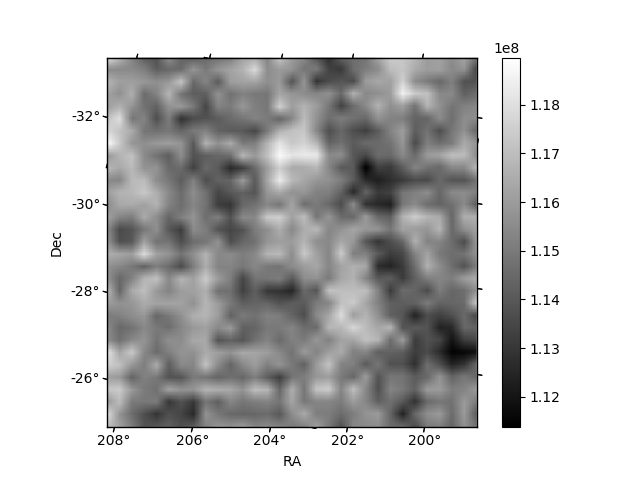
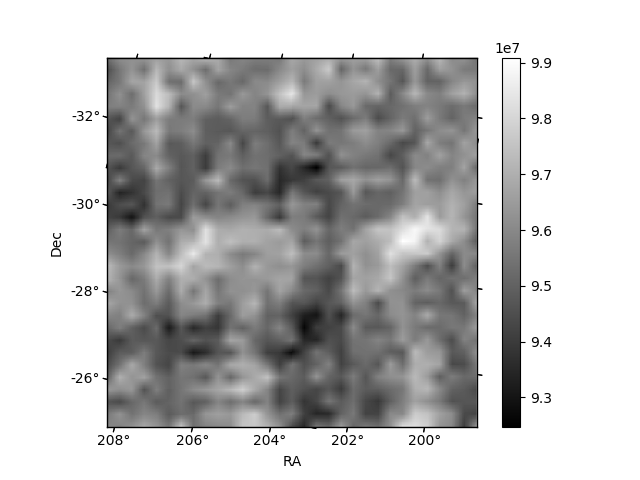
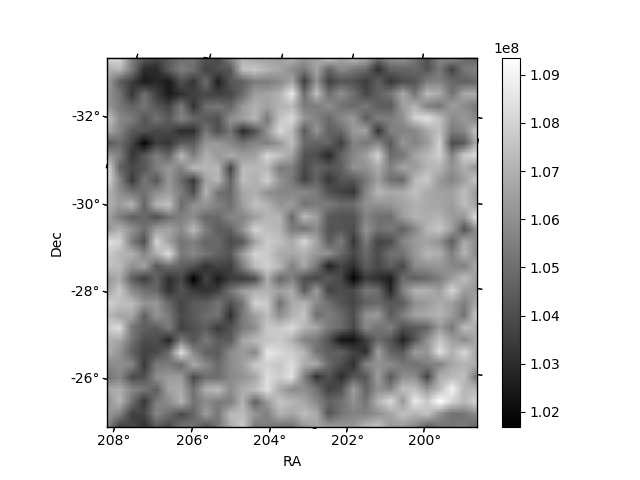
Histogram calculated using DETX and DETY for each event in the final _common_clean file
| Quadrant A | 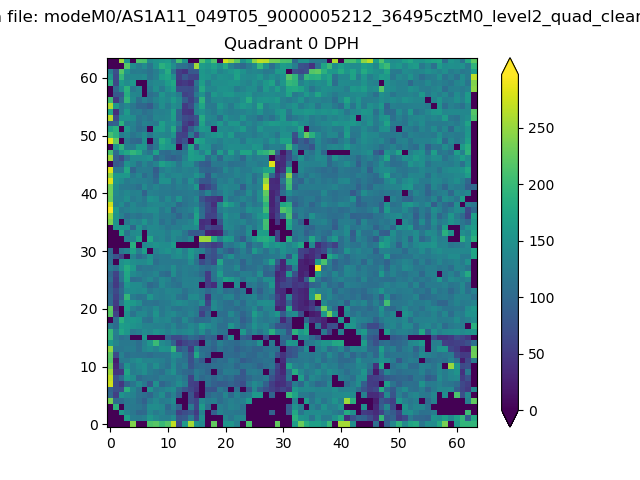 |
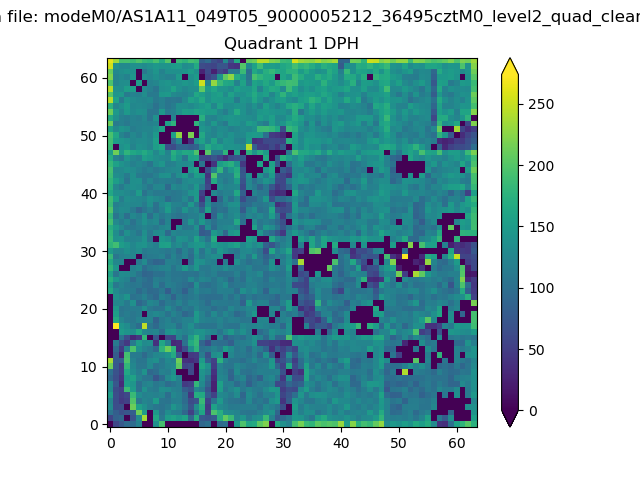 |
Quadrant B |
|---|---|---|---|
| Quadrant D | 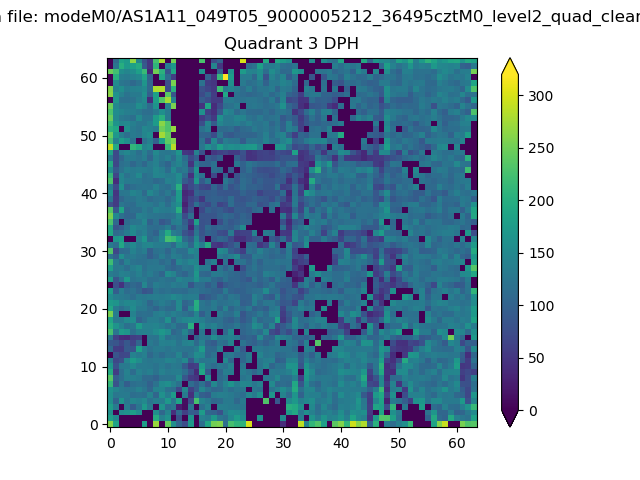 |
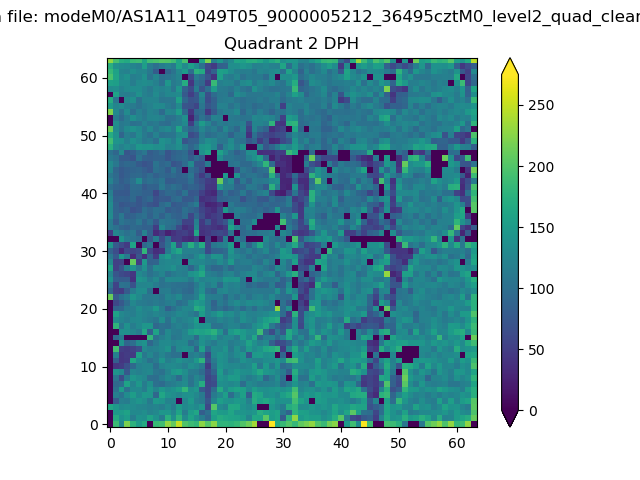 |
Quadrant C |
| Plot type | Count rate plots | Images |
|---|---|---|
| Comparison with Poisson distribution Blue bars denote a histogram of data divided into 1 sec bins. Red curve is a Poisson curve with rate = median count rate of data. |
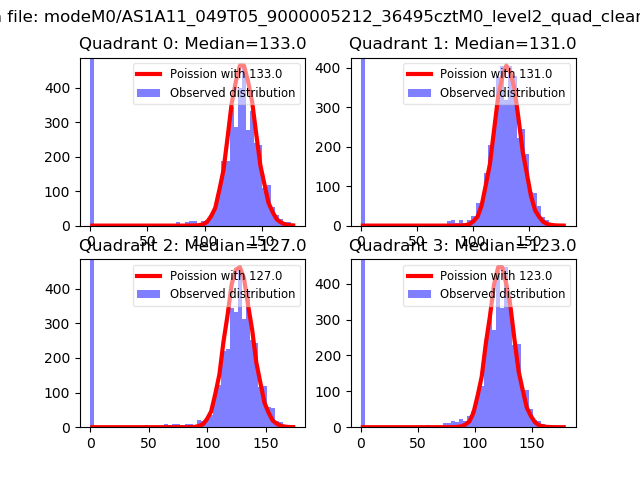 |
 |
| Quadrant-wise count rates Data is divided into 100 sec bins |
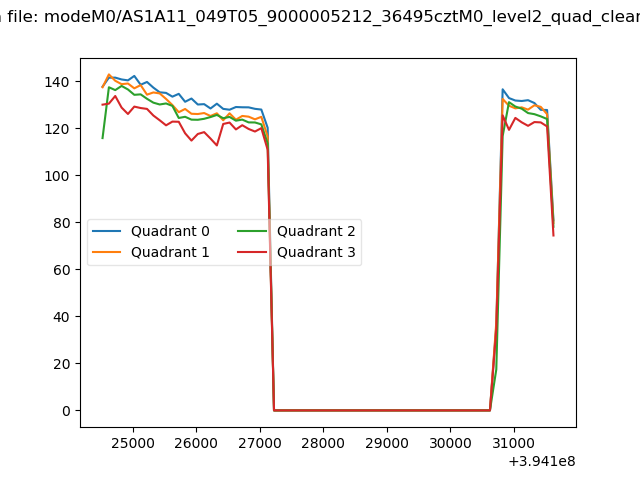 |
|
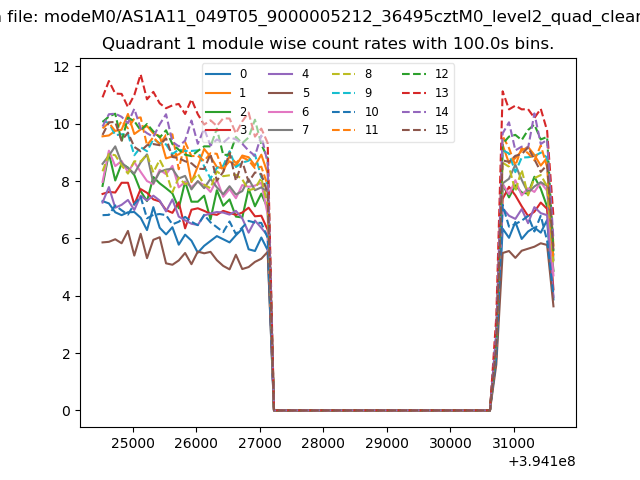
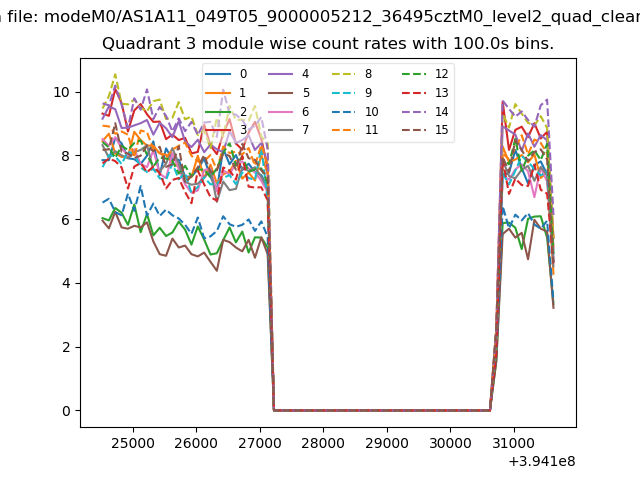
| Module-wise count rates for Quadrant A Data is divided into 100 sec bins |
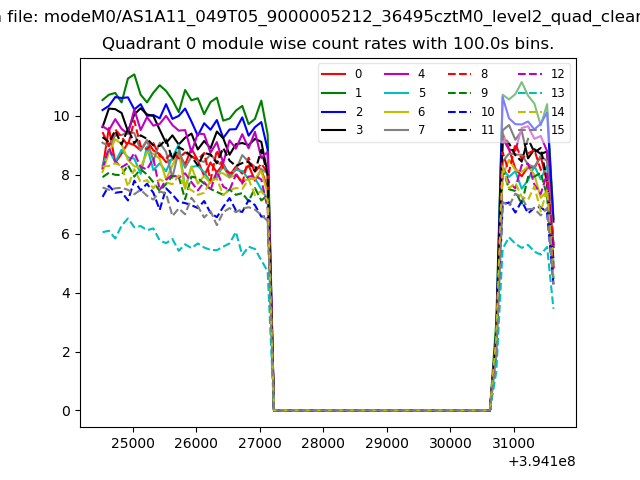 |
 |
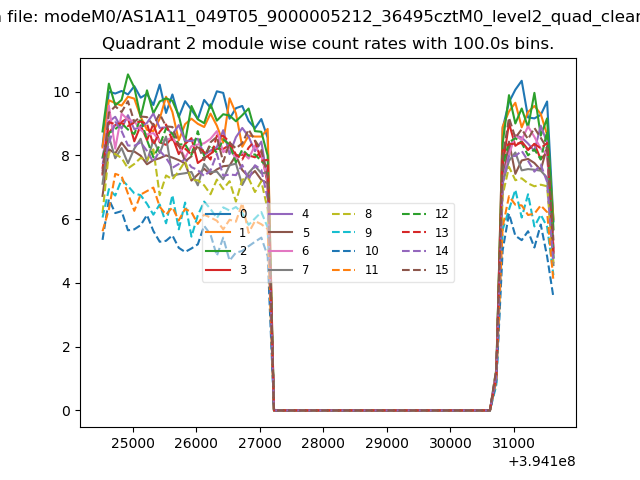
| Module-wise count rates for Quadrant B Data is divided into 100 sec bins |
 |
 |
| Module-wise count rates for Quadrant C Data is divided into 100 sec bins |
 |
 |
| Module-wise count rates for Quadrant D Data is divided into 100 sec bins |
 |
 |
| Parameter | Plot |
|---|---|
| CZT HV Monitor | 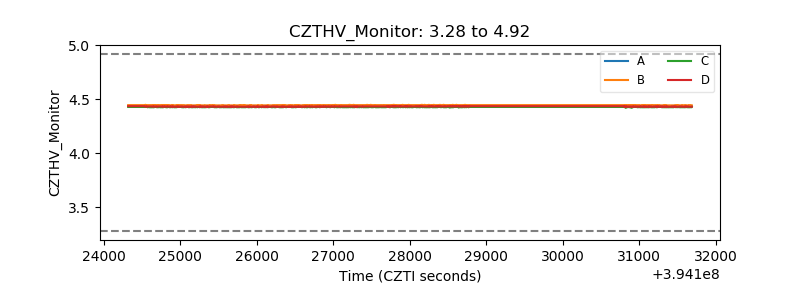 |
| D_VDD | 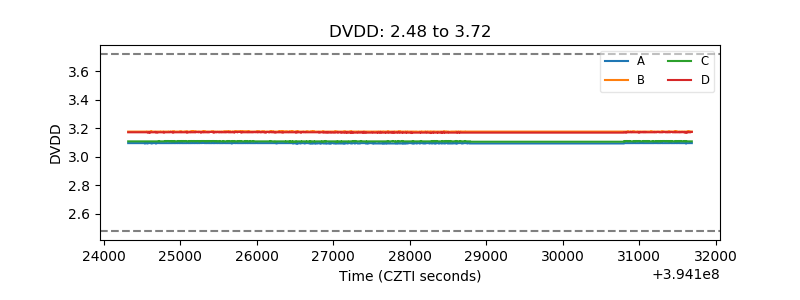 |
| Temperature 1 | 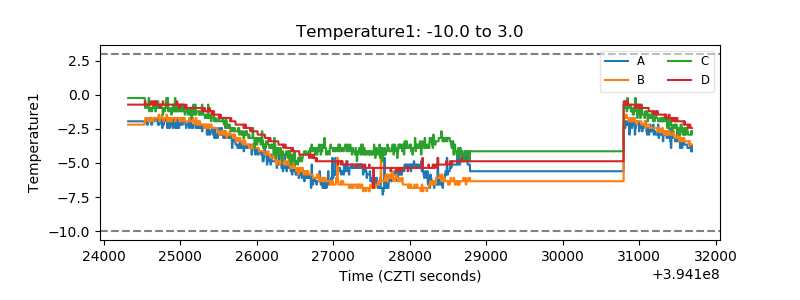 |
| Veto HV Monitor | 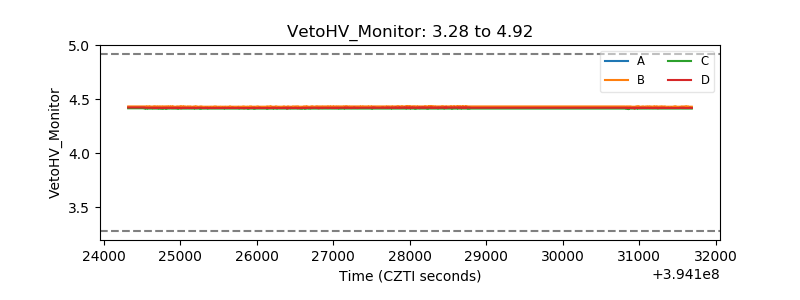 |
| Veto LLD | 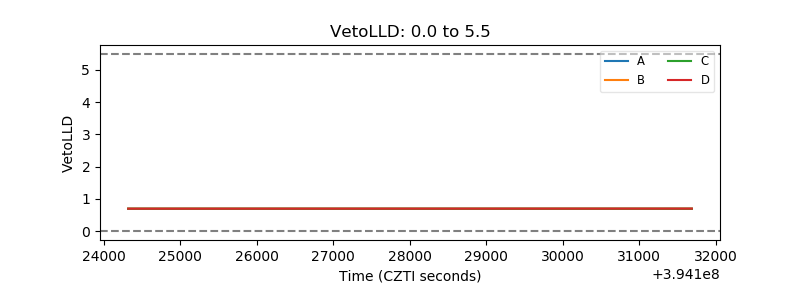 |
| Alpha Counter | 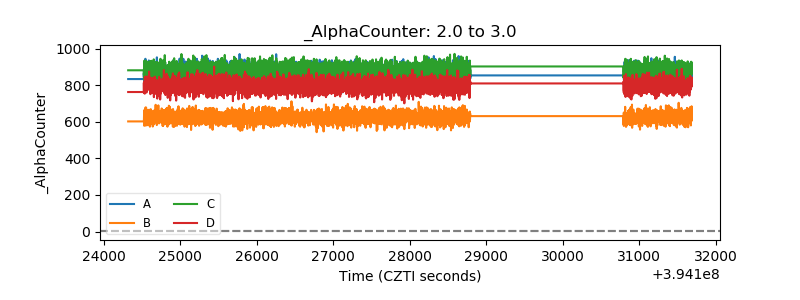 |
| _CPM_Rate | 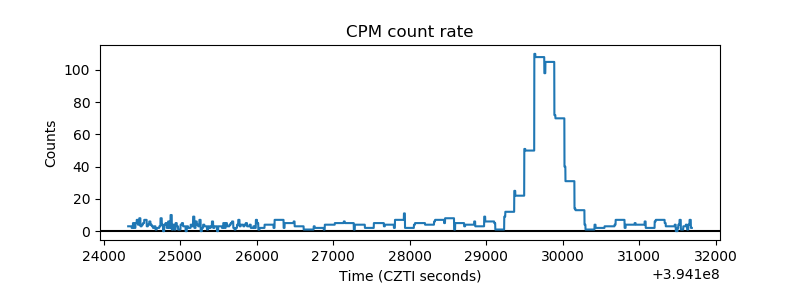 |
| CZT Counter | 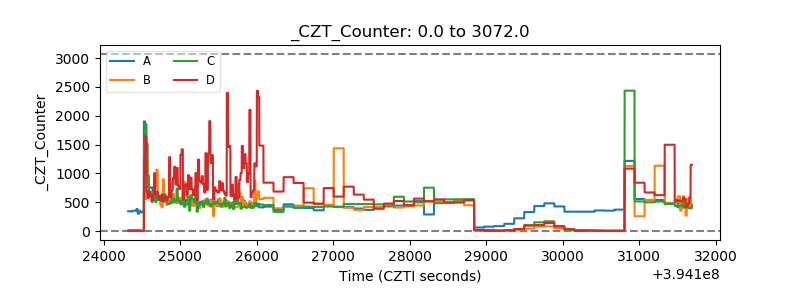 |
| +2.5 Volts monitor | 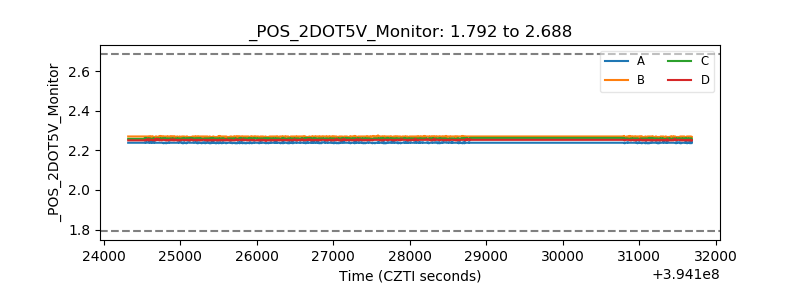 |
| +5 Volts monitor | 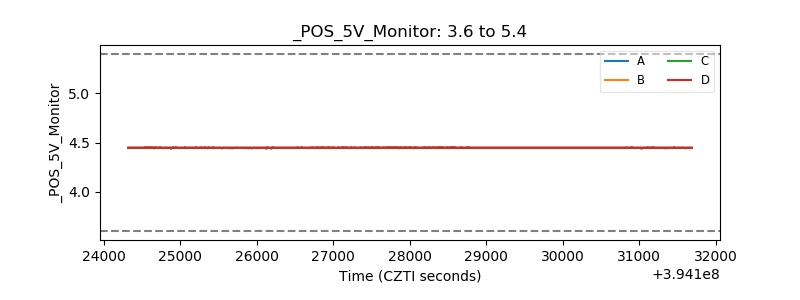 |
| _ROLL_ROT | 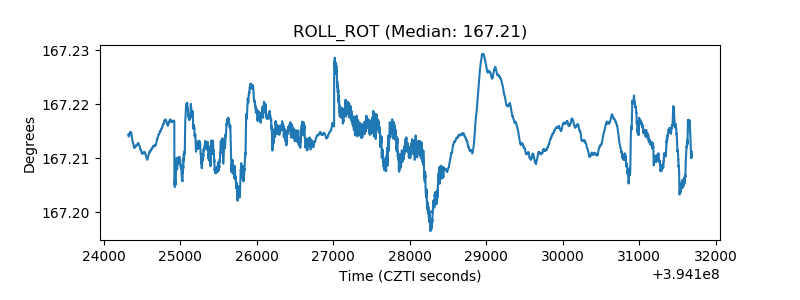 |
| _Roll_DEC | 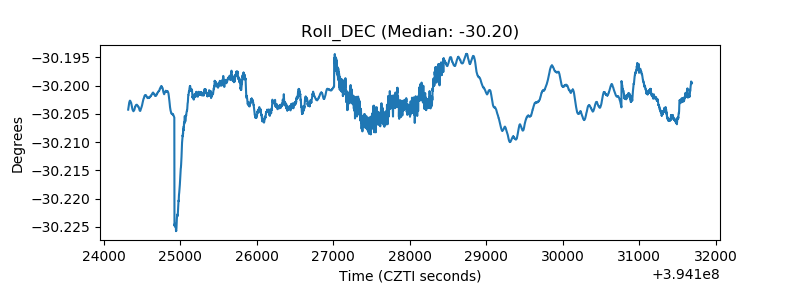 |
| _Roll_RA | 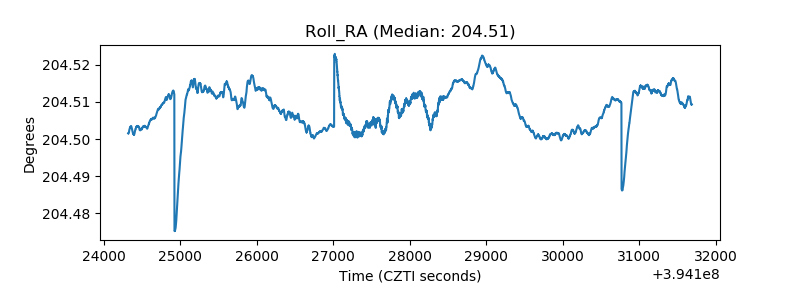 |
| Veto Counter | 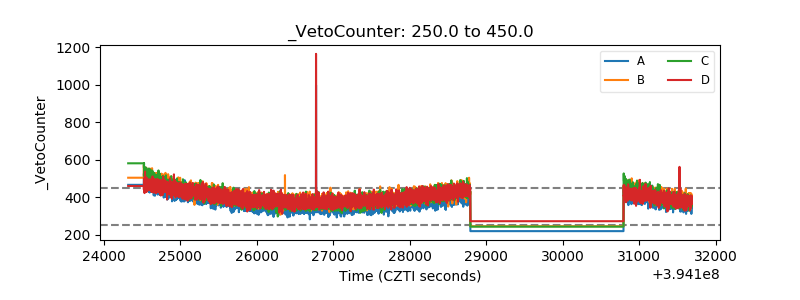 |