| Param | Original file | Final file |
|---|---|---|
| Filename | modeM0/AS1A11_049T05_9000005212cztM0_level2_bc.evt | modeM0/AS1A11_049T05_9000005212cztM0_level2_quad_clean.evt |
| Size (bytes) | 2,074,875,840 | 570,634,560 |
| Size | 1.9 GB | 544.2 MB |
| Events in quadrant A | 11,222,784 | 3,610,481 |
| Events in quadrant B | 14,246,647 | 3,561,356 |
| Events in quadrant C | 12,264,647 | 3,509,959 |
| Events in quadrant D | 21,856,467 | 3,327,794 |
| Mode SS | |||
|---|---|---|---|
| Quadrant | BADHDUFLAG | Total packets | Discarded packets |
| A | 0 | 974 | 0 |
| B | 0 | 974 | 0 |
| C | 0 | 974 | 0 |
| D | 0 | 974 | 0 |
| Mode M0 | |||
|---|---|---|---|
| Quadrant | BADHDUFLAG | Total packets | Discarded packets |
| A | 0 | 99289 | 0 |
| B | 0 | 113563 | 0 |
| C | 0 | 101374 | 0 |
| D | 0 | 136106 | 0 |
| Mode M9 | |||
|---|---|---|---|
| Quadrant | BADHDUFLAG | Total packets | Discarded packets |
| A | 0 | 161 | 0 |
| B | 0 | 161 | 0 |
| C | 0 | 161 | 0 |
| D | 0 | 161 | 0 |
| Quadrant | Total seconds | Saturated seconds | Saturation percentage |
|---|---|---|---|
| A | 47701 | 129 | 0.270435% |
| B | 47701 | 951 | 1.993669% |
| C | 47701 | 446 | 0.934991% |
| D | 47701 | 2101 | 4.404520% |
Noise dominated data is calculated using 1-second bins in cleaned event files. If a bin has >2000 counts, and if more than 50% of those come from <1% of pixels, then it is considered to be noise-dominated and hence unusable.
| Quadrant | # 1 sec bins | Bins with >0 counts | Bins with >2000 counts | High rate bins dominated by noise | Noise dominated (total time) | Noise dominated (detector-on time) | Marked lightcurve |
|---|---|---|---|---|---|---|---|
| A | 63826 | 47710 | 20 | 20 | 0.03% | 0.04% | 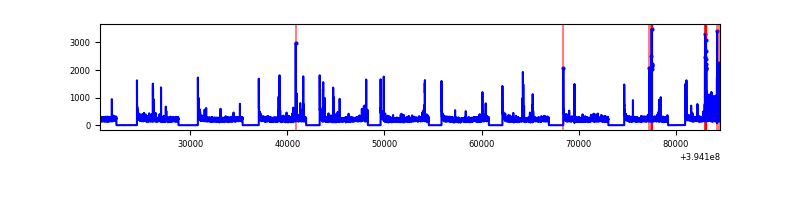 |
| B | 63826 | 47700 | 71 | 71 | 0.11% | 0.15% | 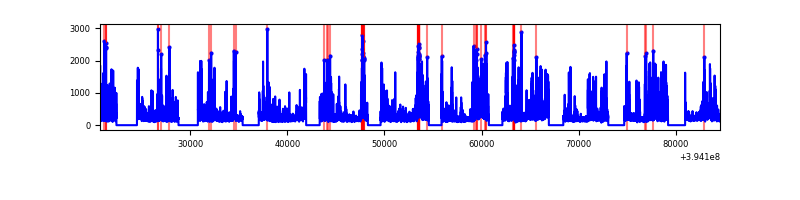 |
| C | 63826 | 47701 | 33 | 33 | 0.05% | 0.07% | 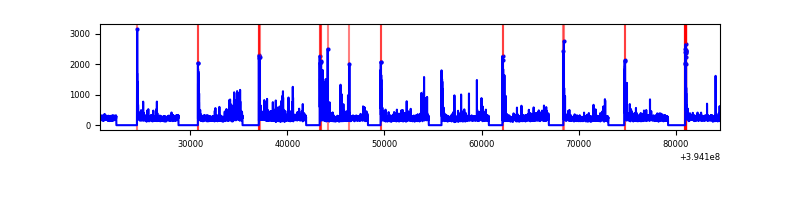 |
| D | 63826 | 47700 | 909 | 909 | 1.42% | 1.91% | 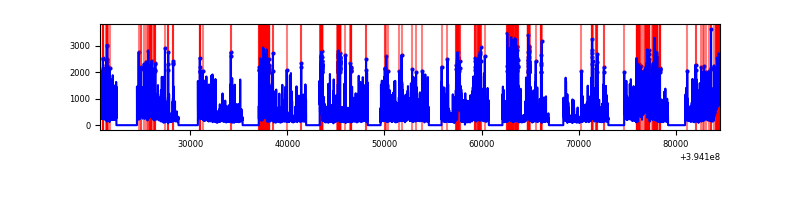 |
Top three noisy pixels from each quadrant. If the there are fewer than three noisy pixels in the level2.evt file, extra rows are filled as -1
| Pixel properties | Quadrant properties | ||||||
|---|---|---|---|---|---|---|---|
| Quadrant | DetID | PixID | Counts | Sigma | Mean | Median | Sigma |
| A | 10 | 83 | 1345362 | 2469.38 | 2420 | 2380 | 543.9 |
| A | 7 | 3 | 261776 | 476.96 | 2420 | 2380 | 543.9 |
| A | 9 | 143 | 82940 | 148.13 | 2420 | 2380 | 543.9 |
| B | 5 | 172 | 2287078 | 4793.6 | 2391 | 2334 | 476.6 |
| B | 5 | 255 | 899406 | 1882.14 | 2391 | 2334 | 476.6 |
| B | 0 | 189 | 763323 | 1596.62 | 2391 | 2334 | 476.6 |
| C | 15 | 214 | 1917915 | 3640.86 | 2311 | 2293 | 526.1 |
| C | 0 | 10 | 1148389 | 2178.29 | 2311 | 2293 | 526.1 |
| C | 0 | 207 | 62265 | 113.98 | 2311 | 2293 | 526.1 |
| D | 12 | 227 | 7228246 | 13101.22 | 2327 | 2258 | 551.6 |
| D | 12 | 235 | 1282496 | 2321.16 | 2327 | 2258 | 551.6 |
| D | 13 | 249 | 880155 | 1591.69 | 2327 | 2258 | 551.6 |
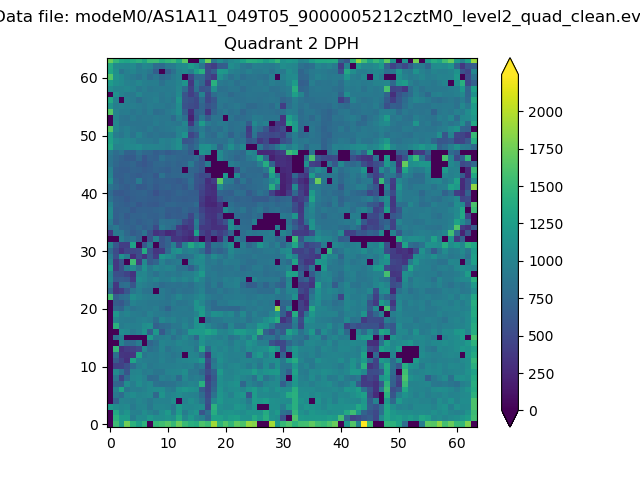
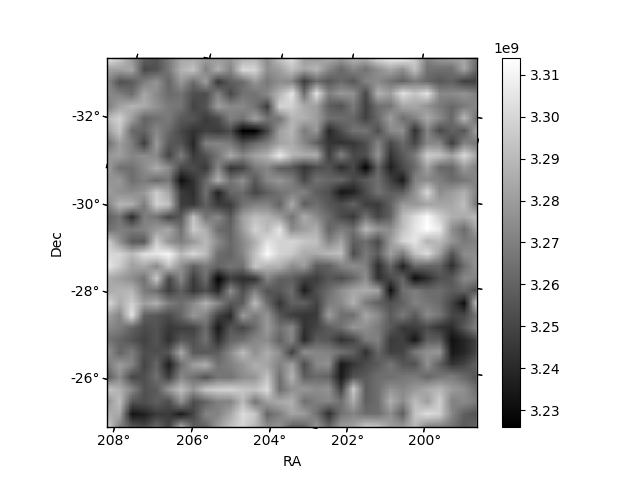
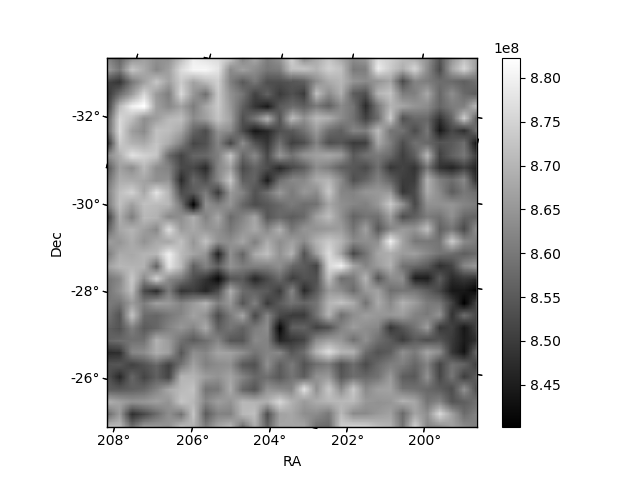
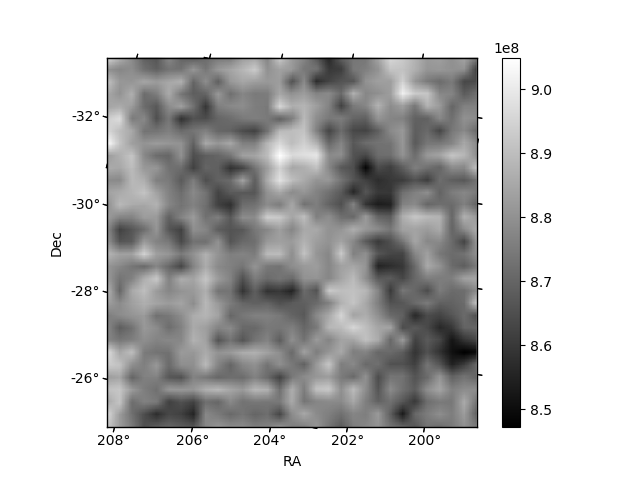
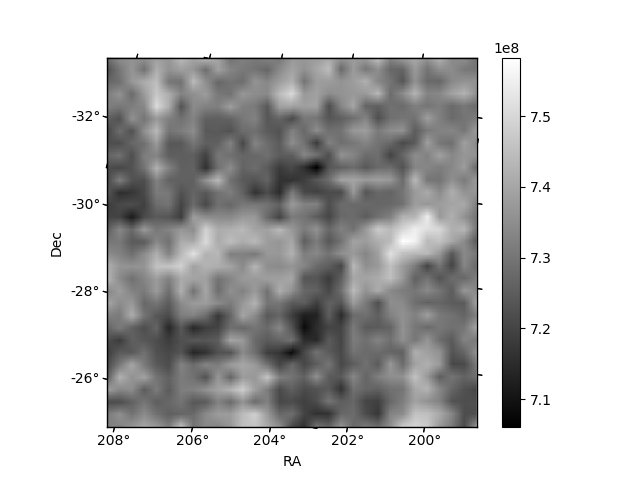
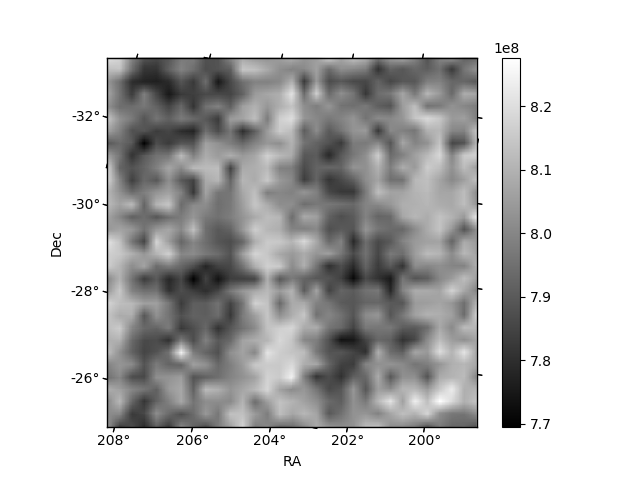
Histogram calculated using DETX and DETY for each event in the final _common_clean file
| Quadrant A | 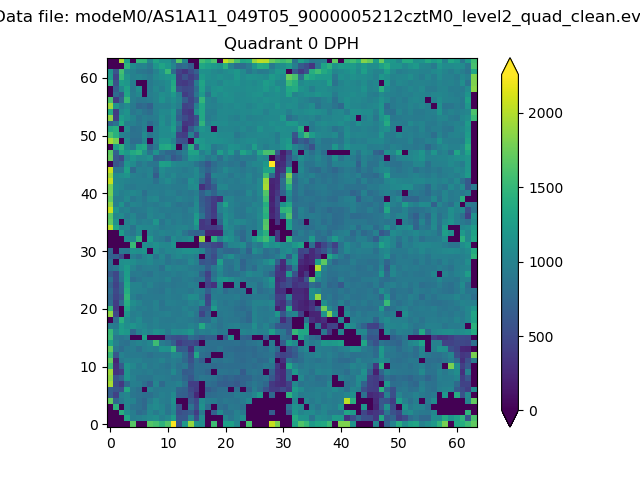 |
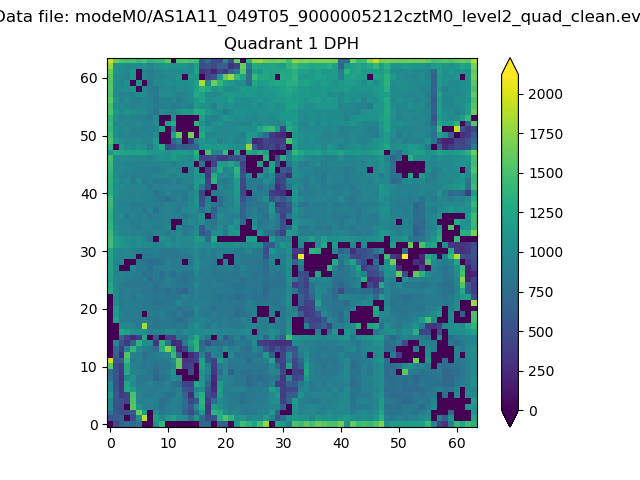 |
Quadrant B |
|---|---|---|---|
| Quadrant D | 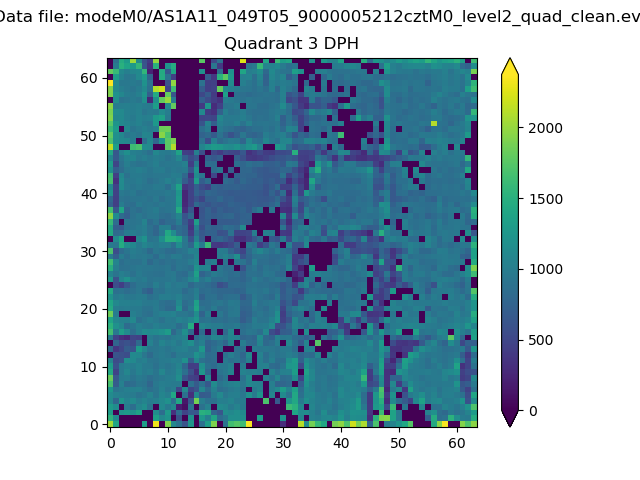 |
 |
Quadrant C |
| Plot type | Count rate plots | Images |
|---|---|---|
| Comparison with Poisson distribution Blue bars denote a histogram of data divided into 1 sec bins. Red curve is a Poisson curve with rate = median count rate of data. |
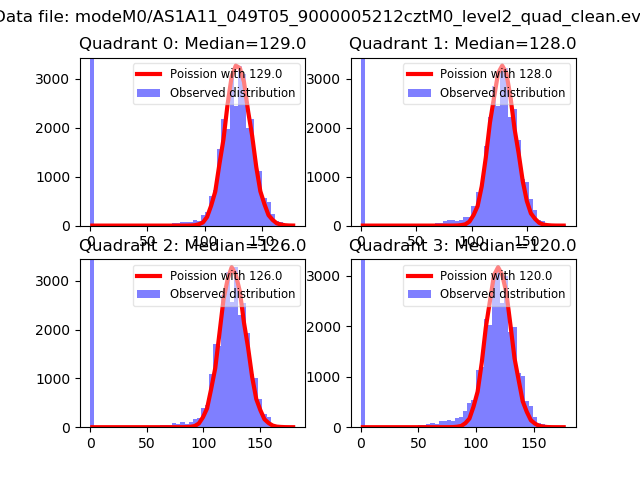 |
 |
| Quadrant-wise count rates Data is divided into 100 sec bins |
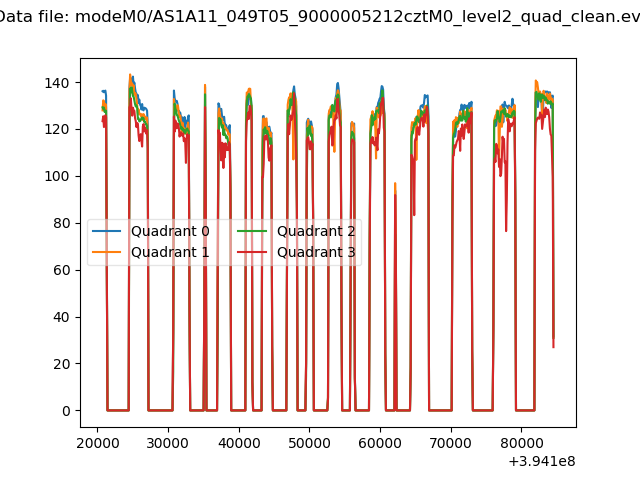 |
|
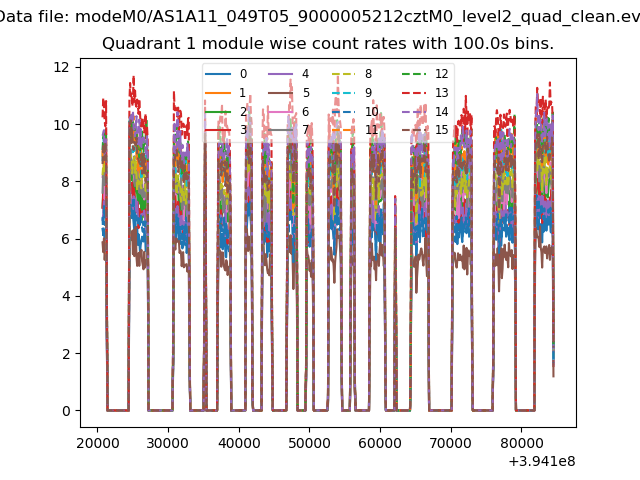
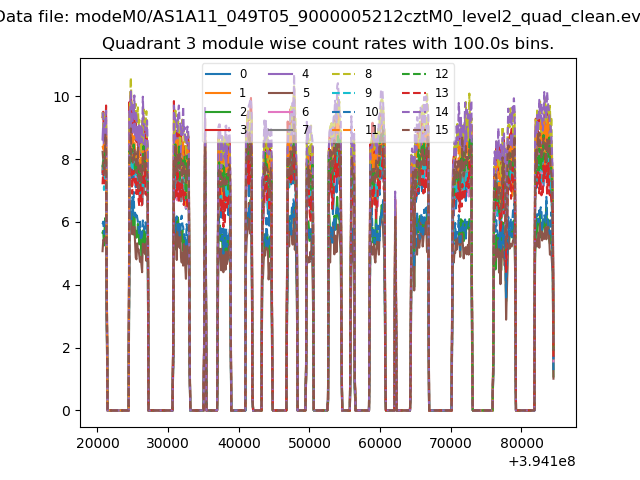
| Module-wise count rates for Quadrant A Data is divided into 100 sec bins |
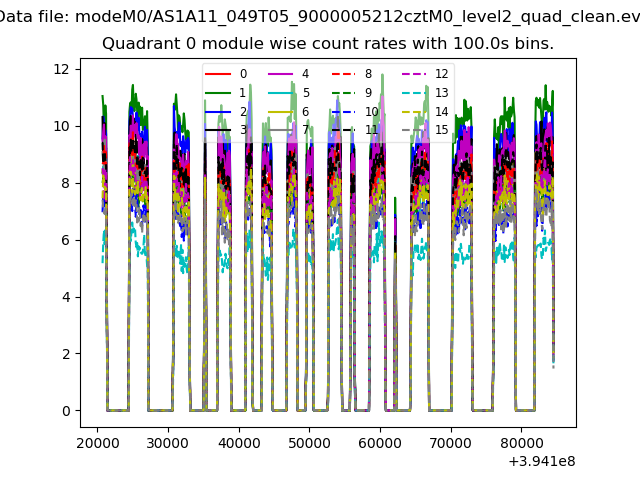 |
 |
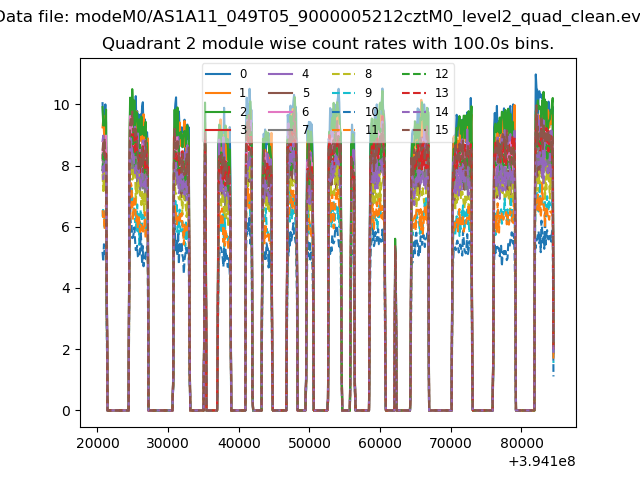
| Module-wise count rates for Quadrant B Data is divided into 100 sec bins |
 |
 |
| Module-wise count rates for Quadrant C Data is divided into 100 sec bins |
 |
 |
| Module-wise count rates for Quadrant D Data is divided into 100 sec bins |
 |
 |
| Parameter | Plot |
|---|---|
| CZT HV Monitor | 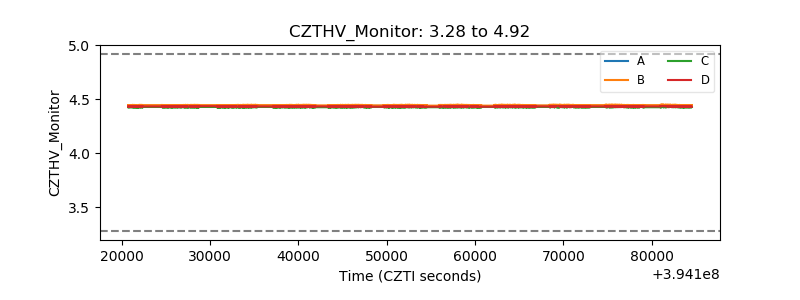 |
| D_VDD | 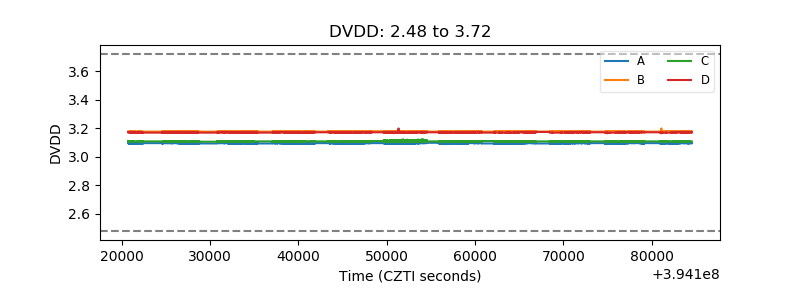 |
| Temperature 1 | 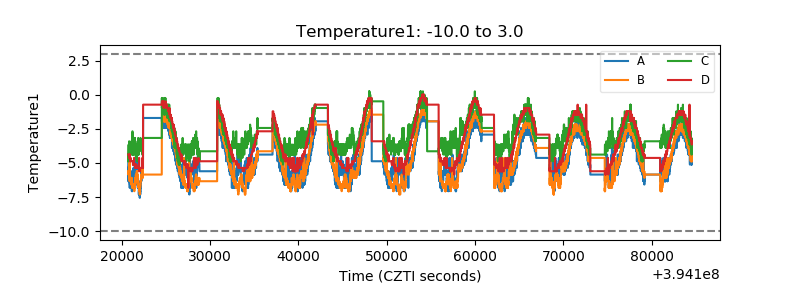 |
| Veto HV Monitor | 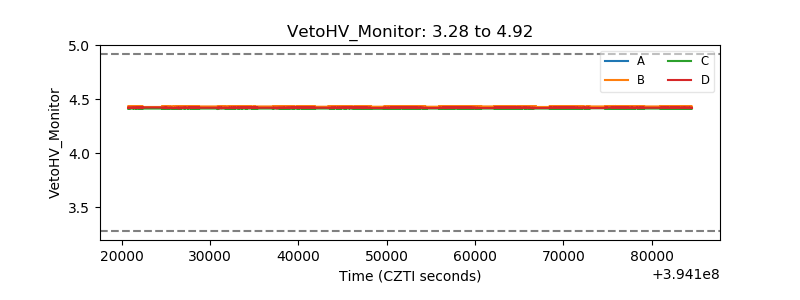 |
| Veto LLD | 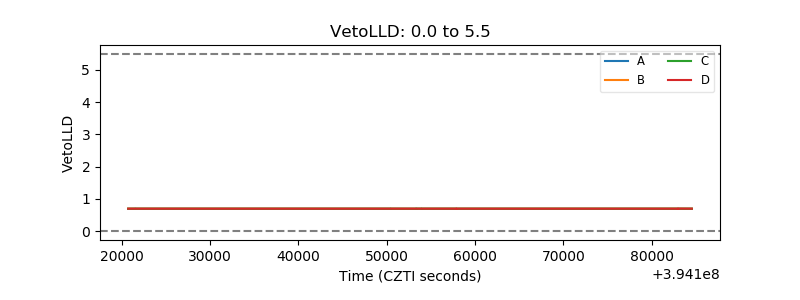 |
| Alpha Counter | 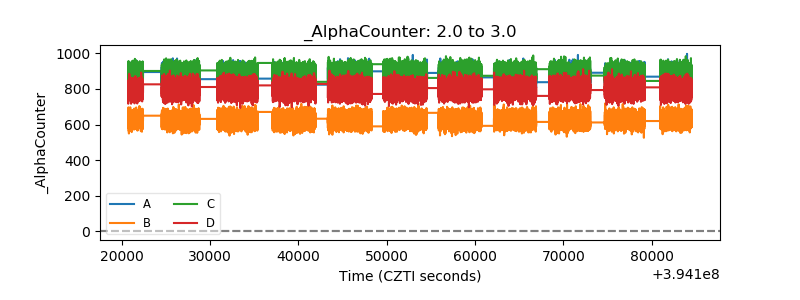 |
| _CPM_Rate | 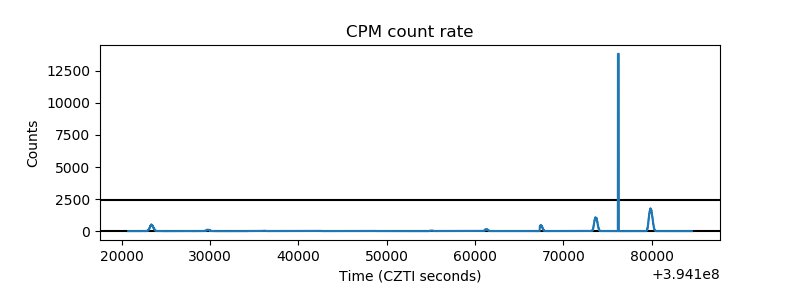 |
| CZT Counter | 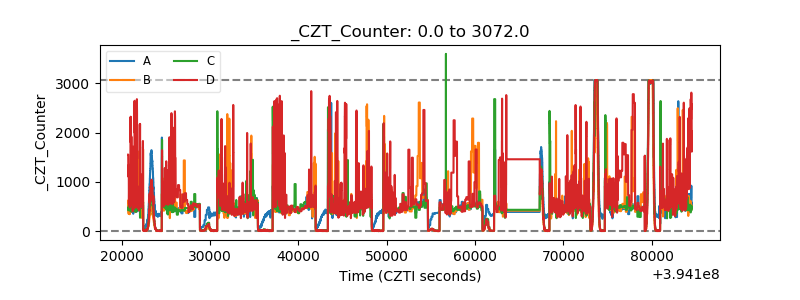 |
| +2.5 Volts monitor | 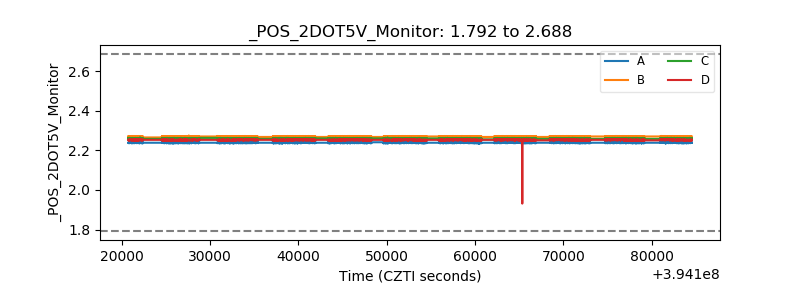 |
| +5 Volts monitor | 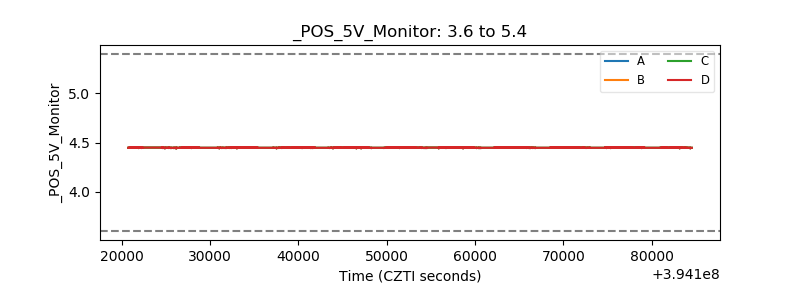 |
| _ROLL_ROT | 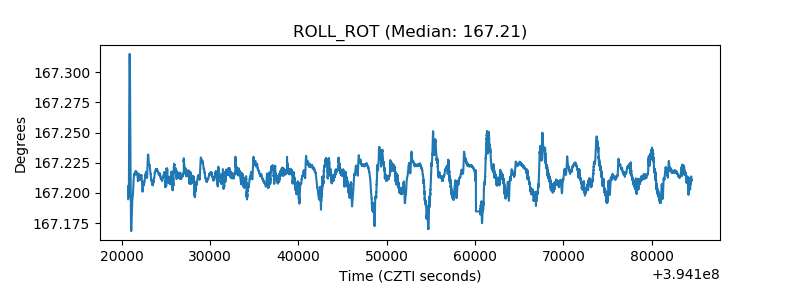 |
| _Roll_DEC | 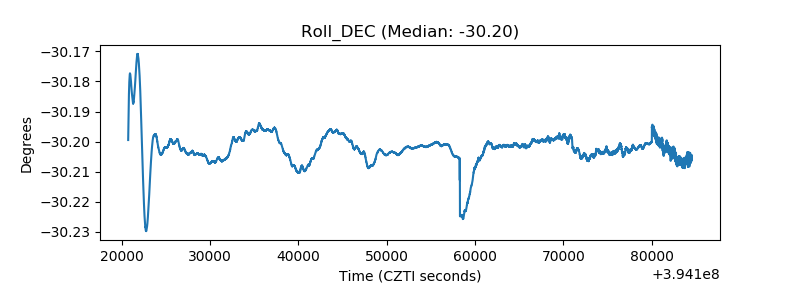 |
| _Roll_RA | 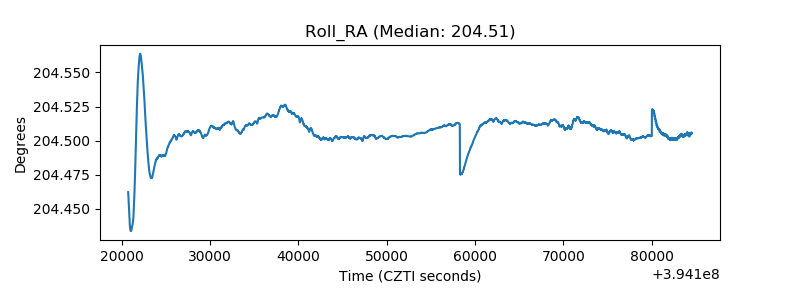 |
| Veto Counter | 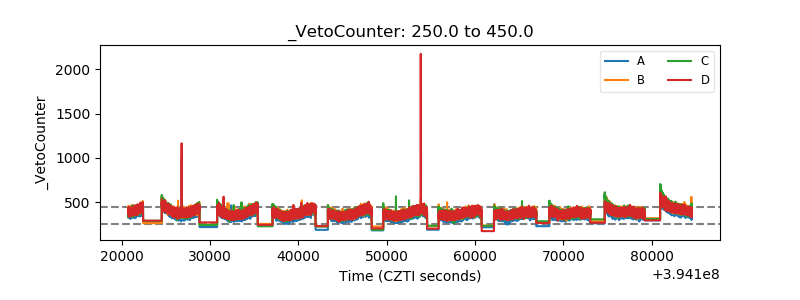 |