| Param | Original file | Final file |
|---|---|---|
| Filename | modeM0/AS1A11_049T04_9000005210_36494cztM0_level2.evt | modeM0/AS1A11_049T04_9000005210_36494cztM0_level2_quad_clean.evt |
| Size (bytes) | 227,698,560 | 43,781,760 |
| Size | 217.2 MB | 41.8 MB |
| Events in quadrant A | 1,137,115 | 310,409 |
| Events in quadrant B | 1,314,029 | 303,336 |
| Events in quadrant C | 1,226,573 | 294,843 |
| Events in quadrant D | 3,071,356 | 262,031 |
| Mode M9 | |||
|---|---|---|---|
| Quadrant | BADHDUFLAG | Total packets | Discarded packets |
| A | 1 | 139890339834664 | 46 |
| B | 1 | -1 | -1 |
| C | 1 | -1 | -1 |
| D | 1 | -1 | -1 |
| Mode SS | |||
|---|---|---|---|
| Quadrant | BADHDUFLAG | Total packets | Discarded packets |
| A | 0 | 42 | 0 |
| B | 0 | 42 | 0 |
| C | 0 | 42 | 0 |
| D | 0 | 42 | 0 |
| Mode M0 | |||
|---|---|---|---|
| Quadrant | BADHDUFLAG | Total packets | Discarded packets |
| A | 0 | 4674 | 1 |
| B | 0 | 5285 | 1 |
| C | 0 | 4939 | 1 |
| D | 0 | 10641 | 1 |
| Quadrant | Total seconds | Saturated seconds | Saturation percentage |
|---|---|---|---|
| A | 2140 | 4 | 0.186916% |
| B | 2140 | 59 | 2.757009% |
| C | 2140 | 40 | 1.869159% |
| D | 2140 | 390 | 18.224299% |
Noise dominated data is calculated using 1-second bins in cleaned event files. If a bin has >2000 counts, and if more than 50% of those come from <1% of pixels, then it is considered to be noise-dominated and hence unusable.
| Quadrant | # 1 sec bins | Bins with >0 counts | Bins with >2000 counts | High rate bins dominated by noise | Noise dominated (total time) | Noise dominated (detector-on time) | Marked lightcurve |
|---|---|---|---|---|---|---|---|
| A | 2140 | 2140 | 0 | 0 | 0.00% | 0.00% | 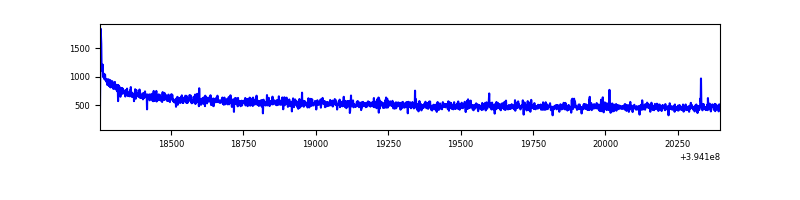 |
| B | 2140 | 2140 | 42 | 42 | 1.96% | 1.96% | 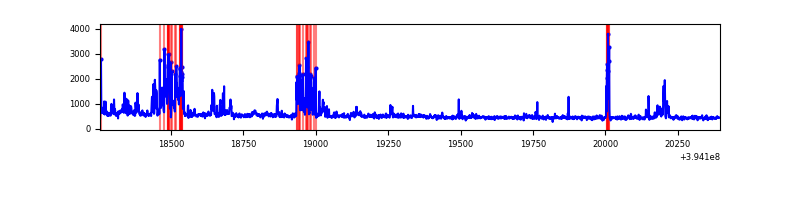 |
| C | 2140 | 2140 | 29 | 29 | 1.36% | 1.36% | 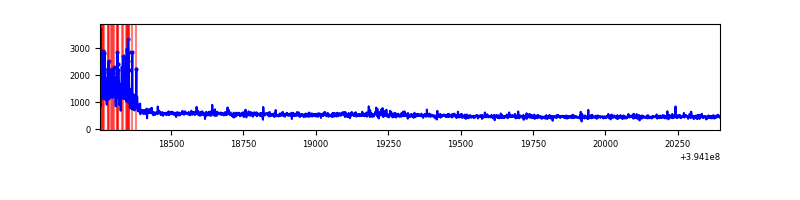 |
| D | 2140 | 2140 | 480 | 480 | 22.43% | 22.43% | 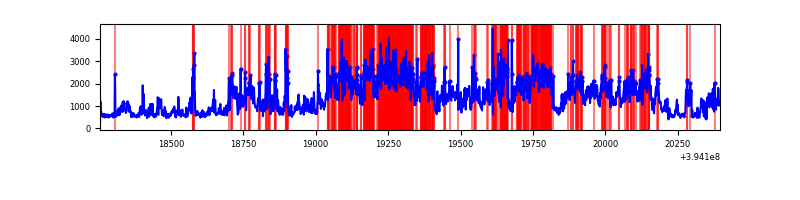 |
Top three noisy pixels from each quadrant. If the there are fewer than three noisy pixels in the level2.evt file, extra rows are filled as -1
| Pixel properties | Quadrant properties | ||||||
|---|---|---|---|---|---|---|---|
| Quadrant | DetID | PixID | Counts | Sigma | Mean | Median | Sigma |
| A | 10 | 83 | 94194 | 1694.87 | 267 | 262 | 55.4 |
| A | 13 | 254 | 3701 | 62.05 | 267 | 262 | 55.4 |
| A | 12 | 189 | 2797 | 45.74 | 267 | 262 | 55.4 |
| B | 5 | 172 | 229517 | 4624.77 | 254 | 249 | 49.6 |
| B | 15 | 85 | 25830 | 516.02 | 254 | 249 | 49.6 |
| B | 5 | 255 | 25153 | 502.36 | 254 | 249 | 49.6 |
| C | 0 | 10 | 167617 | 2873.56 | 247 | 249 | 58.2 |
| C | 15 | 214 | 94303 | 1614.83 | 247 | 249 | 58.2 |
| C | 13 | 61 | 1699 | 24.9 | 247 | 249 | 58.2 |
| D | 12 | 235 | 1120426 | 18839.43 | 243 | 236 | 59.5 |
| D | 12 | 227 | 784955 | 13197.46 | 243 | 236 | 59.5 |
| D | 13 | 171 | 86568 | 1451.94 | 243 | 236 | 59.5 |
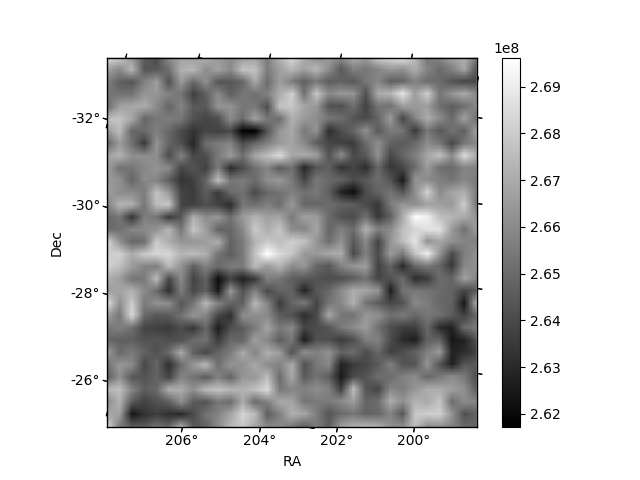
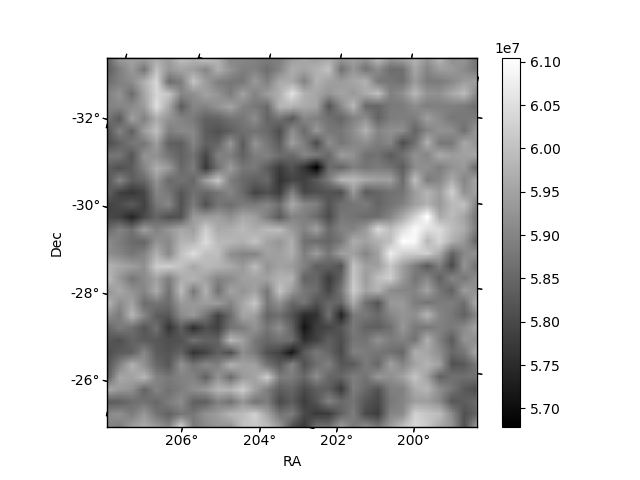
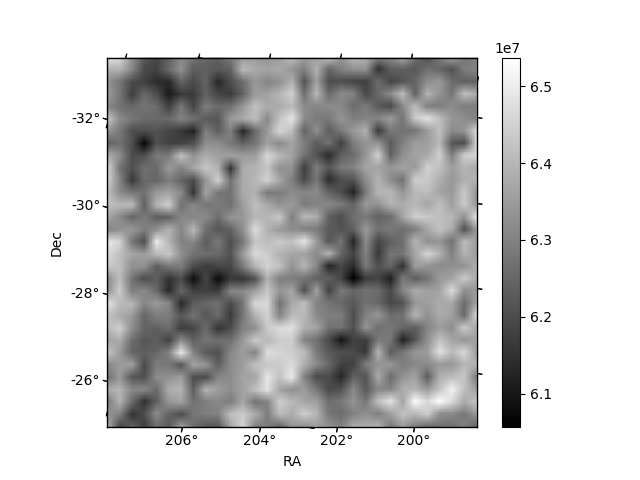
Histogram calculated using DETX and DETY for each event in the final _common_clean file
| Quadrant A | 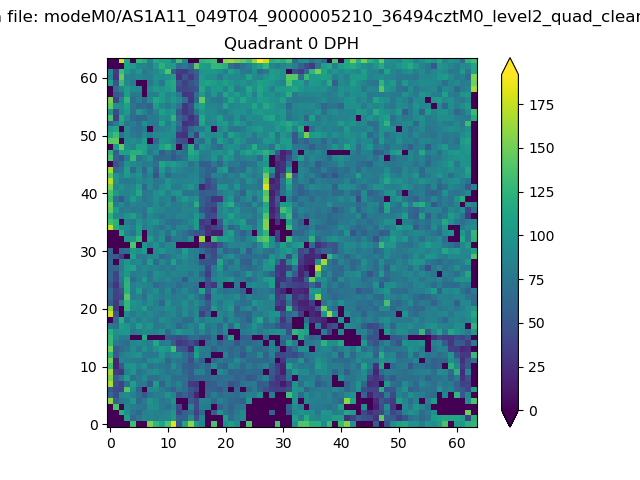 |
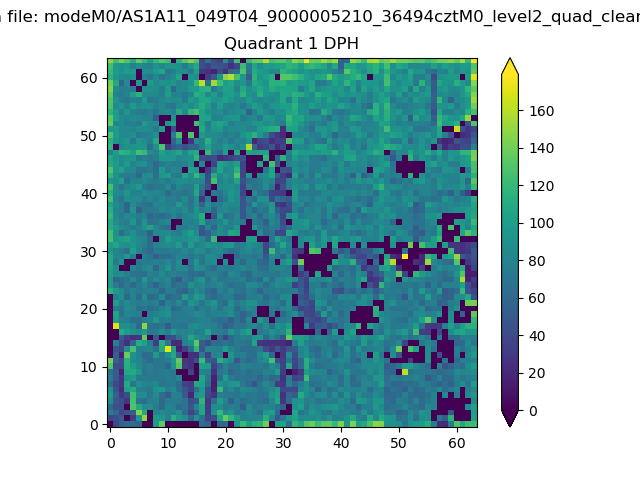 |
Quadrant B |
|---|---|---|---|
| Quadrant D | 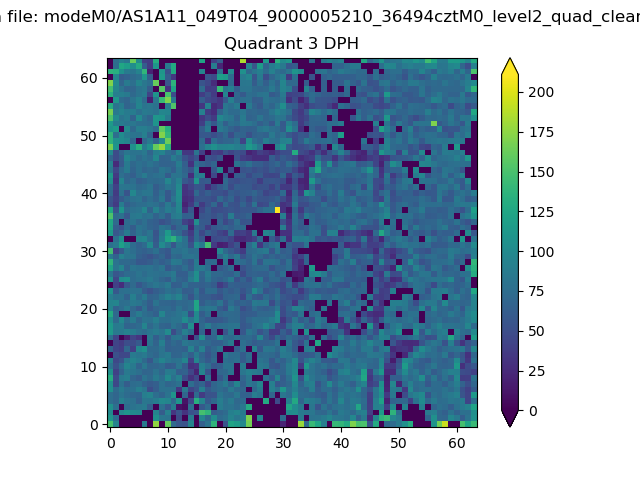 |
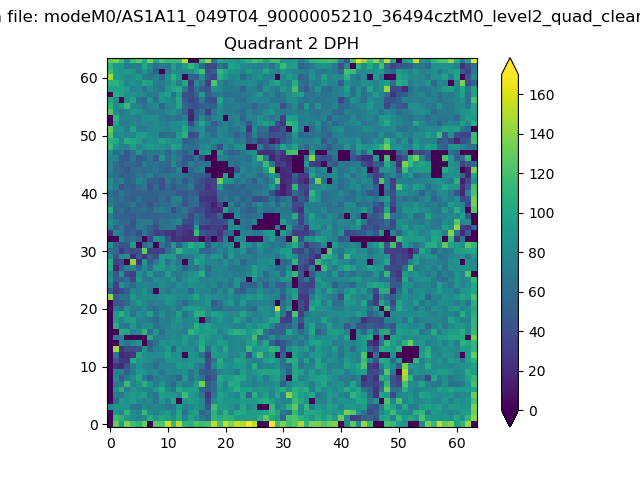 |
Quadrant C |
| Plot type | Count rate plots | Images |
|---|---|---|
| Comparison with Poisson distribution Blue bars denote a histogram of data divided into 1 sec bins. Red curve is a Poisson curve with rate = median count rate of data. |
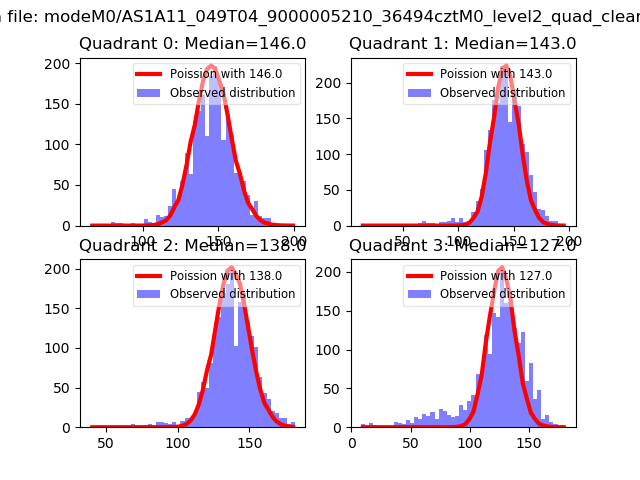 |
 |
| Quadrant-wise count rates Data is divided into 100 sec bins |
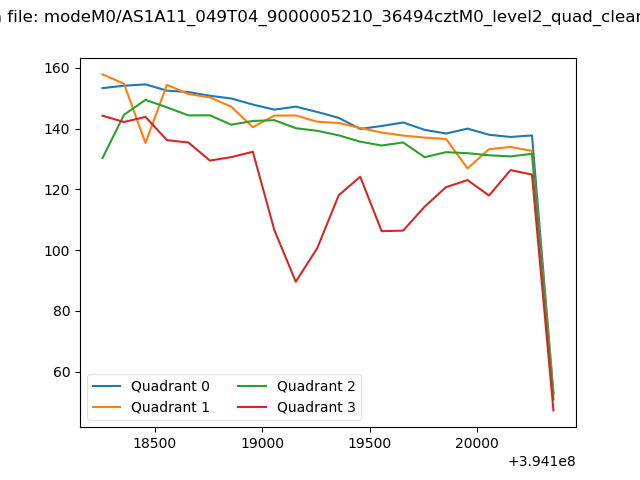 |
|
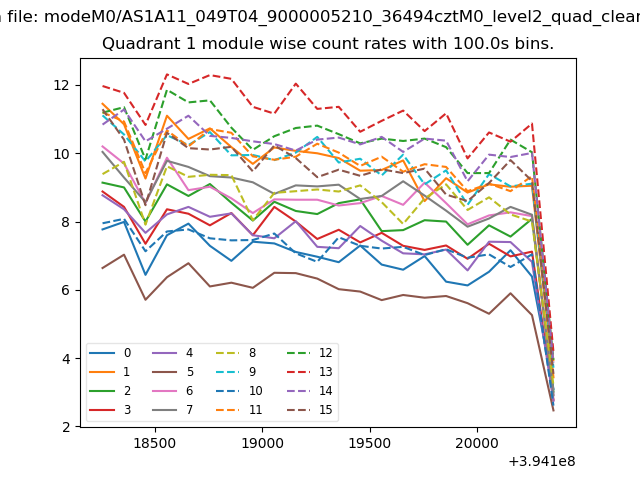
| Module-wise count rates for Quadrant A Data is divided into 100 sec bins |
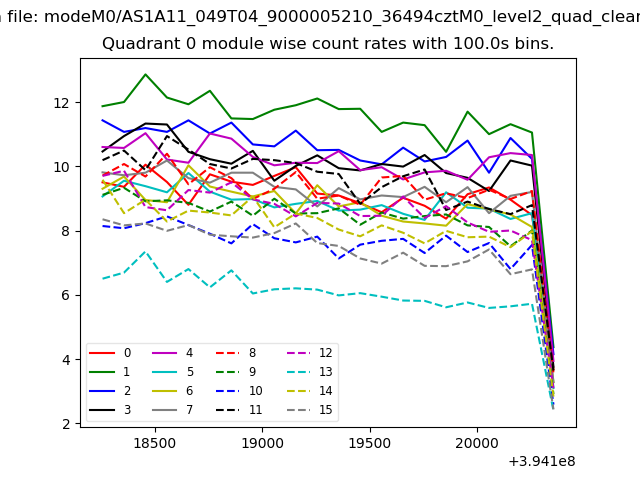 |
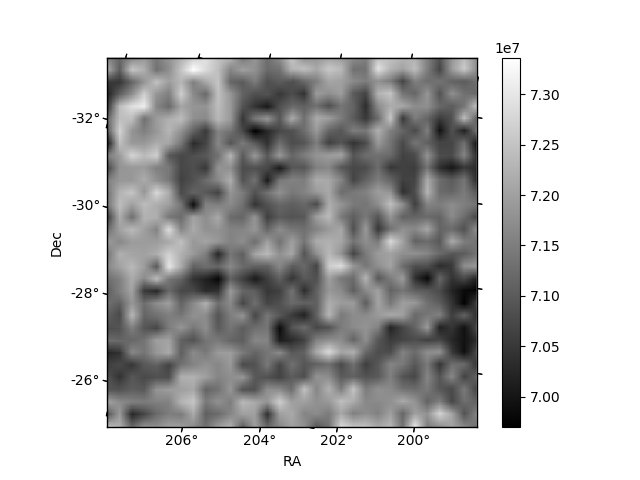 |
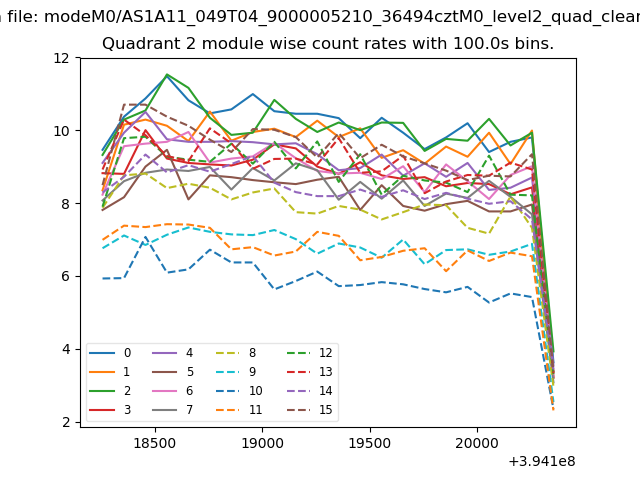
| Module-wise count rates for Quadrant B Data is divided into 100 sec bins |
 |
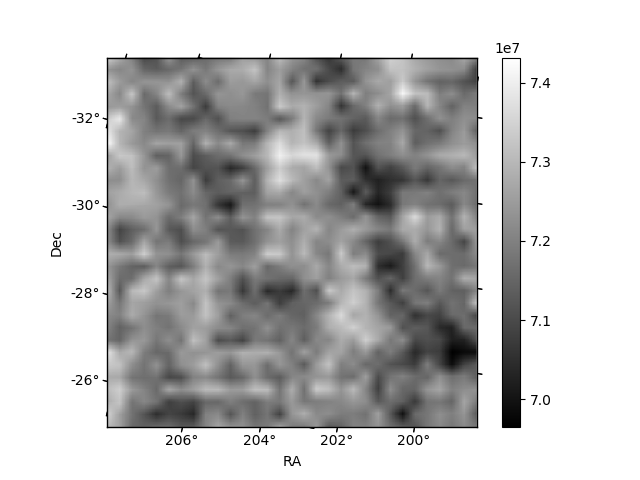 |
| Module-wise count rates for Quadrant C Data is divided into 100 sec bins |
 |
 |
| Module-wise count rates for Quadrant D Data is divided into 100 sec bins |
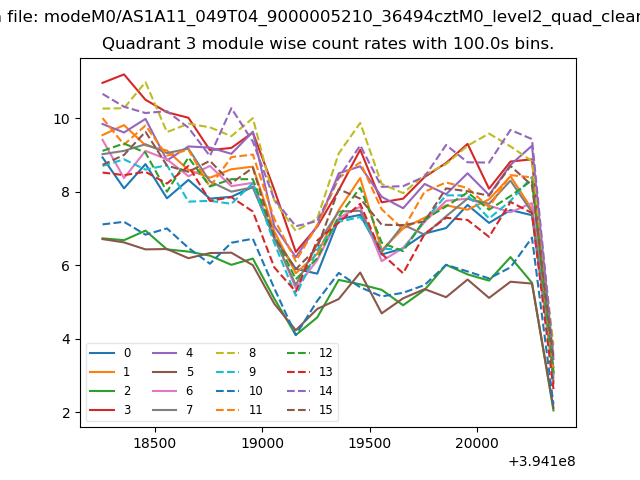 |
 |
| Parameter | Plot |
|---|---|
| CZT HV Monitor | 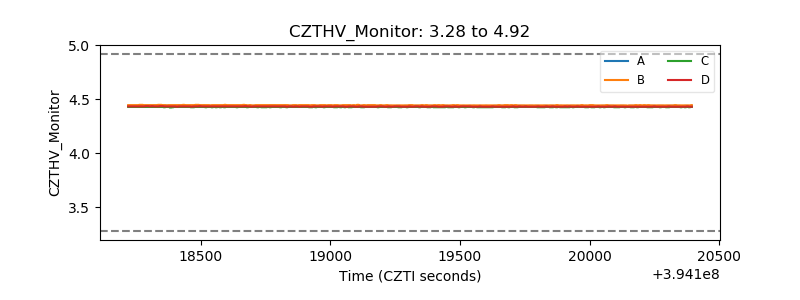 |
| D_VDD | 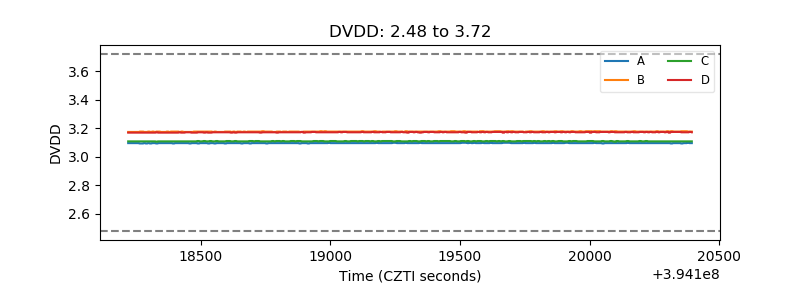 |
| Temperature 1 | 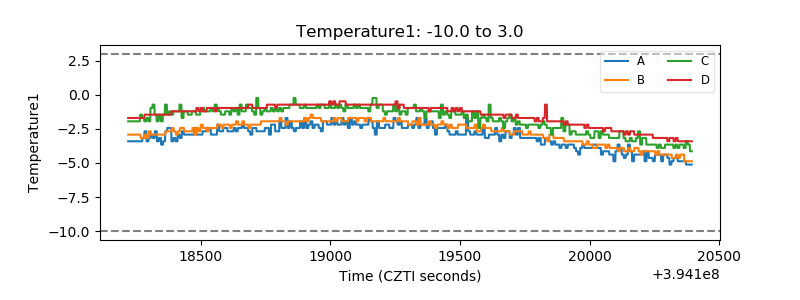 |
| Veto HV Monitor | 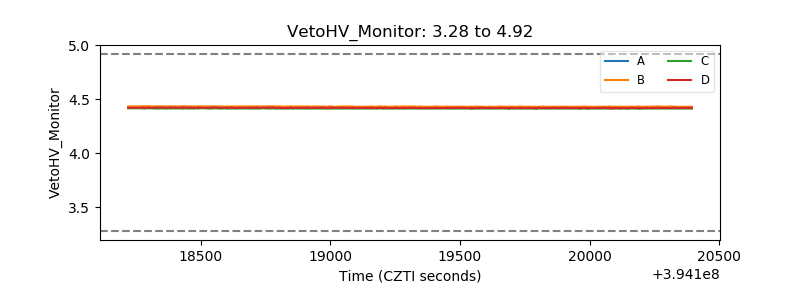 |
| Veto LLD | 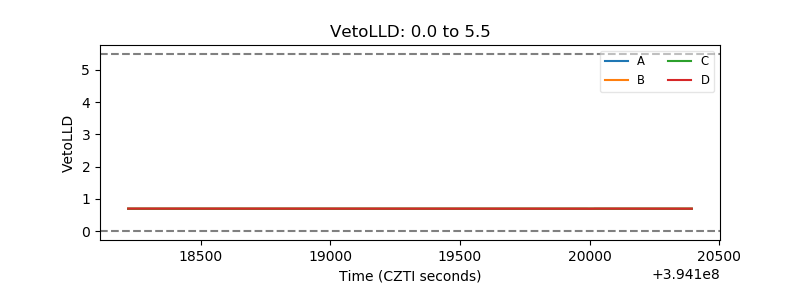 |
| Alpha Counter | 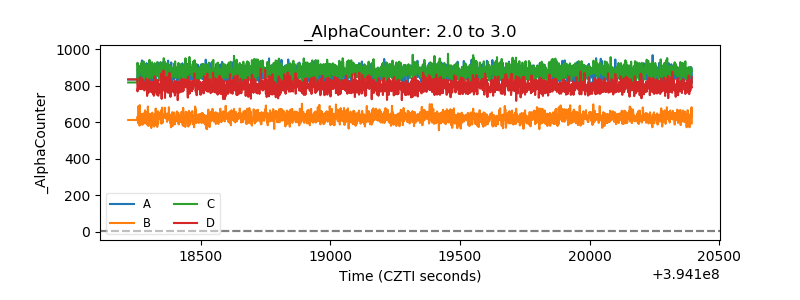 |
| _CPM_Rate | 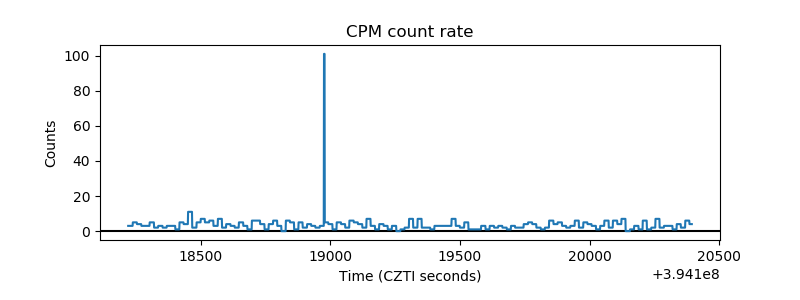 |
| CZT Counter | 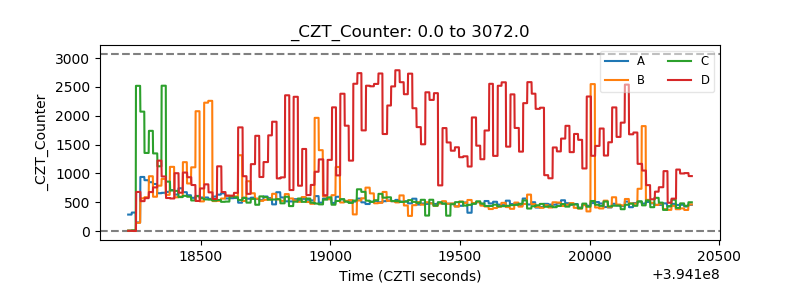 |
| +2.5 Volts monitor | 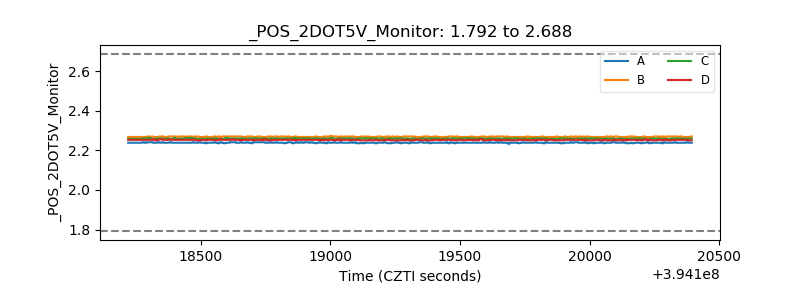 |
| +5 Volts monitor |  |
| _ROLL_ROT |  |
| _Roll_DEC | 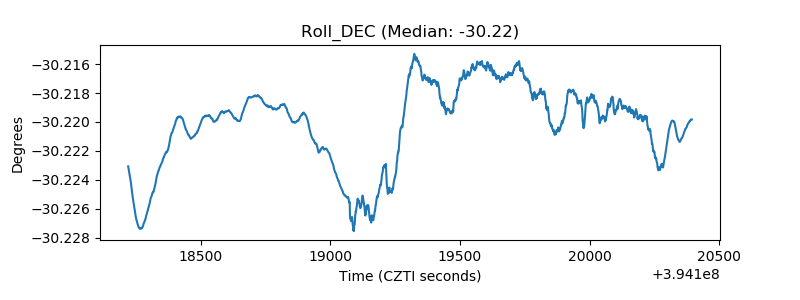 |
| _Roll_RA | 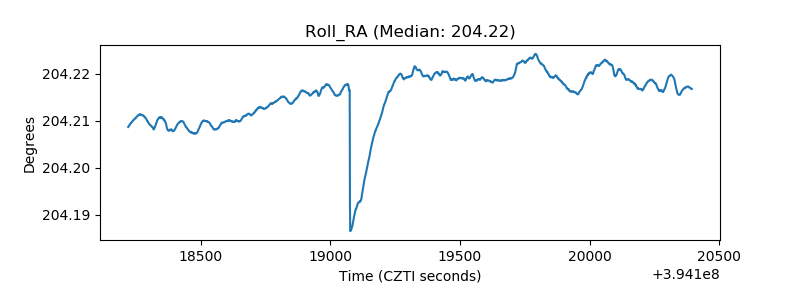 |
| Veto Counter | 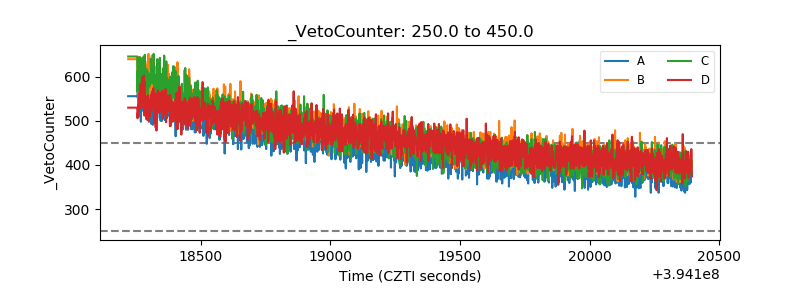 |