| Param | Original file | Final file |
|---|---|---|
| Filename | modeM0/AS1A11_049T04_9000005210_36493cztM0_level2.evt | modeM0/AS1A11_049T04_9000005210_36493cztM0_level2_quad_clean.evt |
| Size (bytes) | 419,627,520 | 93,637,440 |
| Size | 400.2 MB | 89.3 MB |
| Events in quadrant A | 2,681,769 | 647,225 |
| Events in quadrant B | 3,400,483 | 628,740 |
| Events in quadrant C | 2,936,658 | 615,195 |
| Events in quadrant D | 3,352,611 | 596,696 |
| Mode M9 | |||
|---|---|---|---|
| Quadrant | BADHDUFLAG | Total packets | Discarded packets |
| A | 0 | 21 | 0 |
| B | 0 | 21 | 0 |
| C | 0 | 21 | 0 |
| D | 0 | 22 | 0 |
| Mode SS | |||
|---|---|---|---|
| Quadrant | BADHDUFLAG | Total packets | Discarded packets |
| A | 0 | 102 | 0 |
| B | 0 | 102 | 0 |
| C | 0 | 102 | 0 |
| D | 0 | 102 | 0 |
| Mode M0 | |||
|---|---|---|---|
| Quadrant | BADHDUFLAG | Total packets | Discarded packets |
| A | 0 | 10905 | 3 |
| B | 0 | 13247 | 2 |
| C | 0 | 11658 | 2 |
| D | 0 | 13263 | 2 |
| Quadrant | Total seconds | Saturated seconds | Saturation percentage |
|---|---|---|---|
| A | 4955 | 10 | 0.201816% |
| B | 4955 | 223 | 4.500505% |
| C | 4955 | 134 | 2.704339% |
| D | 4955 | 160 | 3.229062% |
Noise dominated data is calculated using 1-second bins in cleaned event files. If a bin has >2000 counts, and if more than 50% of those come from <1% of pixels, then it is considered to be noise-dominated and hence unusable.
| Quadrant | # 1 sec bins | Bins with >0 counts | Bins with >2000 counts | High rate bins dominated by noise | Noise dominated (total time) | Noise dominated (detector-on time) | Marked lightcurve |
|---|---|---|---|---|---|---|---|
| A | 7078 | 4956 | 0 | 0 | 0.00% | 0.00% | 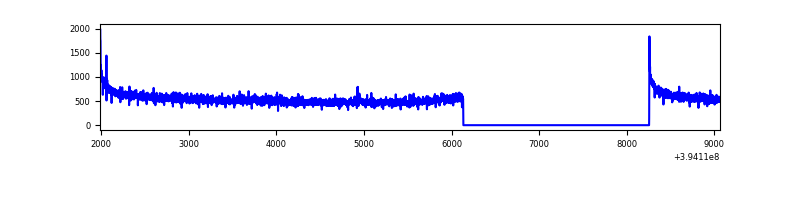 |
| B | 7078 | 4956 | 154 | 154 | 2.18% | 3.11% | 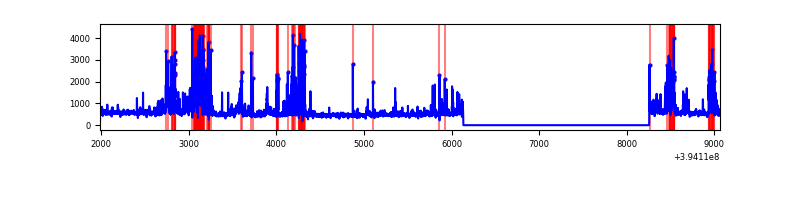 |
| C | 7078 | 4956 | 97 | 97 | 1.37% | 1.96% | 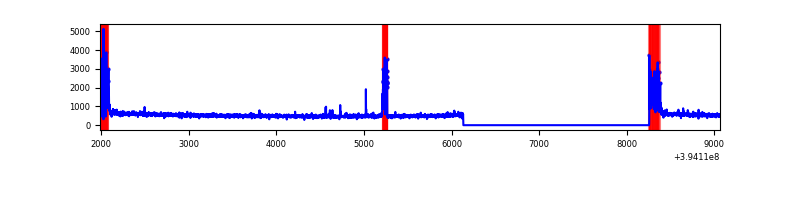 |
| D | 7078 | 4956 | 114 | 114 | 1.61% | 2.30% | 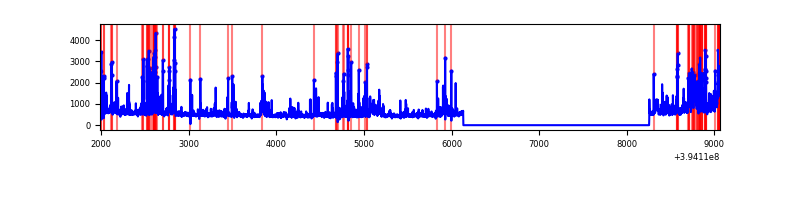 |
Top three noisy pixels from each quadrant. If the there are fewer than three noisy pixels in the level2.evt file, extra rows are filled as -1
| Pixel properties | Quadrant properties | ||||||
|---|---|---|---|---|---|---|---|
| Quadrant | DetID | PixID | Counts | Sigma | Mean | Median | Sigma |
| A | 10 | 83 | 198848 | 1594.27 | 630 | 621 | 124.3 |
| A | 13 | 6 | 34081 | 269.11 | 630 | 621 | 124.3 |
| A | 13 | 254 | 7627 | 56.35 | 630 | 621 | 124.3 |
| B | 5 | 172 | 814765 | 7130.0 | 603 | 588 | 114.2 |
| B | 5 | 255 | 106624 | 928.59 | 603 | 588 | 114.2 |
| B | 0 | 189 | 31915 | 274.34 | 603 | 588 | 114.2 |
| C | 0 | 10 | 337965 | 2496.62 | 587 | 593 | 135.1 |
| C | 15 | 214 | 213763 | 1577.5 | 587 | 593 | 135.1 |
| C | 6 | 255 | 92774 | 682.16 | 587 | 593 | 135.1 |
| D | 12 | 227 | 281948 | 1952.79 | 600 | 585 | 144.1 |
| D | 13 | 249 | 217626 | 1506.36 | 600 | 585 | 144.1 |
| D | 12 | 235 | 100437 | 693.02 | 600 | 585 | 144.1 |
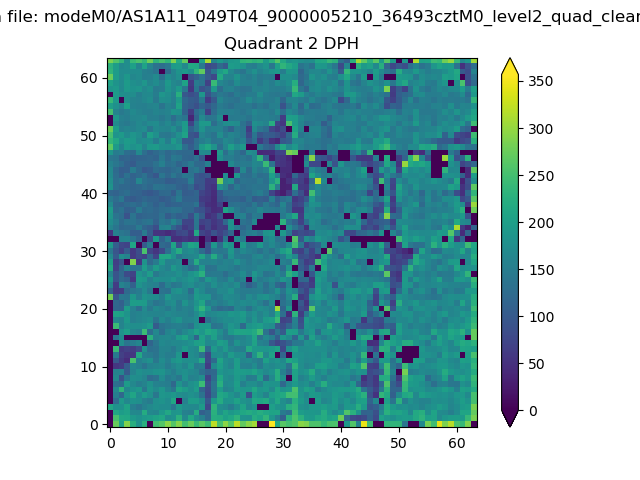
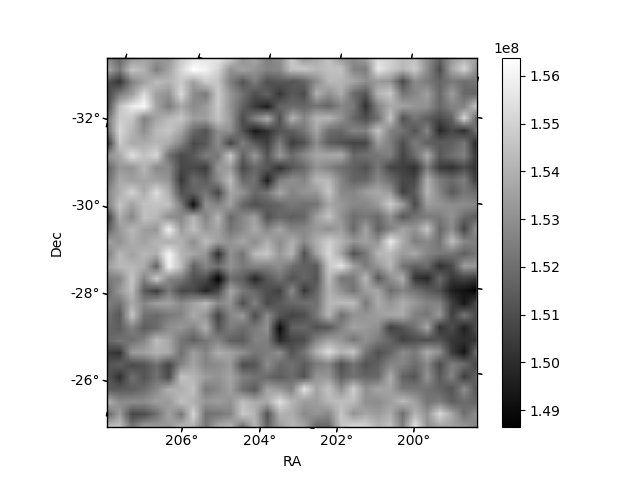
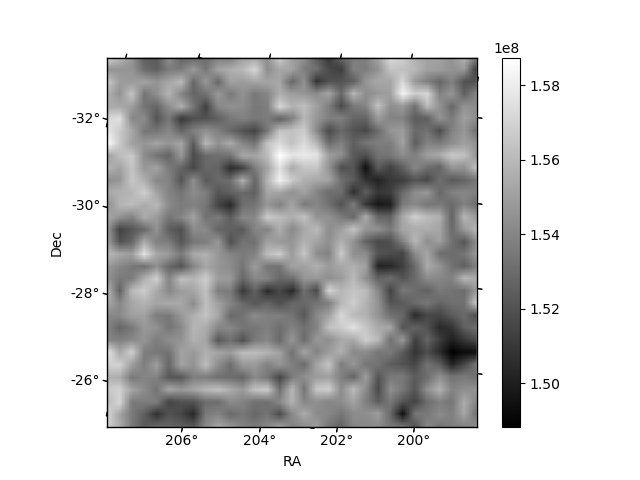
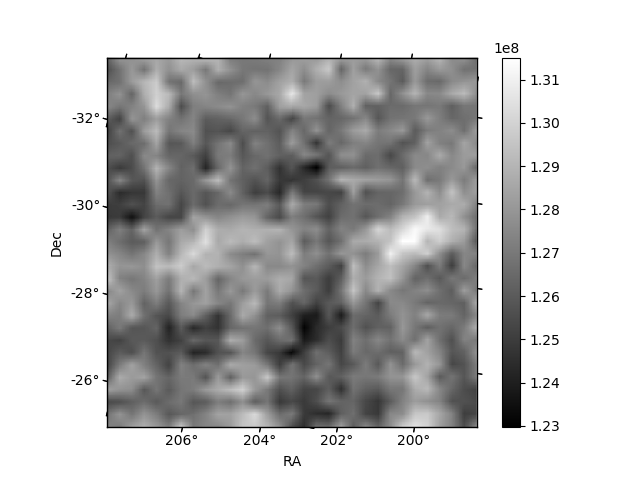
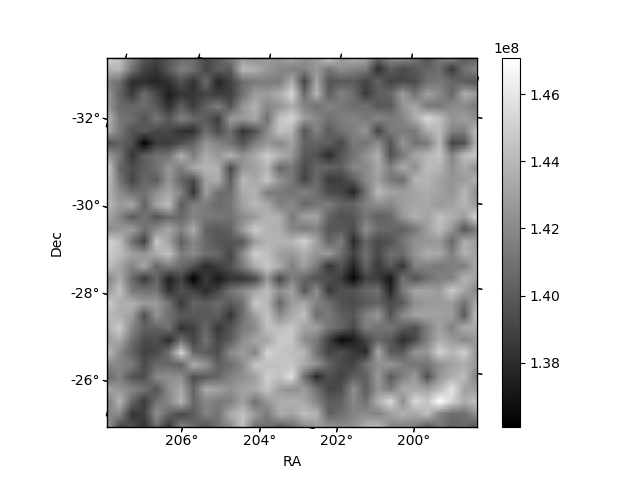
Histogram calculated using DETX and DETY for each event in the final _common_clean file
| Quadrant A | 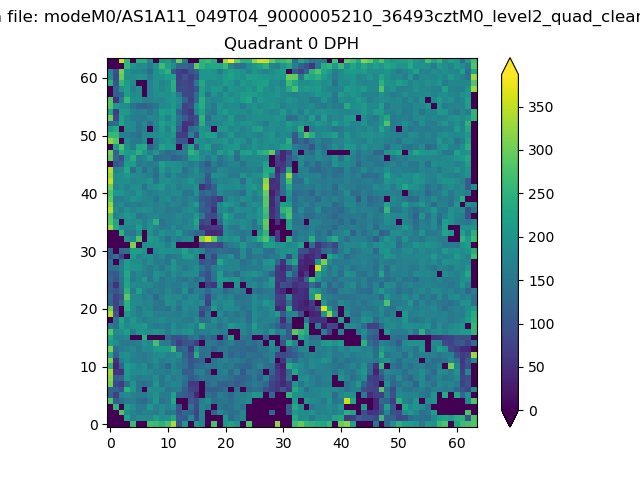 |
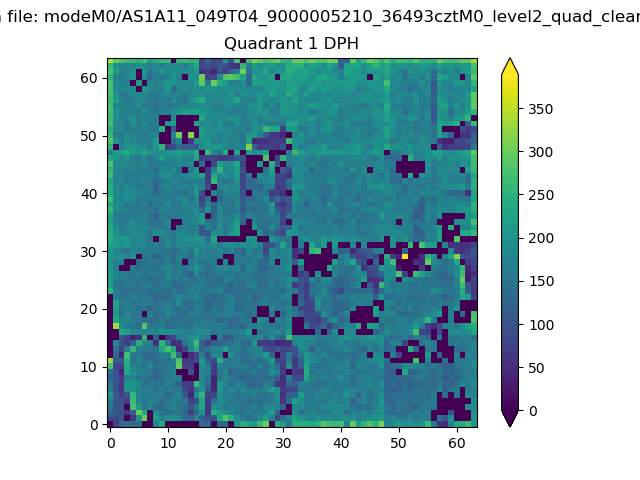 |
Quadrant B |
|---|---|---|---|
| Quadrant D | 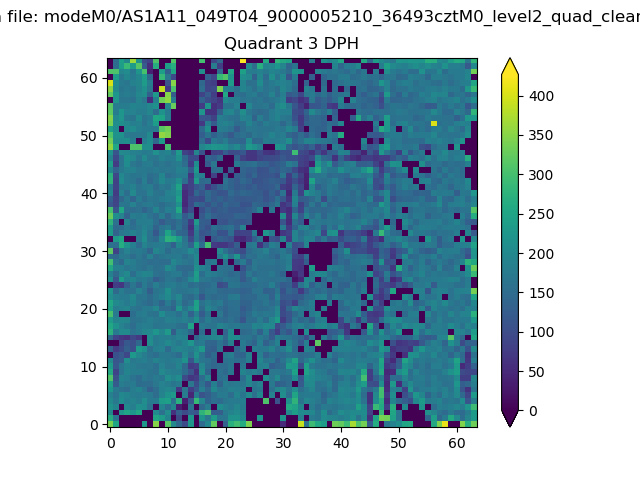 |
 |
Quadrant C |
| Plot type | Count rate plots | Images |
|---|---|---|
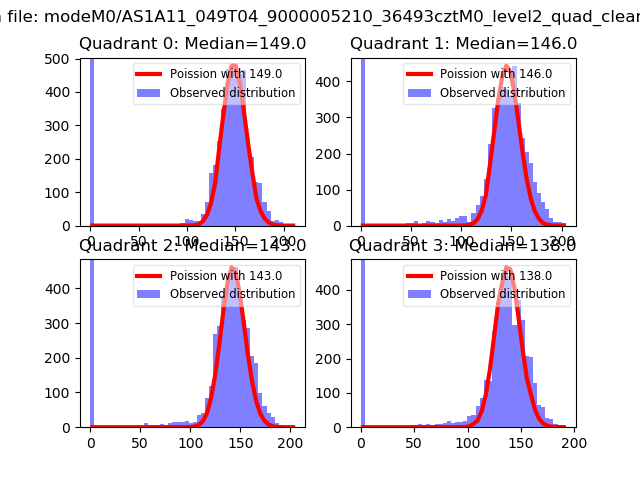
| Comparison with Poisson distribution Blue bars denote a histogram of data divided into 1 sec bins. Red curve is a Poisson curve with rate = median count rate of data. |
 |
 |
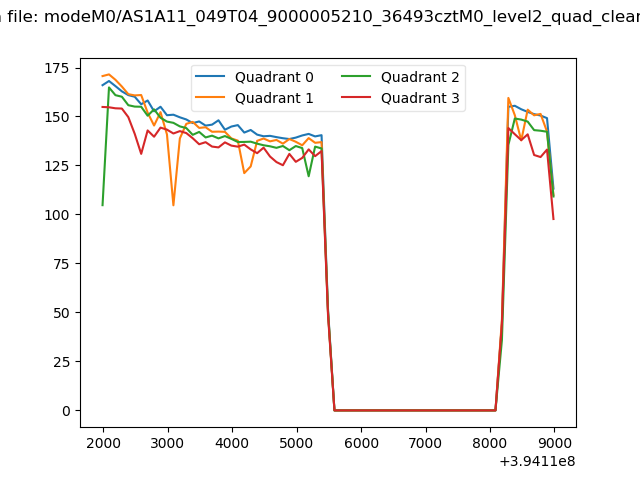
| Quadrant-wise count rates Data is divided into 100 sec bins |
 |
|
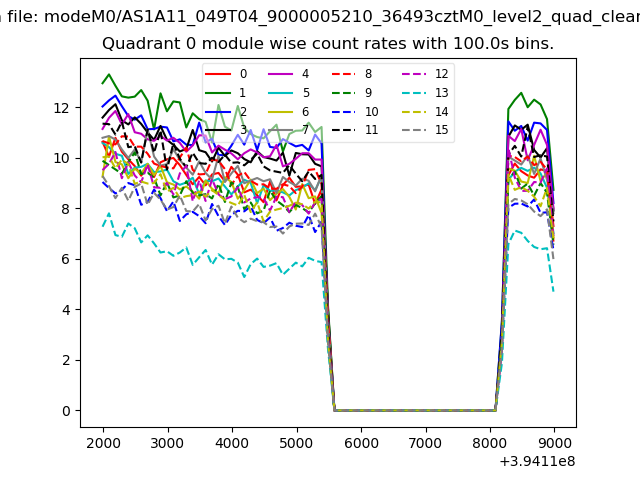
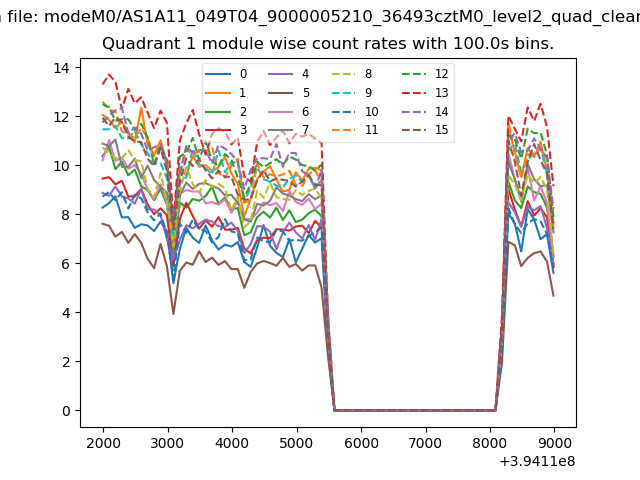
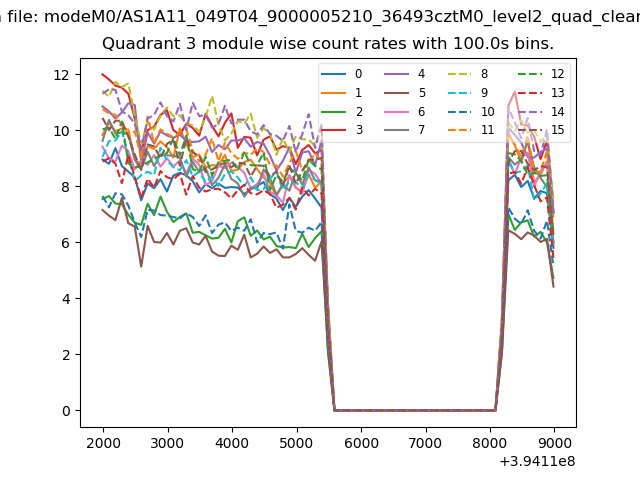
| Module-wise count rates for Quadrant A Data is divided into 100 sec bins |
 |
 |
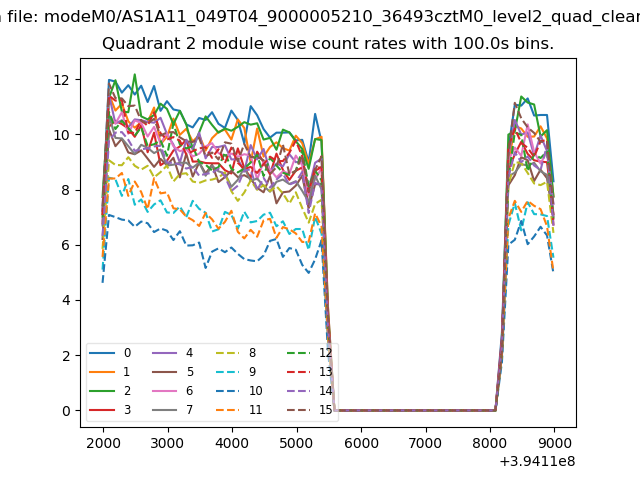
| Module-wise count rates for Quadrant B Data is divided into 100 sec bins |
 |
 |
| Module-wise count rates for Quadrant C Data is divided into 100 sec bins |
 |
 |
| Module-wise count rates for Quadrant D Data is divided into 100 sec bins |
 |
 |
| Parameter | Plot |
|---|---|
| CZT HV Monitor | 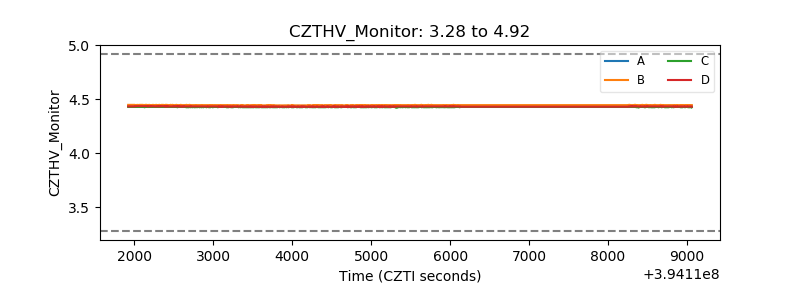 |
| D_VDD | 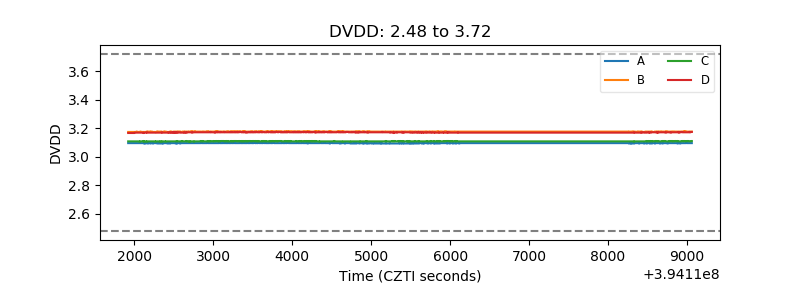 |
| Temperature 1 | 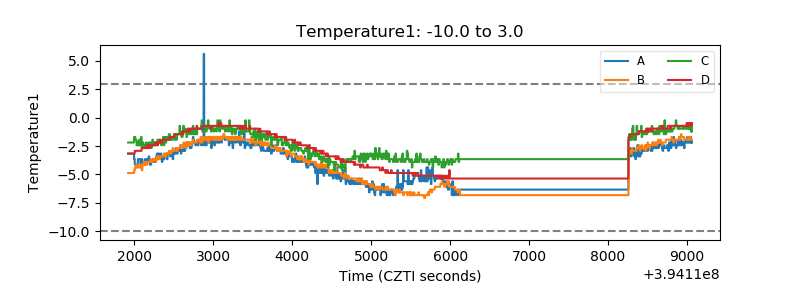 |
| Veto HV Monitor | 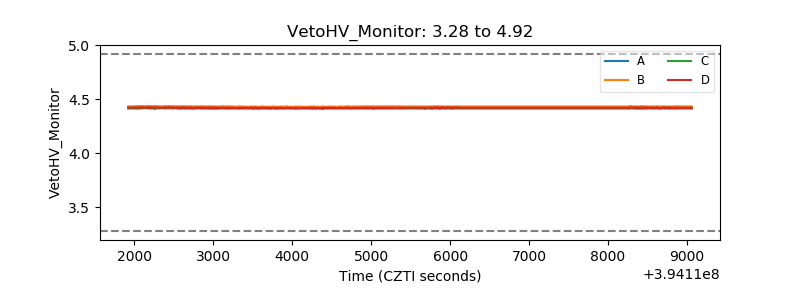 |
| Veto LLD | 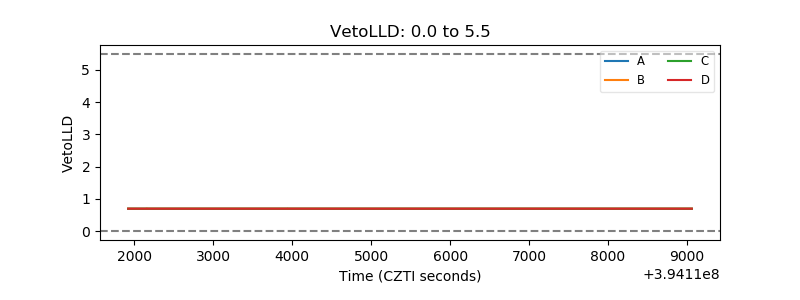 |
| Alpha Counter | 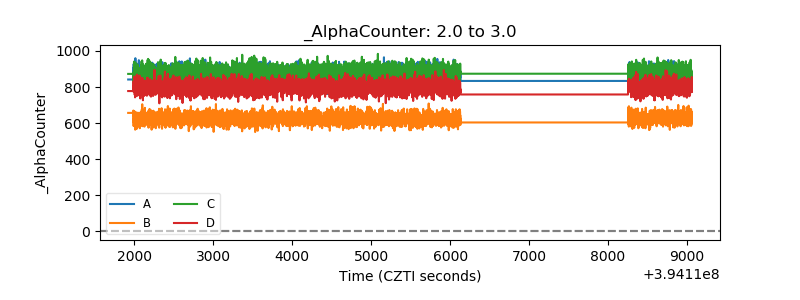 |
| _CPM_Rate | 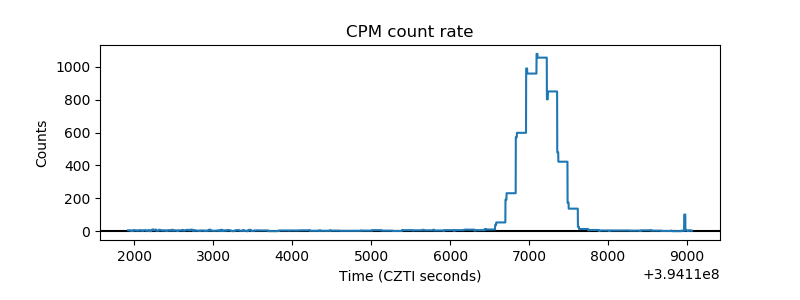 |
| CZT Counter | 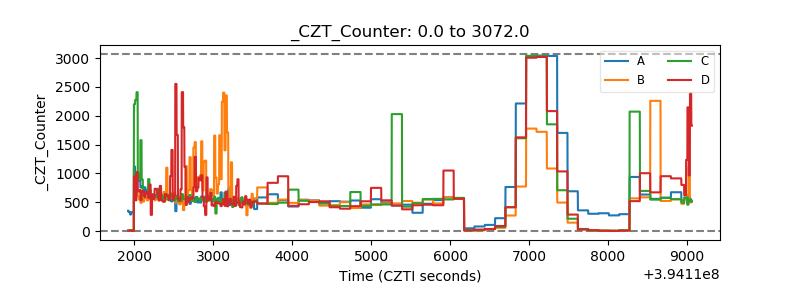 |
| +2.5 Volts monitor | 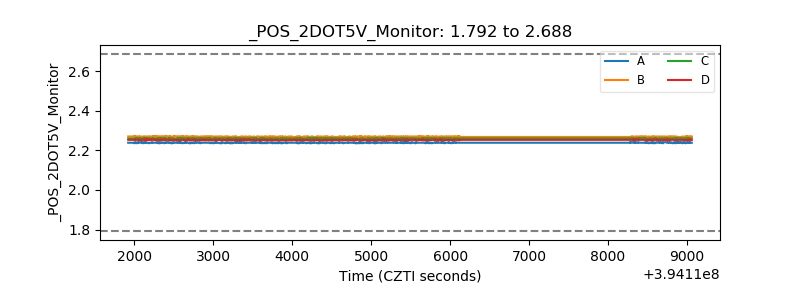 |
| +5 Volts monitor | 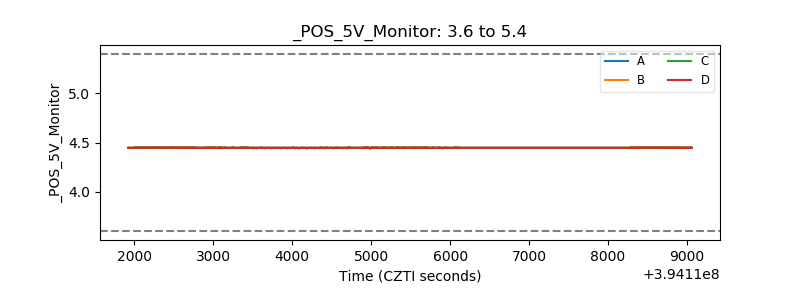 |
| _ROLL_ROT | 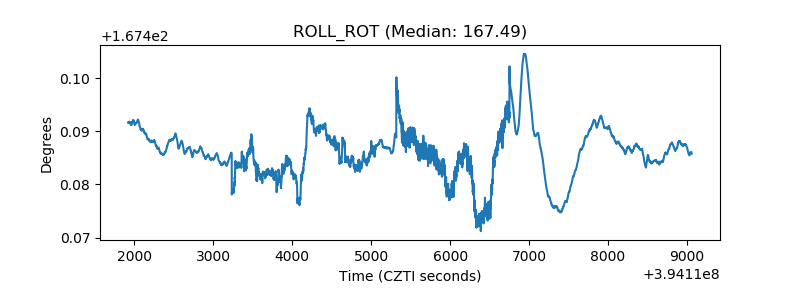 |
| _Roll_DEC | 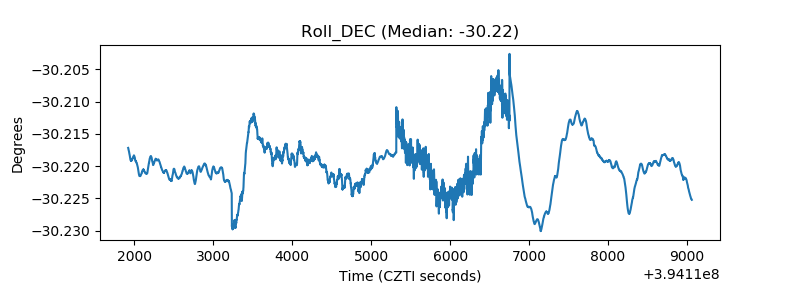 |
| _Roll_RA | 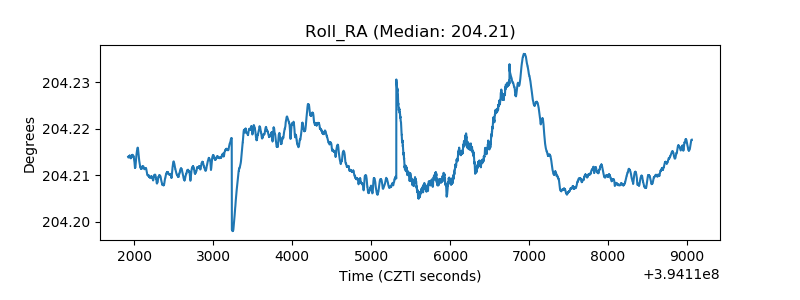 |
| Veto Counter | 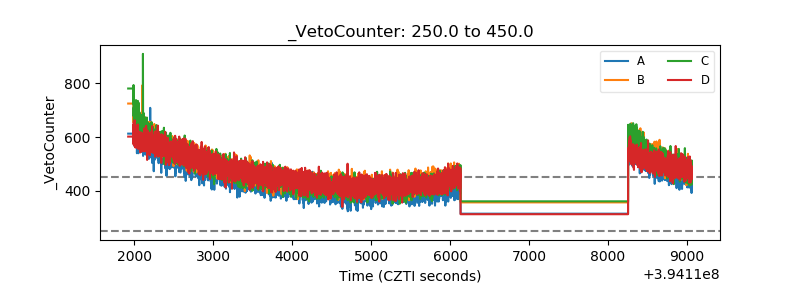 |