| Param | Original file | Final file |
|---|---|---|
| Filename | modeM0/AS1A11_049T04_9000005210_36492cztM0_level2.evt | modeM0/AS1A11_049T04_9000005210_36492cztM0_level2_quad_clean.evt |
| Size (bytes) | 482,558,400 | 97,752,960 |
| Size | 460.2 MB | 93.2 MB |
| Events in quadrant A | 2,784,245 | 679,040 |
| Events in quadrant B | 3,148,501 | 671,603 |
| Events in quadrant C | 2,989,595 | 657,484 |
| Events in quadrant D | 5,349,050 | 597,560 |
| Mode M9 | |||
|---|---|---|---|
| Quadrant | BADHDUFLAG | Total packets | Discarded packets |
| A | 0 | 20 | 0 |
| B | 0 | 20 | 0 |
| C | 0 | 20 | 0 |
| D | 0 | 21 | 0 |
| Mode SS | |||
|---|---|---|---|
| Quadrant | BADHDUFLAG | Total packets | Discarded packets |
| A | 0 | 104 | 0 |
| B | 0 | 104 | 0 |
| C | 0 | 104 | 0 |
| D | 0 | 104 | 0 |
| Mode M0 | |||
|---|---|---|---|
| Quadrant | BADHDUFLAG | Total packets | Discarded packets |
| A | 0 | 11343 | 3 |
| B | 0 | 12451 | 2 |
| C | 0 | 11960 | 2 |
| D | 0 | 19391 | 2 |
| Quadrant | Total seconds | Saturated seconds | Saturation percentage |
|---|---|---|---|
| A | 5056 | 15 | 0.296677% |
| B | 5056 | 121 | 2.393196% |
| C | 5056 | 123 | 2.432753% |
| D | 5056 | 696 | 13.765823% |
Noise dominated data is calculated using 1-second bins in cleaned event files. If a bin has >2000 counts, and if more than 50% of those come from <1% of pixels, then it is considered to be noise-dominated and hence unusable.
| Quadrant | # 1 sec bins | Bins with >0 counts | Bins with >2000 counts | High rate bins dominated by noise | Noise dominated (total time) | Noise dominated (detector-on time) | Marked lightcurve |
|---|---|---|---|---|---|---|---|
| A | 7089 | 5057 | 4 | 4 | 0.06% | 0.08% | 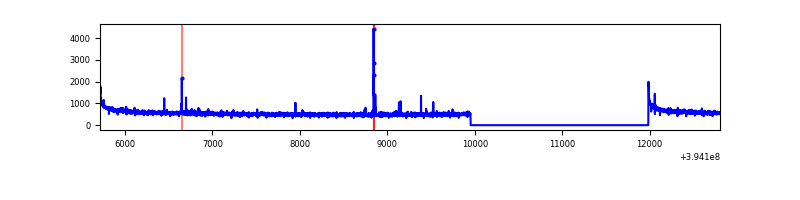 |
| B | 7089 | 5057 | 83 | 83 | 1.17% | 1.64% | 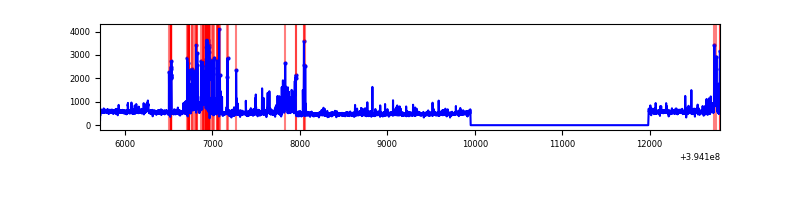 |
| C | 7089 | 5057 | 64 | 64 | 0.90% | 1.27% | 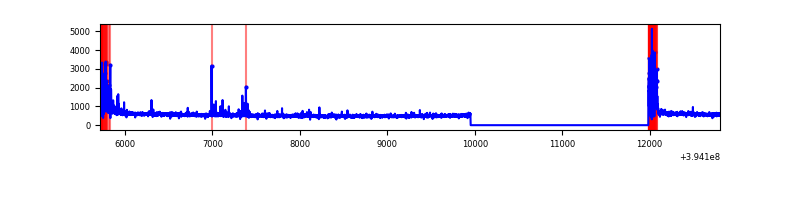 |
| D | 7089 | 5057 | 620 | 620 | 8.75% | 12.26% | 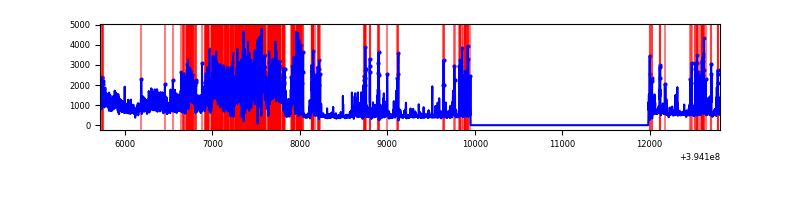 |
Top three noisy pixels from each quadrant. If the there are fewer than three noisy pixels in the level2.evt file, extra rows are filled as -1
| Pixel properties | Quadrant properties | ||||||
|---|---|---|---|---|---|---|---|
| Quadrant | DetID | PixID | Counts | Sigma | Mean | Median | Sigma |
| A | 10 | 83 | 194809 | 1514.85 | 655 | 645 | 128.2 |
| A | 7 | 16 | 27715 | 211.2 | 655 | 645 | 128.2 |
| A | 13 | 6 | 16394 | 122.87 | 655 | 645 | 128.2 |
| B | 5 | 172 | 489636 | 4039.13 | 636 | 622 | 121.1 |
| B | 5 | 255 | 43068 | 350.59 | 636 | 622 | 121.1 |
| B | 0 | 214 | 28882 | 233.42 | 636 | 622 | 121.1 |
| C | 0 | 10 | 354772 | 2510.47 | 616 | 622 | 141.1 |
| C | 15 | 214 | 218806 | 1546.64 | 616 | 622 | 141.1 |
| C | 0 | 207 | 10753 | 71.82 | 616 | 622 | 141.1 |
| D | 12 | 227 | 2245096 | 15169.47 | 609 | 593 | 148.0 |
| D | 2 | 250 | 257601 | 1736.99 | 609 | 593 | 148.0 |
| D | 13 | 249 | 253090 | 1706.5 | 609 | 593 | 148.0 |
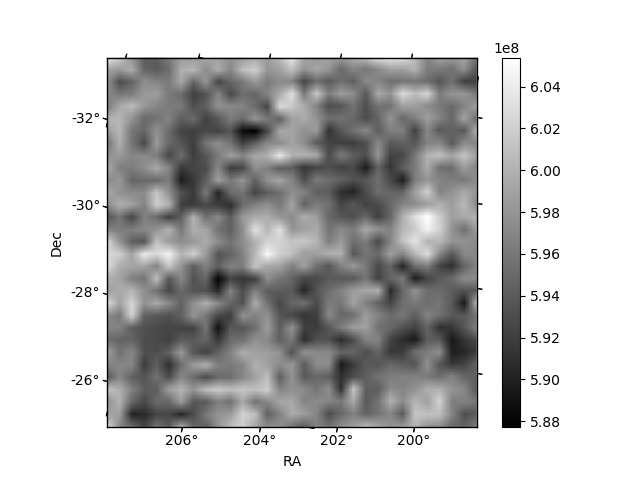
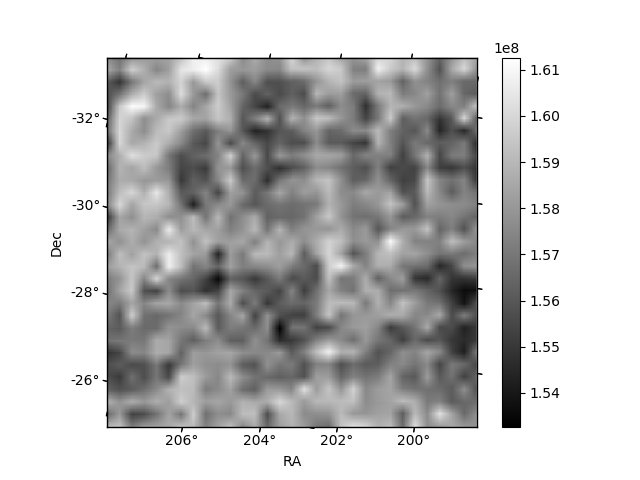
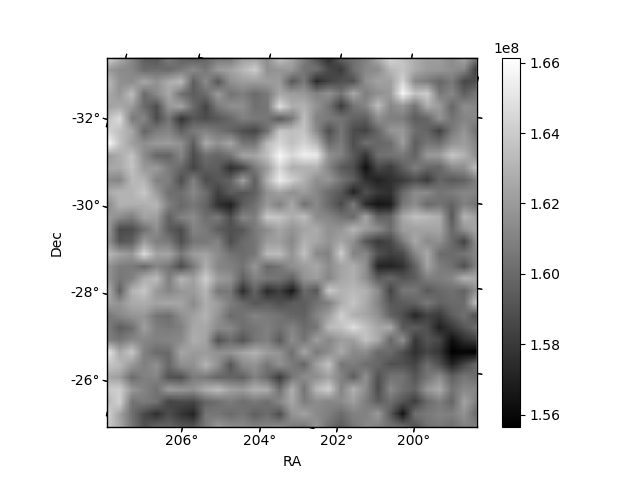
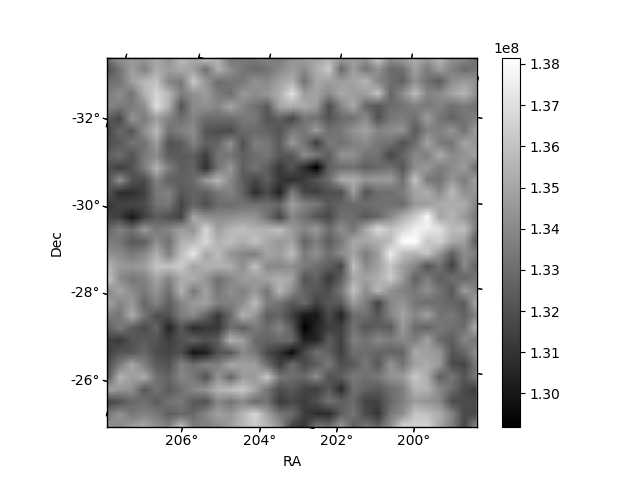
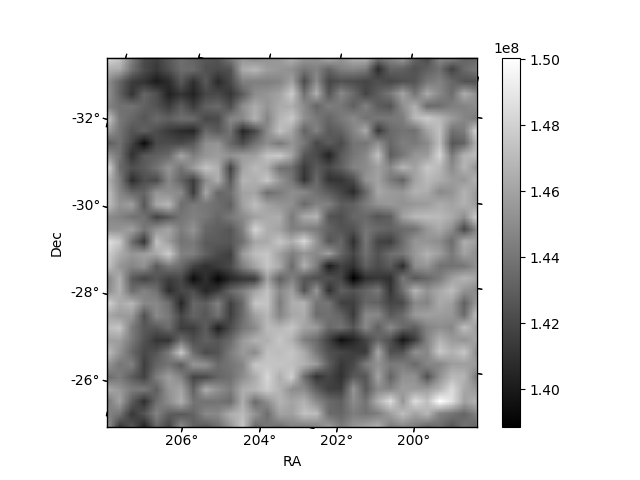
Histogram calculated using DETX and DETY for each event in the final _common_clean file
| Quadrant A | 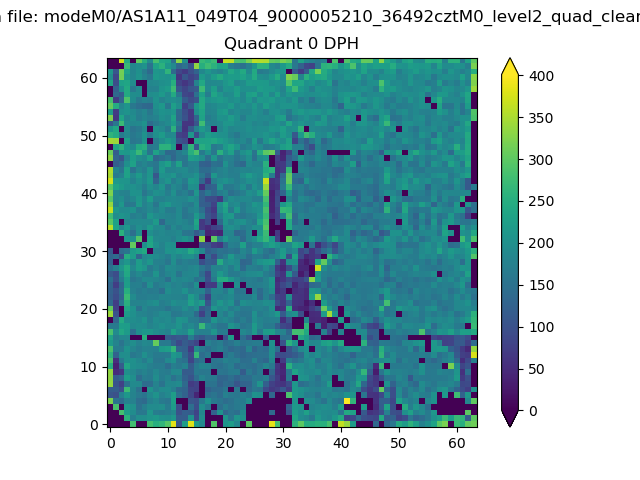 |
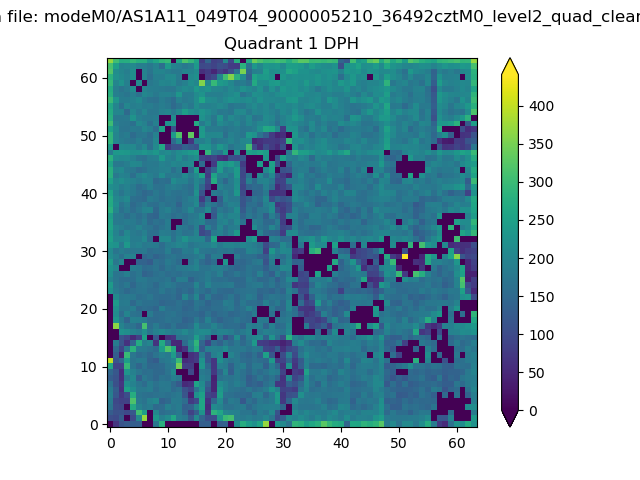 |
Quadrant B |
|---|---|---|---|
| Quadrant D | 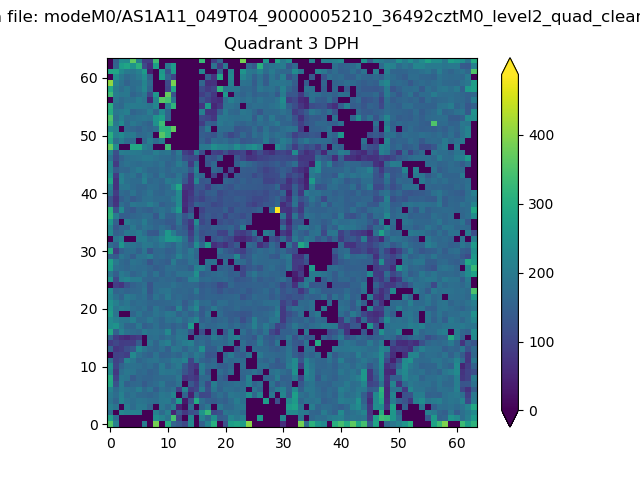 |
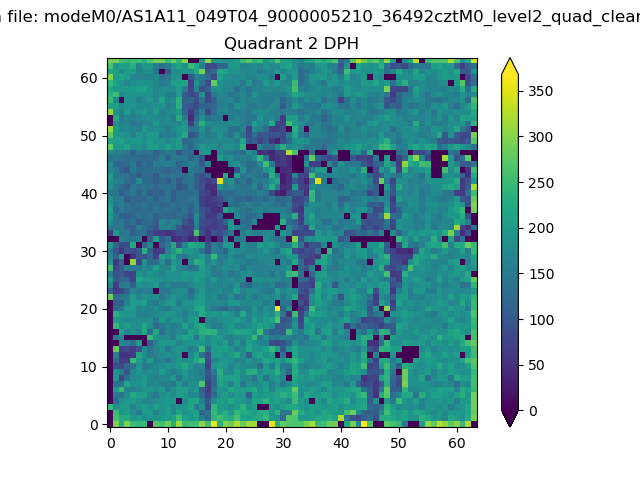 |
Quadrant C |
| Plot type | Count rate plots | Images |
|---|---|---|
| Comparison with Poisson distribution Blue bars denote a histogram of data divided into 1 sec bins. Red curve is a Poisson curve with rate = median count rate of data. |
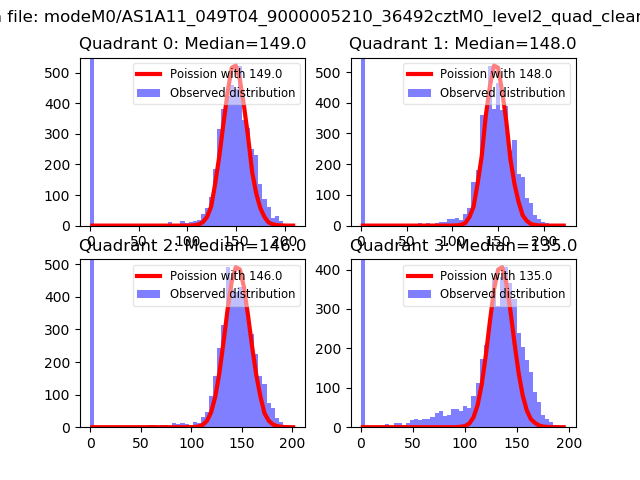 |
 |
| Quadrant-wise count rates Data is divided into 100 sec bins |
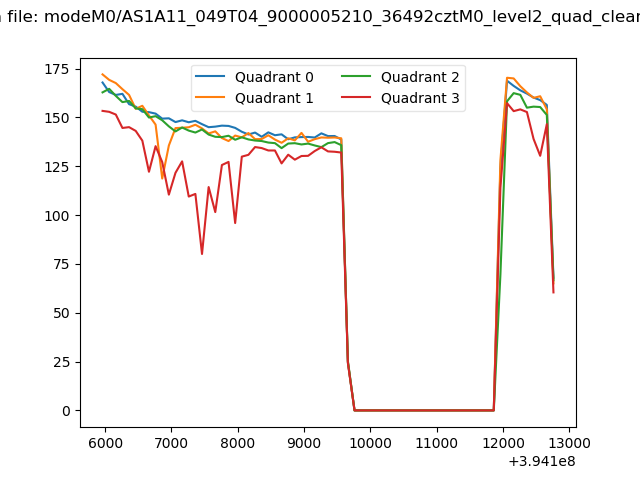 |
|
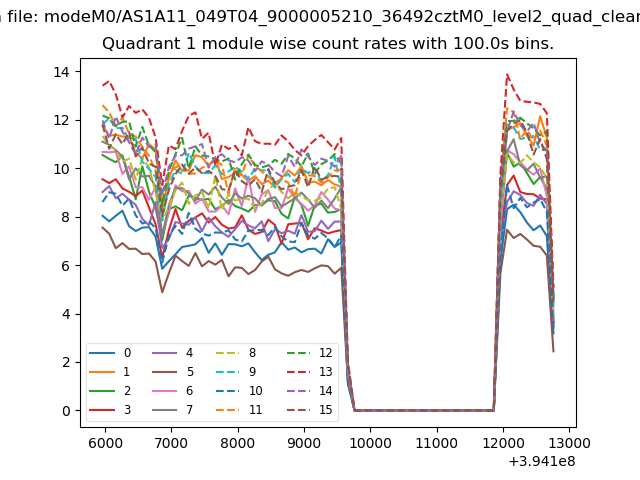
| Module-wise count rates for Quadrant A Data is divided into 100 sec bins |
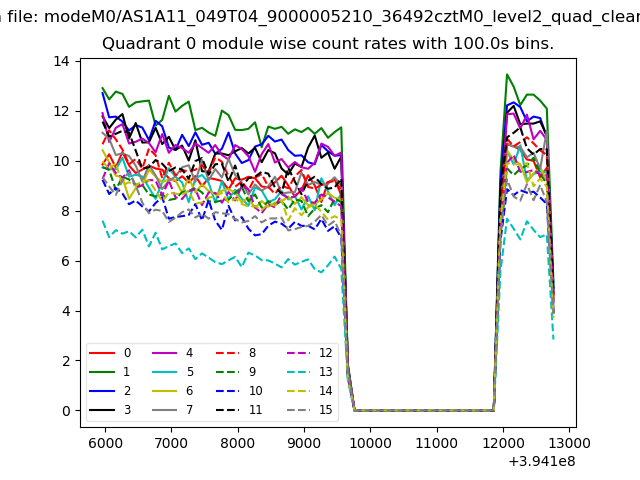 |
 |
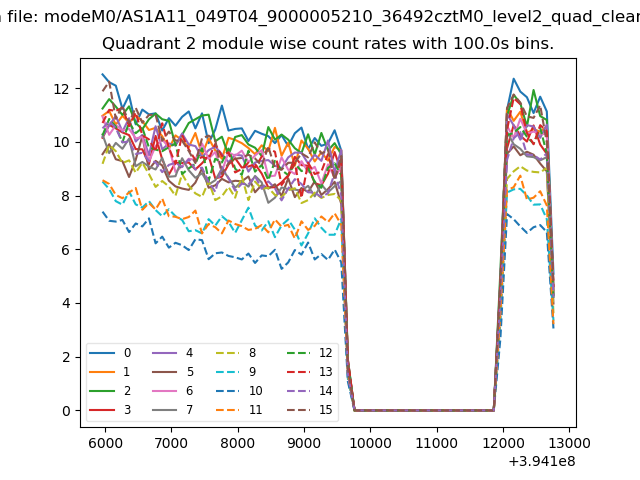
| Module-wise count rates for Quadrant B Data is divided into 100 sec bins |
 |
 |
| Module-wise count rates for Quadrant C Data is divided into 100 sec bins |
 |
 |
| Module-wise count rates for Quadrant D Data is divided into 100 sec bins |
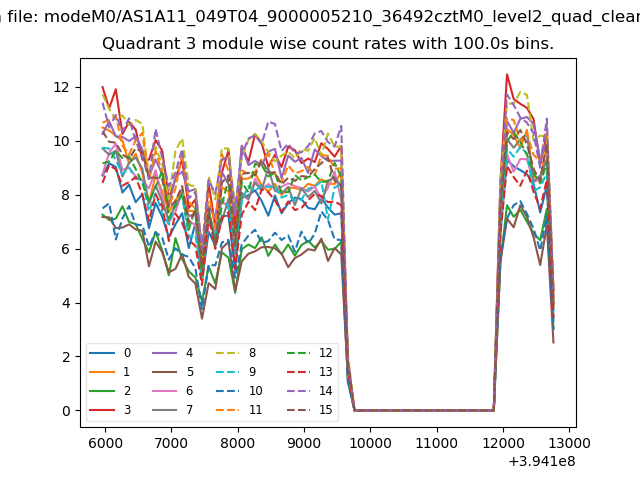 |
 |
| Parameter | Plot |
|---|---|
| CZT HV Monitor | 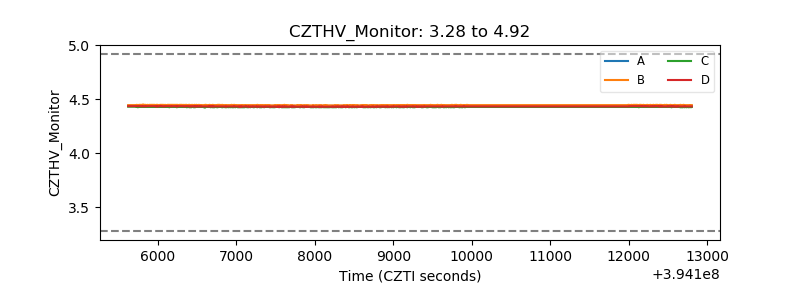 |
| D_VDD | 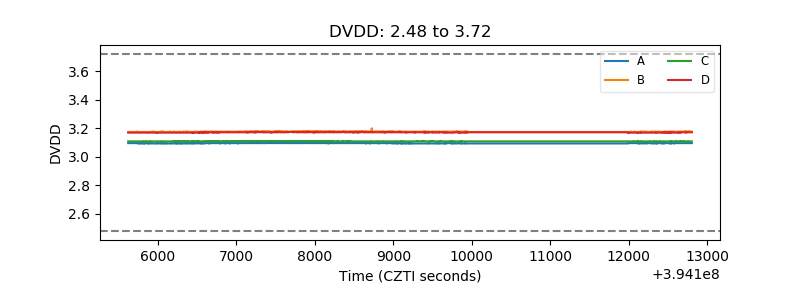 |
| Temperature 1 | 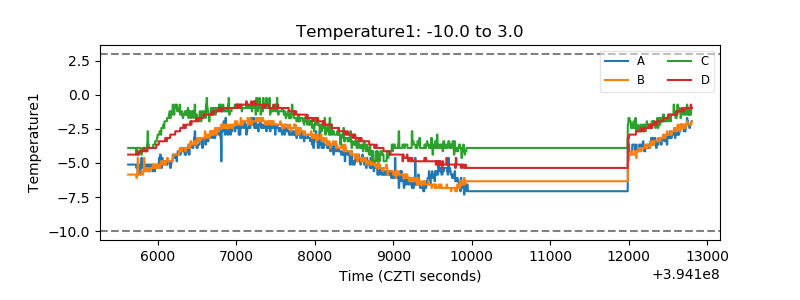 |
| Veto HV Monitor | 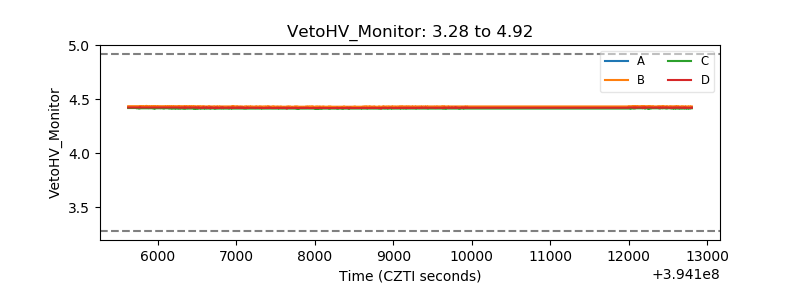 |
| Veto LLD | 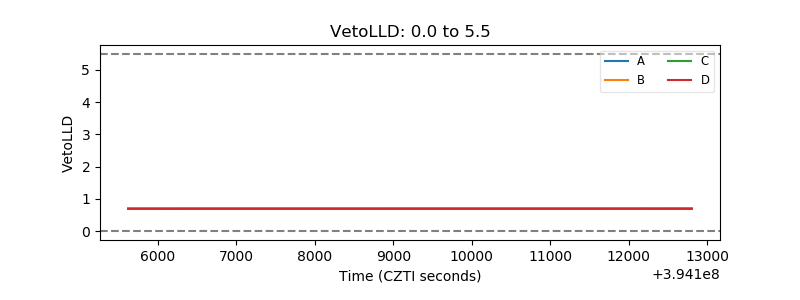 |
| Alpha Counter | 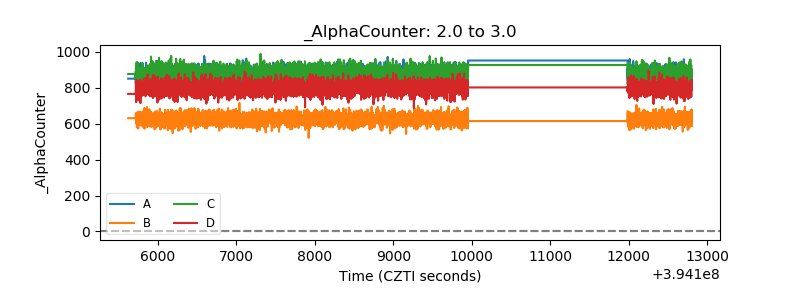 |
| _CPM_Rate | 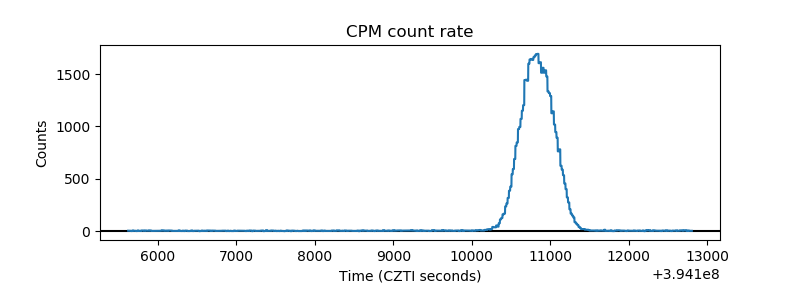 |
| CZT Counter | 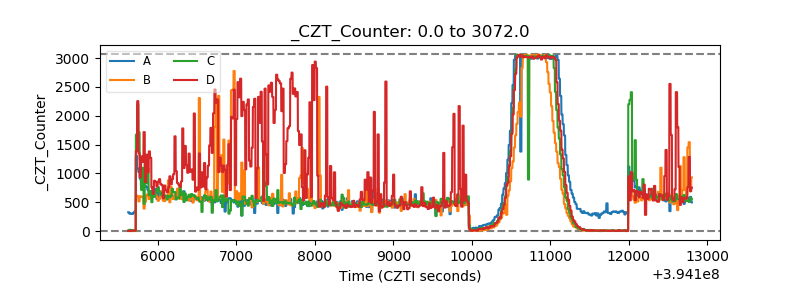 |
| +2.5 Volts monitor | 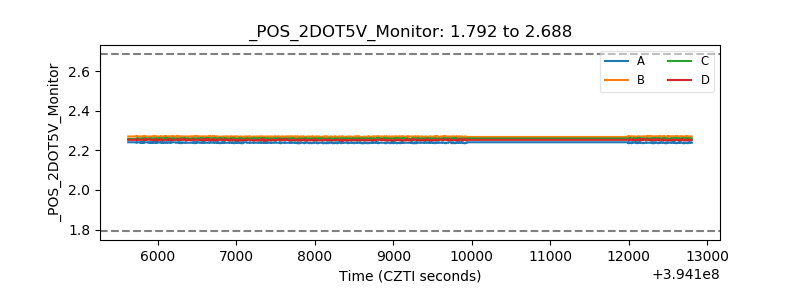 |
| +5 Volts monitor | 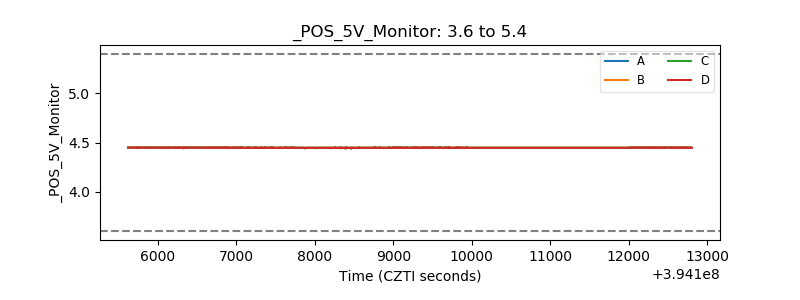 |
| _ROLL_ROT | 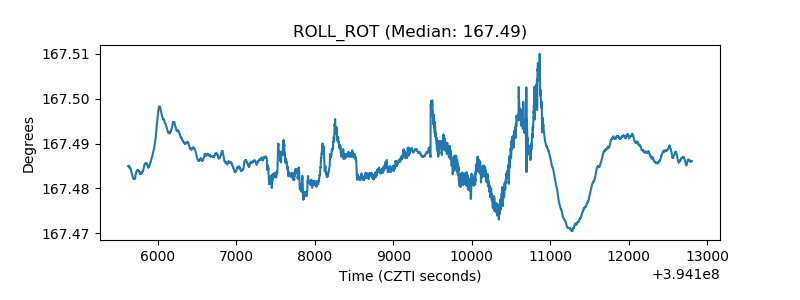 |
| _Roll_DEC | 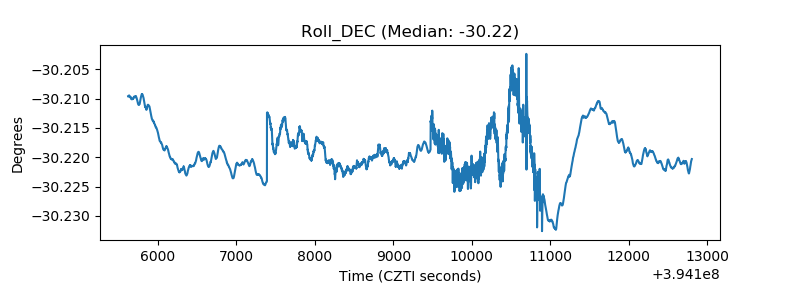 |
| _Roll_RA | 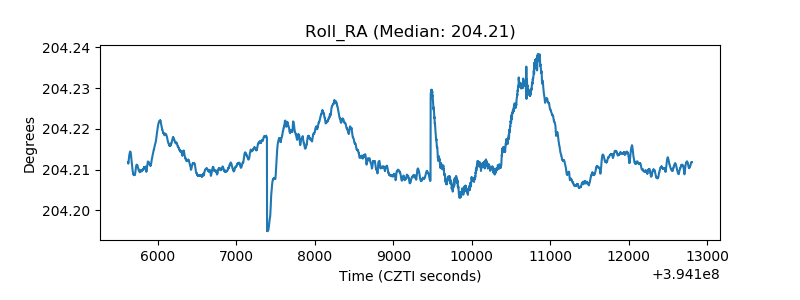 |
| Veto Counter | 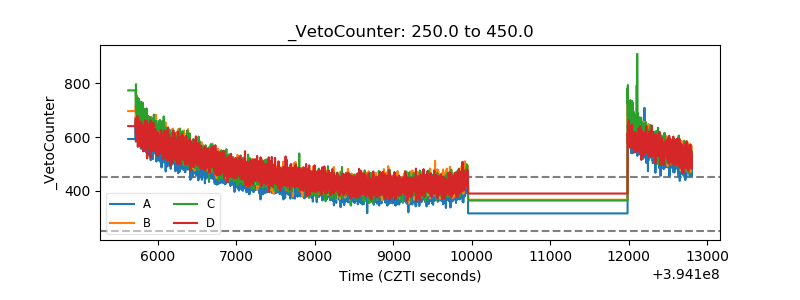 |