| Param | Original file | Final file |
|---|---|---|
| Filename | modeM0/AS1A11_049T04_9000005210_36491cztM0_level2.evt | modeM0/AS1A11_049T04_9000005210_36491cztM0_level2_quad_clean.evt |
| Size (bytes) | 460,474,560 | 90,129,600 |
| Size | 439.1 MB | 86.0 MB |
| Events in quadrant A | 2,792,125 | 609,598 |
| Events in quadrant B | 3,853,964 | 589,934 |
| Events in quadrant C | 2,952,725 | 601,358 |
| Events in quadrant D | 3,993,578 | 563,893 |
| Mode M9 | |||
|---|---|---|---|
| Quadrant | BADHDUFLAG | Total packets | Discarded packets |
| A | 0 | 34 | 0 |
| B | 0 | 34 | 0 |
| C | 0 | 34 | 0 |
| D | 0 | 35 | 0 |
| Mode SS | |||
|---|---|---|---|
| Quadrant | BADHDUFLAG | Total packets | Discarded packets |
| A | 0 | 106 | 0 |
| B | 0 | 106 | 0 |
| C | 0 | 106 | 0 |
| D | 0 | 106 | 0 |
| Mode M0 | |||
|---|---|---|---|
| Quadrant | BADHDUFLAG | Total packets | Discarded packets |
| A | 0 | 11423 | 3 |
| B | 0 | 14670 | 2 |
| C | 0 | 11885 | 2 |
| D | 0 | 15321 | 2 |
| Quadrant | Total seconds | Saturated seconds | Saturation percentage |
|---|---|---|---|
| A | 5204 | 7 | 0.134512% |
| B | 5204 | 389 | 7.475019% |
| C | 5204 | 89 | 1.710223% |
| D | 5204 | 147 | 2.824750% |
Noise dominated data is calculated using 1-second bins in cleaned event files. If a bin has >2000 counts, and if more than 50% of those come from <1% of pixels, then it is considered to be noise-dominated and hence unusable.
| Quadrant | # 1 sec bins | Bins with >0 counts | Bins with >2000 counts | High rate bins dominated by noise | Noise dominated (total time) | Noise dominated (detector-on time) | Marked lightcurve |
|---|---|---|---|---|---|---|---|
| A | 7147 | 5205 | 2 | 2 | 0.03% | 0.04% | 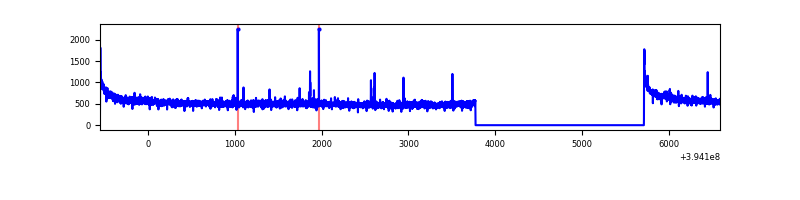 |
| B | 7147 | 5205 | 289 | 289 | 4.04% | 5.55% | 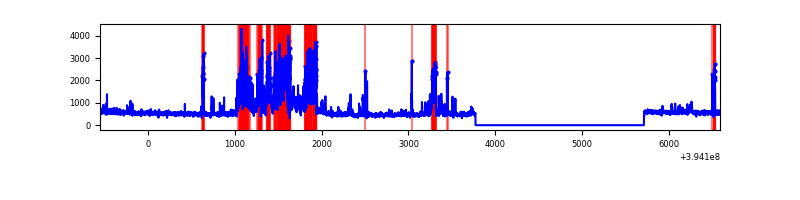 |
| C | 7147 | 5205 | 38 | 38 | 0.53% | 0.73% | 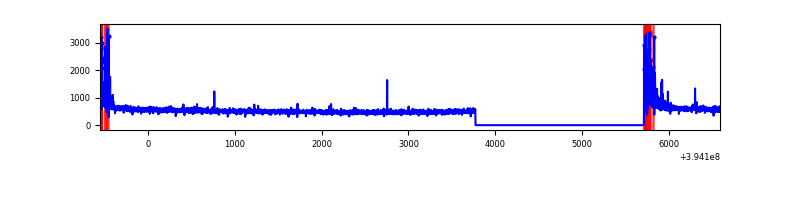 |
| D | 7147 | 5205 | 131 | 131 | 1.83% | 2.52% | 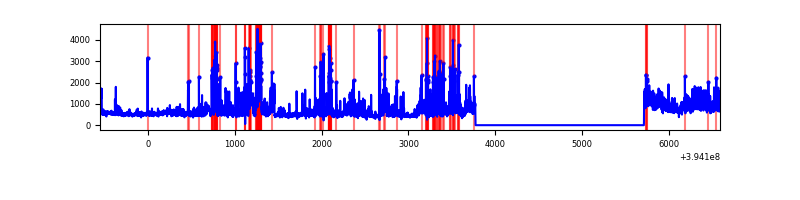 |
Top three noisy pixels from each quadrant. If the there are fewer than three noisy pixels in the level2.evt file, extra rows are filled as -1
| Pixel properties | Quadrant properties | ||||||
|---|---|---|---|---|---|---|---|
| Quadrant | DetID | PixID | Counts | Sigma | Mean | Median | Sigma |
| A | 10 | 83 | 192790 | 1457.9 | 663 | 652 | 131.8 |
| A | 13 | 6 | 15848 | 115.3 | 663 | 652 | 131.8 |
| A | 7 | 3 | 10543 | 75.05 | 663 | 652 | 131.8 |
| B | 5 | 172 | 1071462 | 8924.58 | 635 | 622 | 120.0 |
| B | 4 | 171 | 79880 | 660.55 | 635 | 622 | 120.0 |
| B | 5 | 255 | 76988 | 636.45 | 635 | 622 | 120.0 |
| C | 0 | 10 | 248014 | 1707.07 | 633 | 639 | 144.9 |
| C | 15 | 214 | 225337 | 1550.58 | 633 | 639 | 144.9 |
| C | 0 | 207 | 8088 | 51.4 | 633 | 639 | 144.9 |
| D | 12 | 227 | 745602 | 4899.23 | 637 | 622 | 152.1 |
| D | 13 | 249 | 207947 | 1363.44 | 637 | 622 | 152.1 |
| D | 2 | 153 | 181977 | 1192.65 | 637 | 622 | 152.1 |
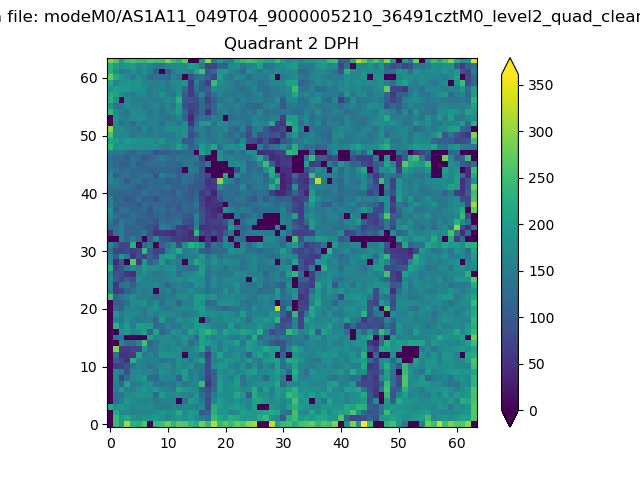
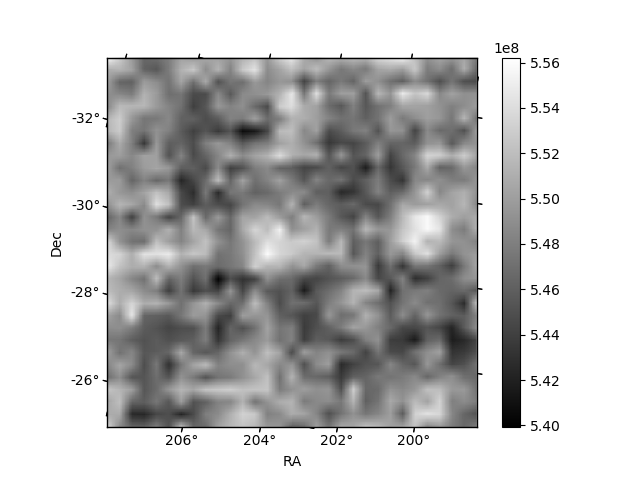
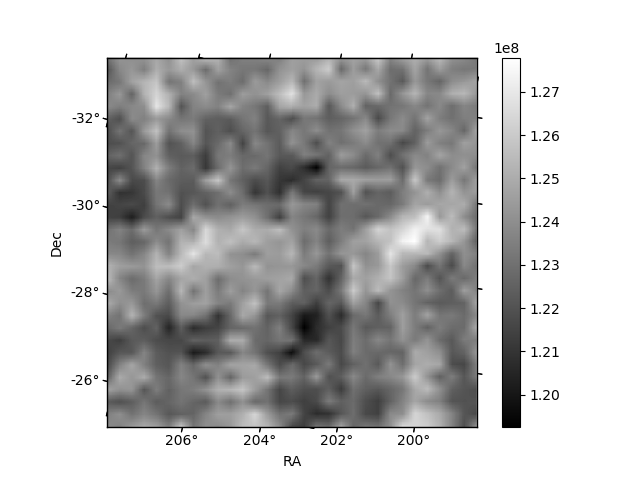
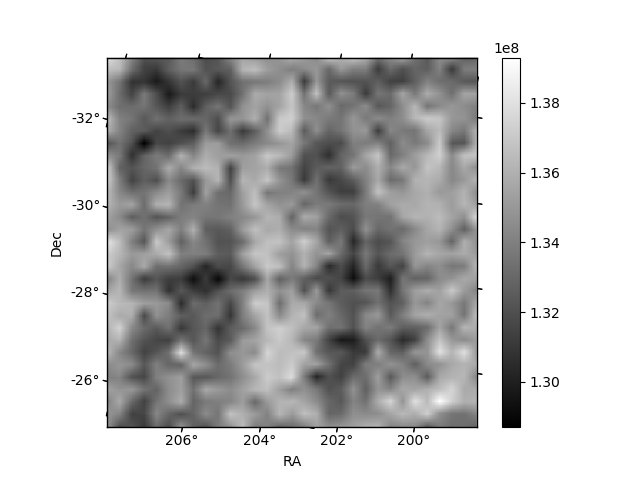
Histogram calculated using DETX and DETY for each event in the final _common_clean file
| Quadrant A | 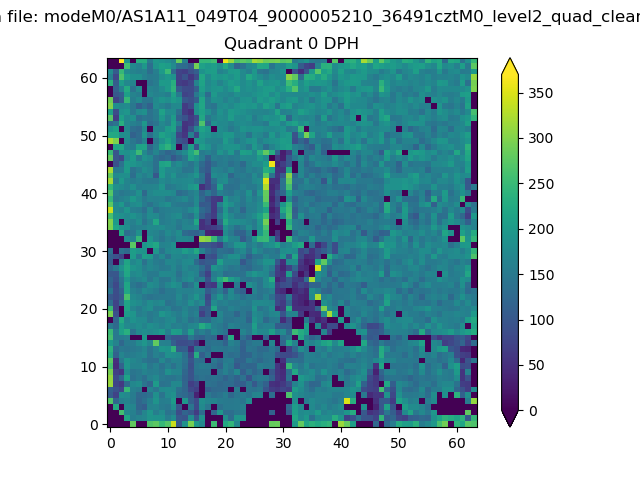 |
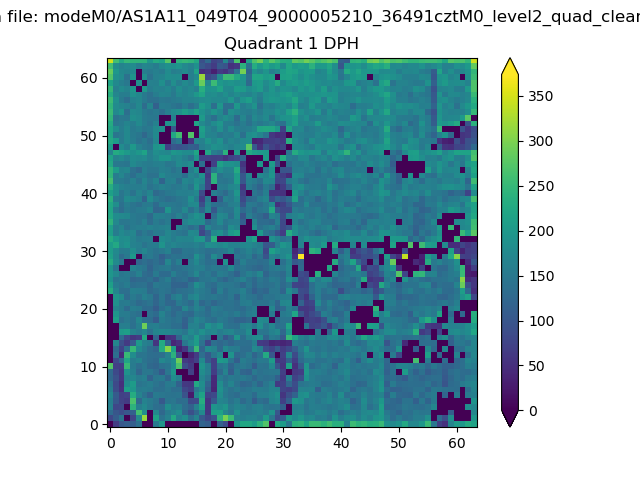 |
Quadrant B |
|---|---|---|---|
| Quadrant D | 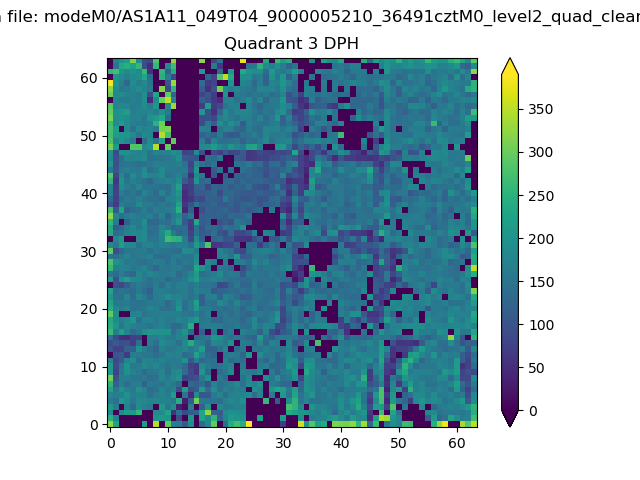 |
 |
Quadrant C |
| Plot type | Count rate plots | Images |
|---|---|---|
| Comparison with Poisson distribution Blue bars denote a histogram of data divided into 1 sec bins. Red curve is a Poisson curve with rate = median count rate of data. |
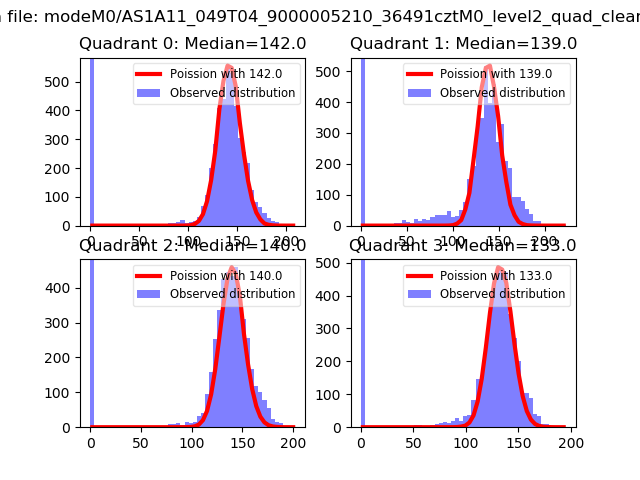 |
 |
| Quadrant-wise count rates Data is divided into 100 sec bins |
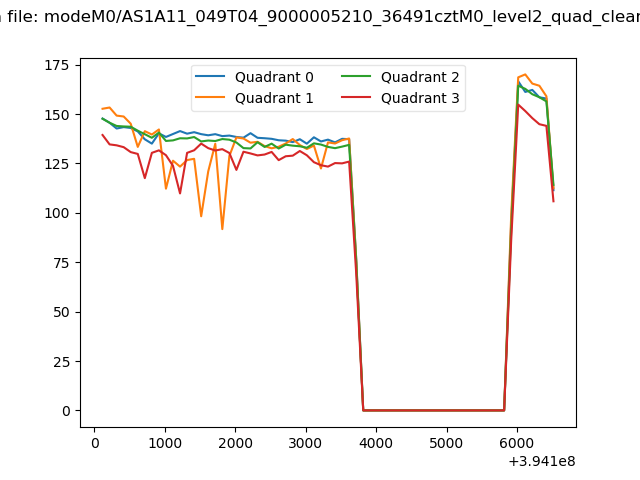 |
|
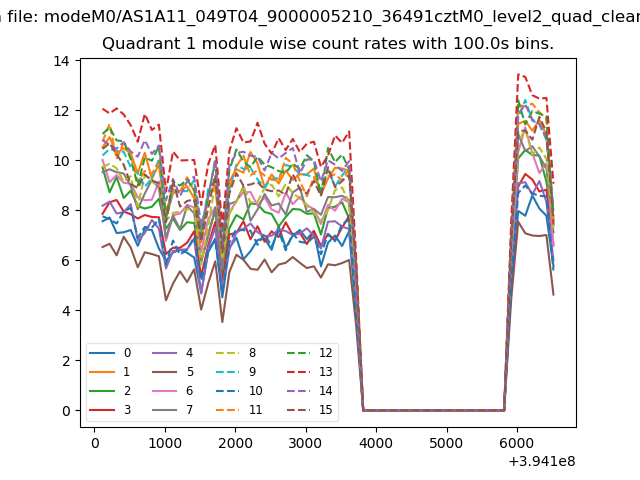
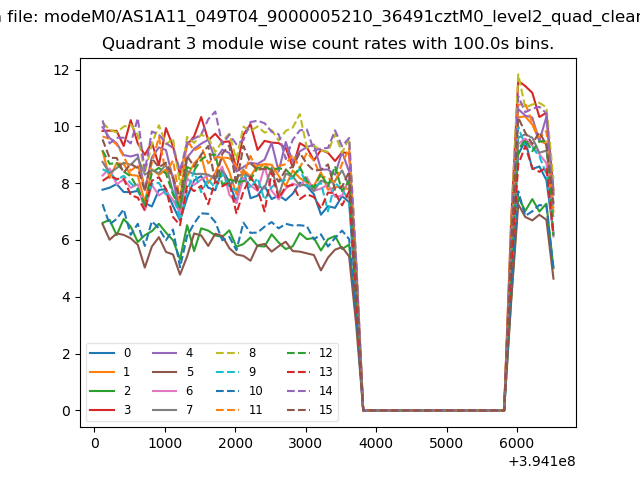
| Module-wise count rates for Quadrant A Data is divided into 100 sec bins |
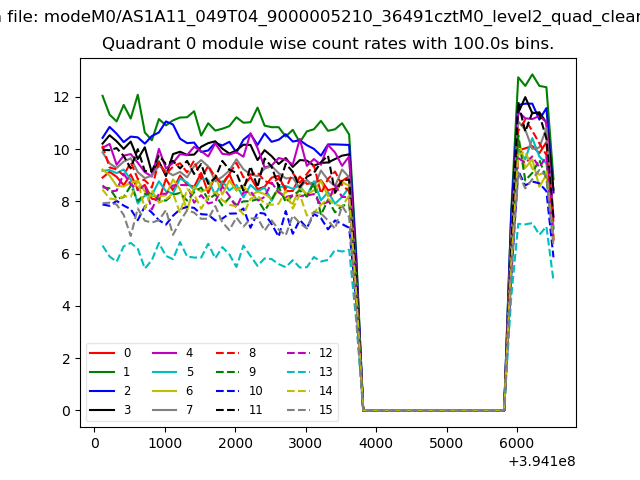 |
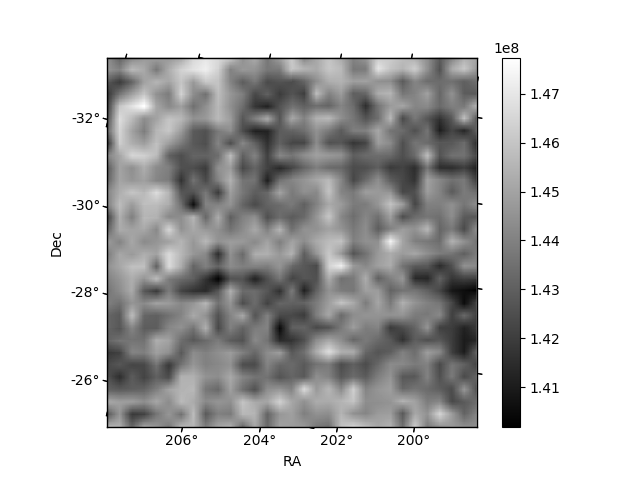 |
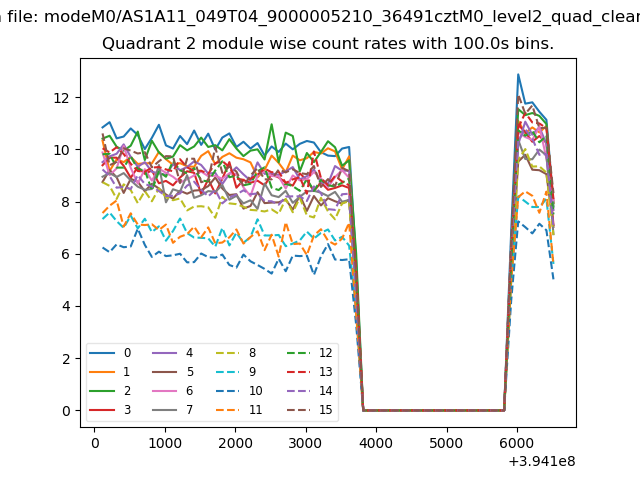
| Module-wise count rates for Quadrant B Data is divided into 100 sec bins |
 |
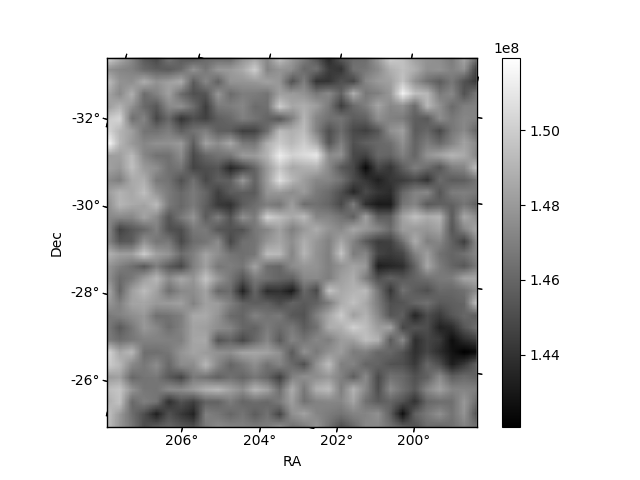 |
| Module-wise count rates for Quadrant C Data is divided into 100 sec bins |
 |
 |
| Module-wise count rates for Quadrant D Data is divided into 100 sec bins |
 |
 |
| Parameter | Plot |
|---|---|
| CZT HV Monitor | 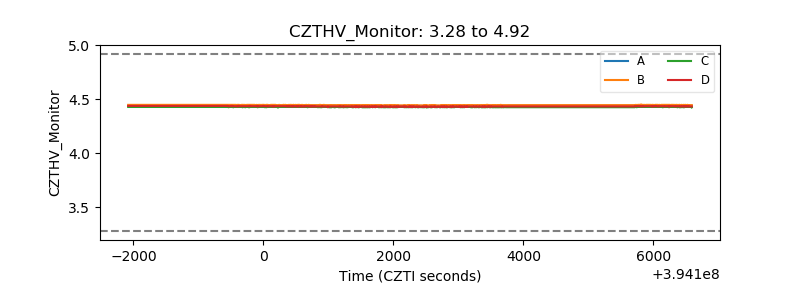 |
| D_VDD | 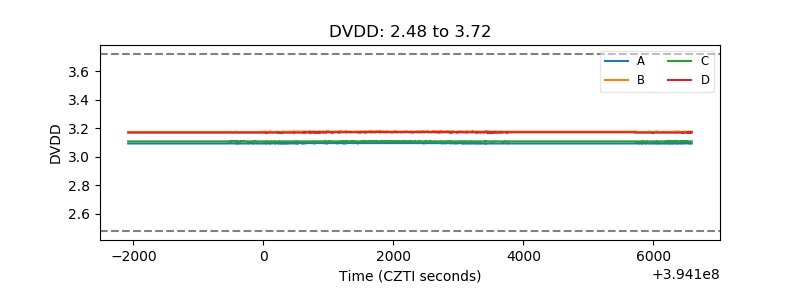 |
| Temperature 1 | 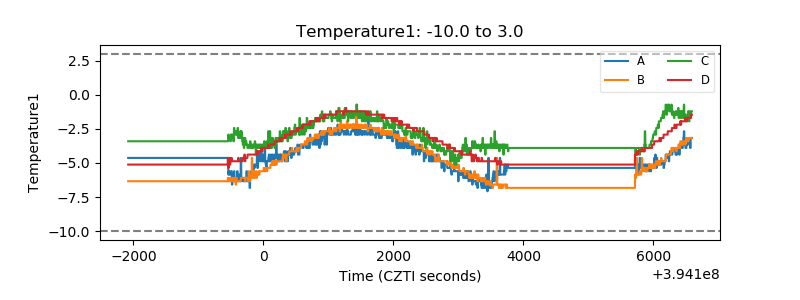 |
| Veto HV Monitor | 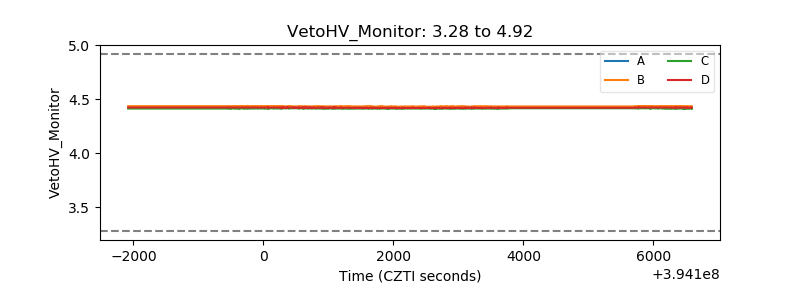 |
| Veto LLD | 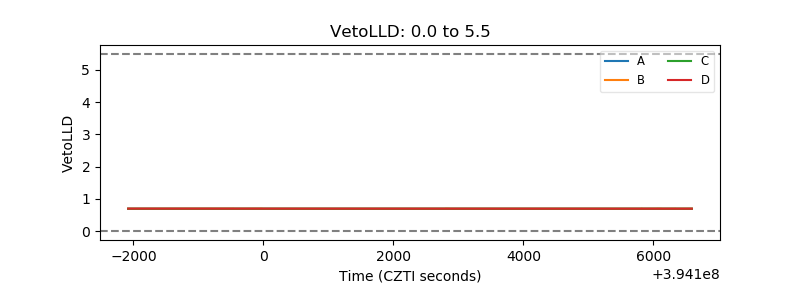 |
| Alpha Counter | 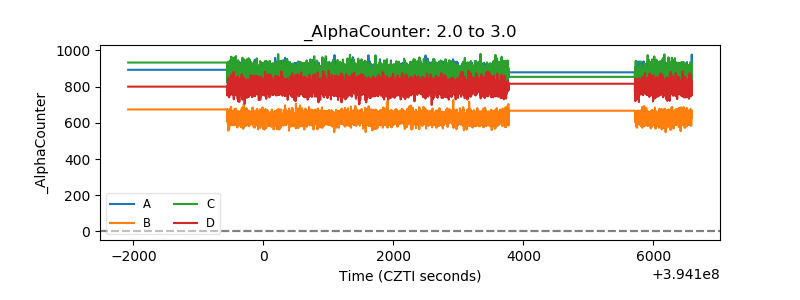 |
| _CPM_Rate | 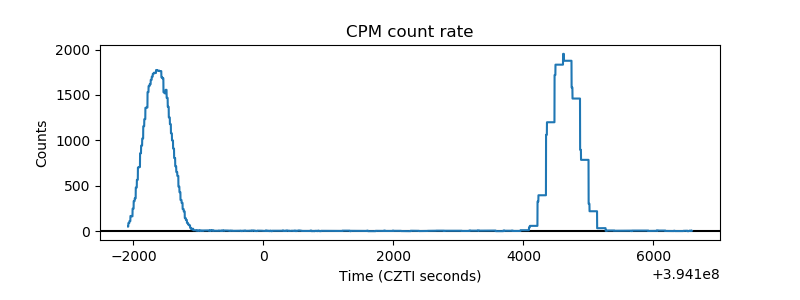 |
| CZT Counter | 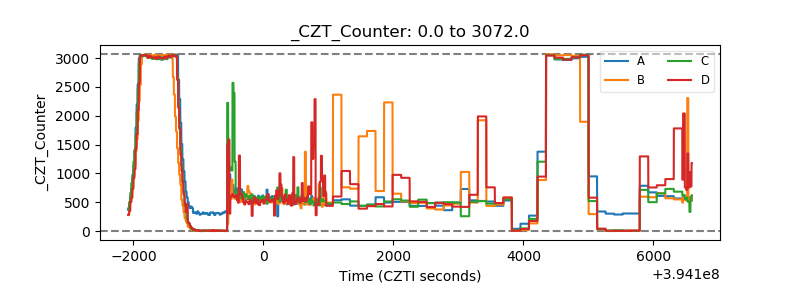 |
| +2.5 Volts monitor | 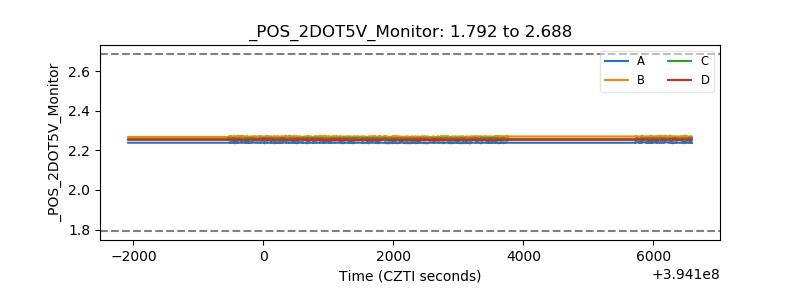 |
| +5 Volts monitor | 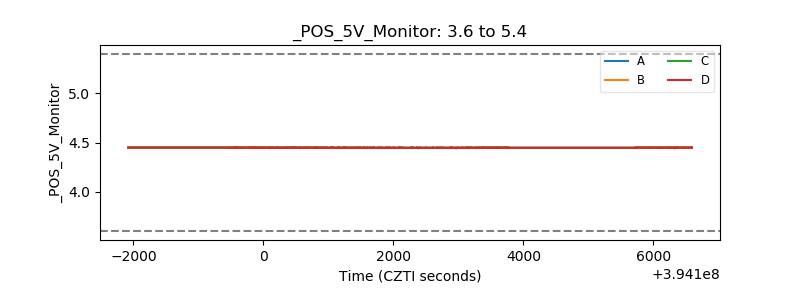 |
| _ROLL_ROT | 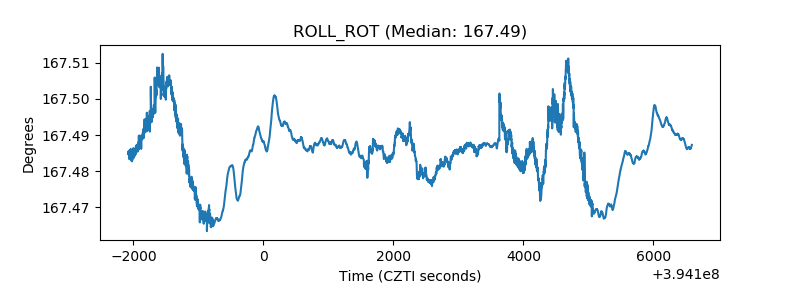 |
| _Roll_DEC | 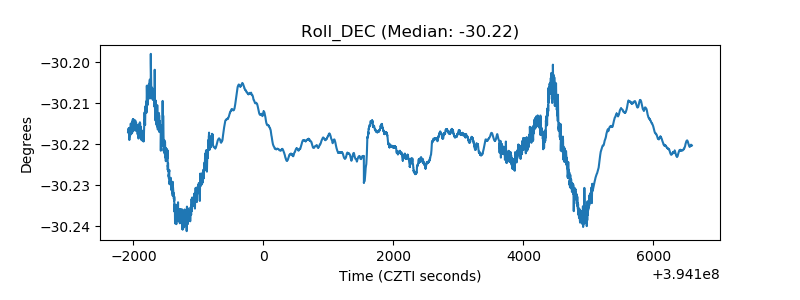 |
| _Roll_RA | 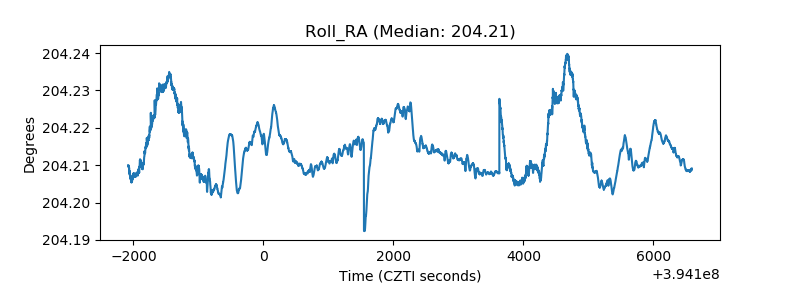 |
| Veto Counter | 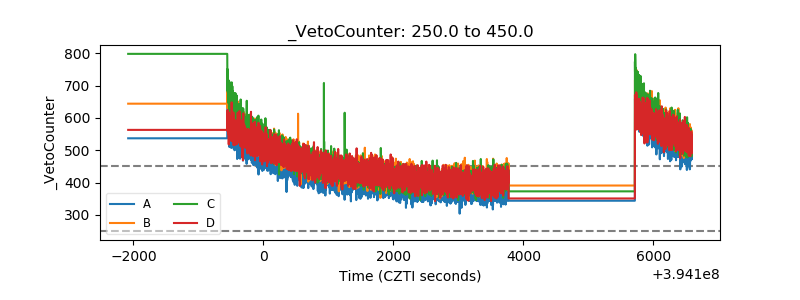 |