| Param | Original file | Final file |
|---|---|---|
| Filename | modeM0/AS1A11_049T04_9000005210_36488cztM0_level2.evt | modeM0/AS1A11_049T04_9000005210_36488cztM0_level2_quad_clean.evt |
| Size (bytes) | 446,941,440 | 61,346,880 |
| Size | 426.2 MB | 58.5 MB |
| Events in quadrant A | 2,702,966 | 386,230 |
| Events in quadrant B | 4,395,460 | 352,712 |
| Events in quadrant C | 2,753,868 | 380,245 |
| Events in quadrant D | 3,317,222 | 360,639 |
| Mode M9 | |||
|---|---|---|---|
| Quadrant | BADHDUFLAG | Total packets | Discarded packets |
| A | 0 | 27 | 0 |
| B | 0 | 27 | 0 |
| C | 0 | 27 | 0 |
| D | 0 | 28 | 0 |
| Mode SS | |||
|---|---|---|---|
| Quadrant | BADHDUFLAG | Total packets | Discarded packets |
| A | 0 | 110 | 0 |
| B | 0 | 110 | 0 |
| C | 0 | 110 | 0 |
| D | 0 | 110 | 0 |
| Mode M0 | |||
|---|---|---|---|
| Quadrant | BADHDUFLAG | Total packets | Discarded packets |
| A | 0 | 11334 | 3 |
| B | 0 | 16559 | 2 |
| C | 0 | 11387 | 2 |
| D | 0 | 13449 | 2 |
| Quadrant | Total seconds | Saturated seconds | Saturation percentage |
|---|---|---|---|
| A | 5388 | 18 | 0.334076% |
| B | 5388 | 570 | 10.579065% |
| C | 5388 | 34 | 0.631032% |
| D | 5388 | 150 | 2.783964% |
Noise dominated data is calculated using 1-second bins in cleaned event files. If a bin has >2000 counts, and if more than 50% of those come from <1% of pixels, then it is considered to be noise-dominated and hence unusable.
| Quadrant | # 1 sec bins | Bins with >0 counts | Bins with >2000 counts | High rate bins dominated by noise | Noise dominated (total time) | Noise dominated (detector-on time) | Marked lightcurve |
|---|---|---|---|---|---|---|---|
| A | 7090 | 5389 | 7 | 7 | 0.10% | 0.13% | 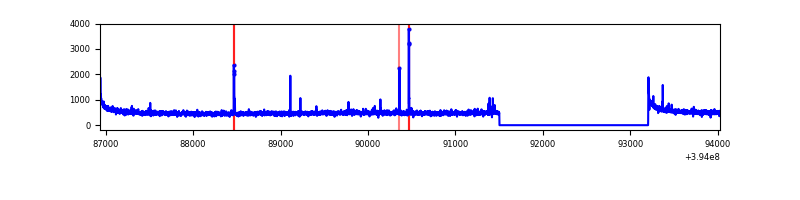 |
| B | 7090 | 5389 | 439 | 439 | 6.19% | 8.15% | 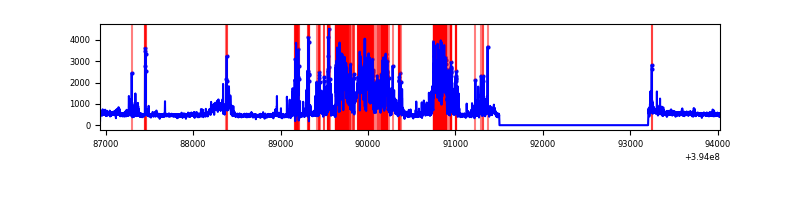 |
| C | 7090 | 5389 | 14 | 14 | 0.20% | 0.26% | 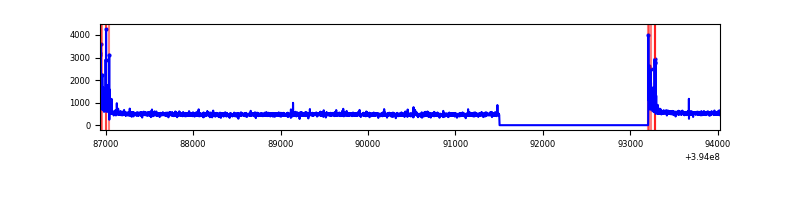 |
| D | 7090 | 5389 | 124 | 124 | 1.75% | 2.30% | 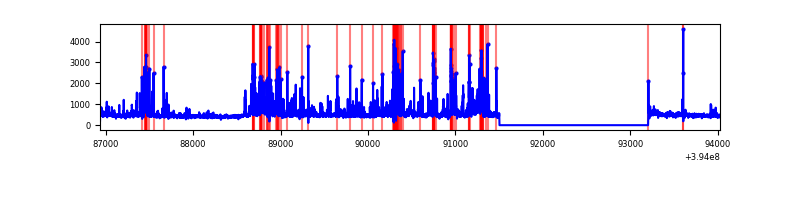 |
Top three noisy pixels from each quadrant. If the there are fewer than three noisy pixels in the level2.evt file, extra rows are filled as -1
| Pixel properties | Quadrant properties | ||||||
|---|---|---|---|---|---|---|---|
| Quadrant | DetID | PixID | Counts | Sigma | Mean | Median | Sigma |
| A | 10 | 83 | 198987 | 1574.48 | 628 | 618 | 126.0 |
| A | 15 | 223 | 44501 | 348.3 | 628 | 618 | 126.0 |
| A | 13 | 6 | 13508 | 102.31 | 628 | 618 | 126.0 |
| B | 5 | 172 | 1743703 | 15163.56 | 597 | 583 | 115.0 |
| B | 5 | 63 | 117863 | 1020.23 | 597 | 583 | 115.0 |
| B | 0 | 190 | 93782 | 810.75 | 597 | 583 | 115.0 |
| C | 15 | 214 | 233150 | 1665.17 | 605 | 611 | 139.6 |
| C | 0 | 10 | 152396 | 1086.91 | 605 | 611 | 139.6 |
| C | 0 | 207 | 6117 | 39.43 | 605 | 611 | 139.6 |
| D | 13 | 249 | 387677 | 2597.77 | 604 | 586 | 149.0 |
| D | 2 | 250 | 157591 | 1053.66 | 604 | 586 | 149.0 |
| D | 12 | 6 | 143518 | 959.22 | 604 | 586 | 149.0 |
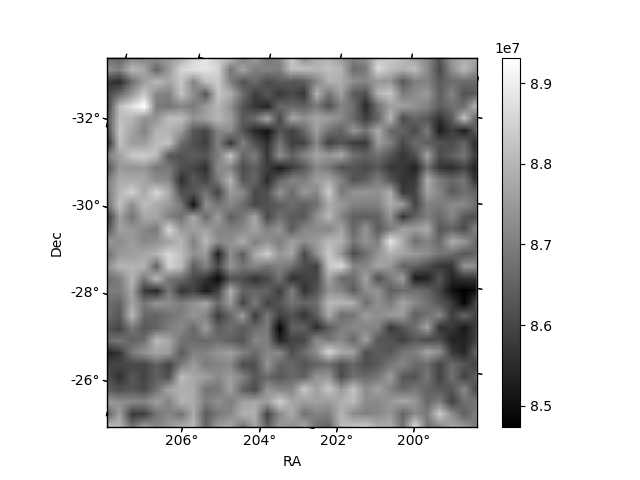
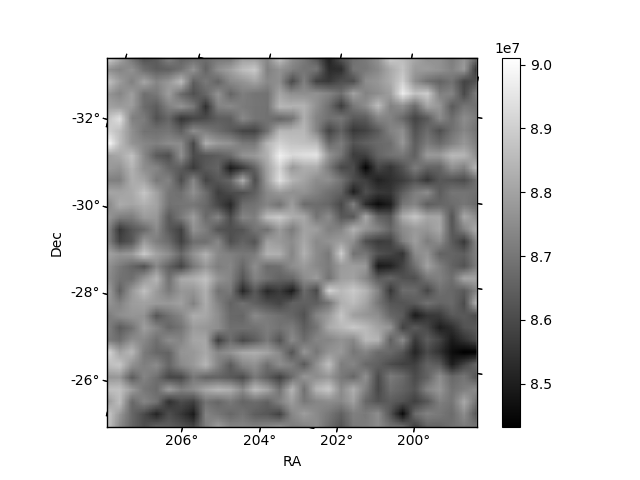
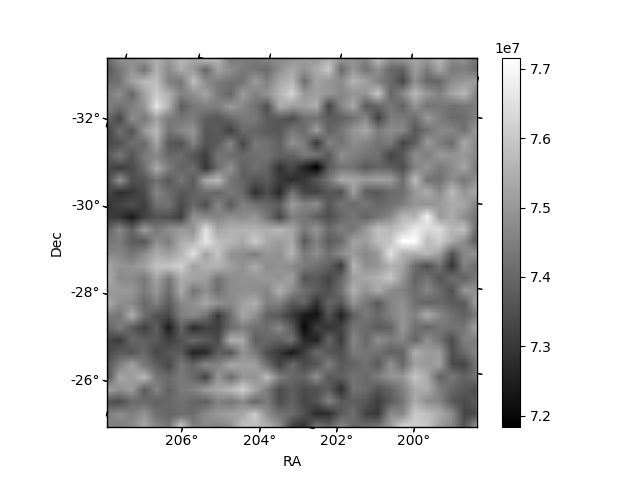
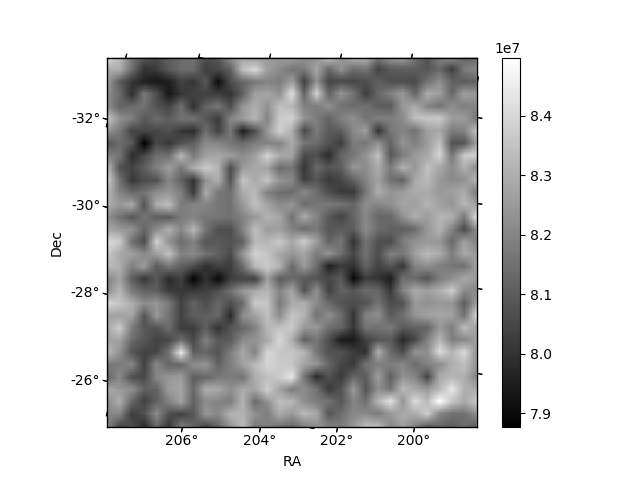
Histogram calculated using DETX and DETY for each event in the final _common_clean file
| Quadrant A | 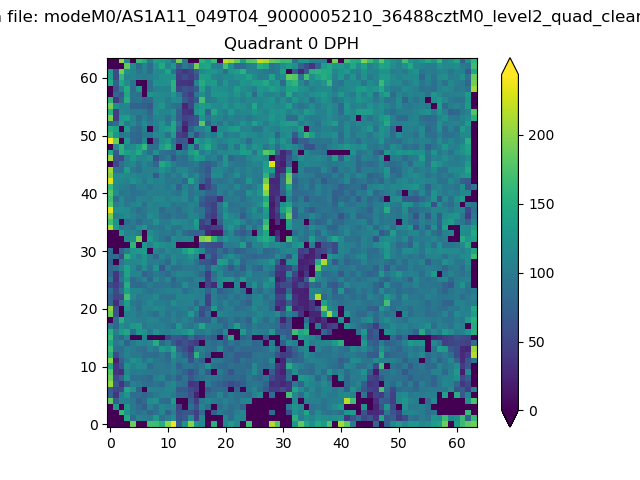 |
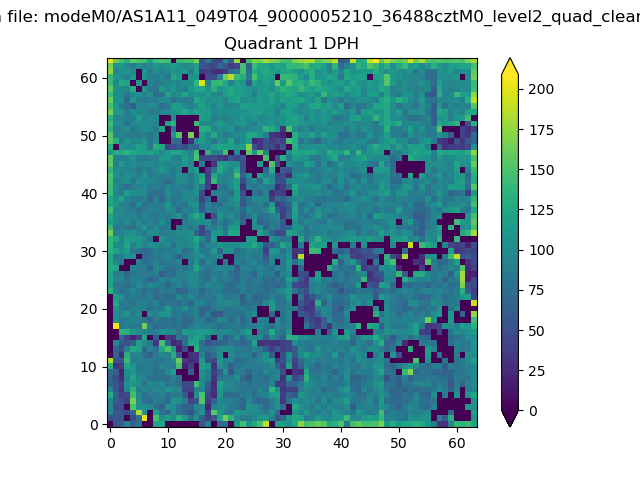 |
Quadrant B |
|---|---|---|---|
| Quadrant D | 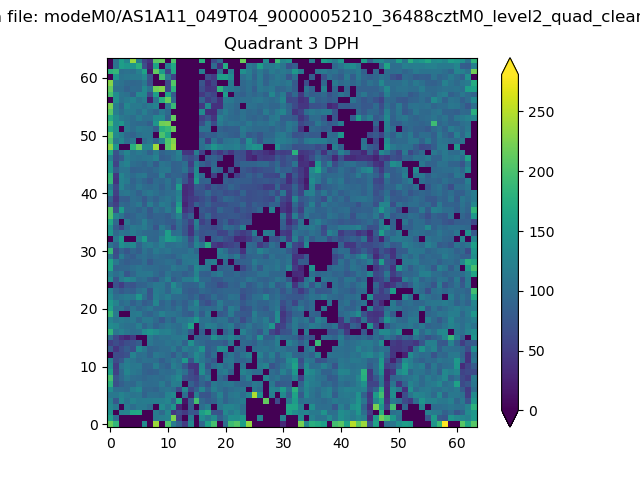 |
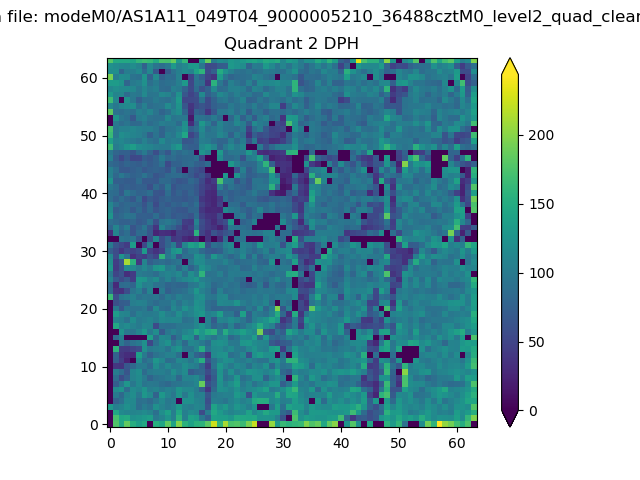 |
Quadrant C |
| Plot type | Count rate plots | Images |
|---|---|---|
| Comparison with Poisson distribution Blue bars denote a histogram of data divided into 1 sec bins. Red curve is a Poisson curve with rate = median count rate of data. |
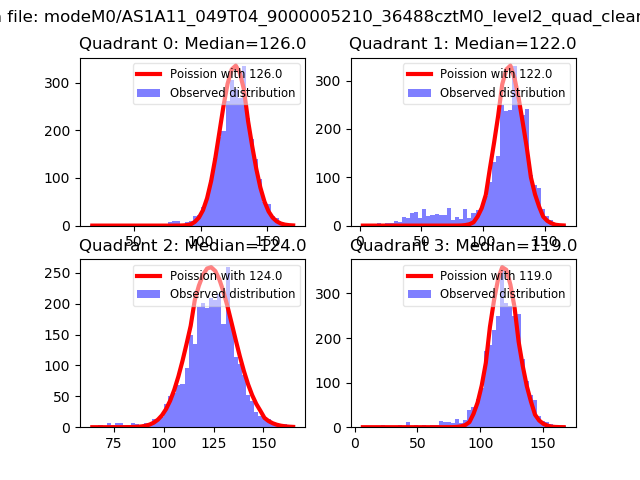 |
 |
| Quadrant-wise count rates Data is divided into 100 sec bins |
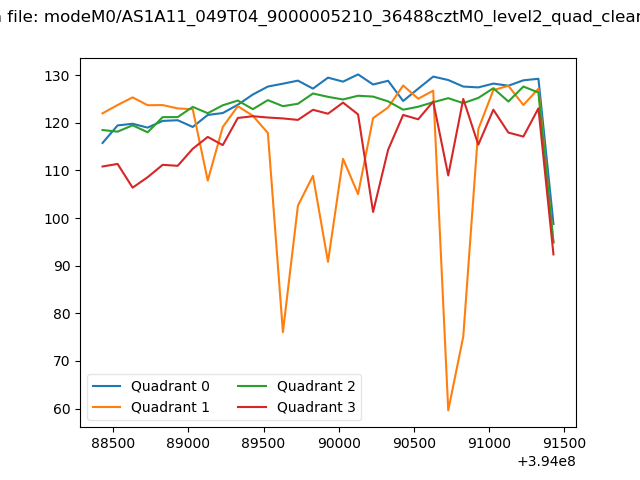 |
|
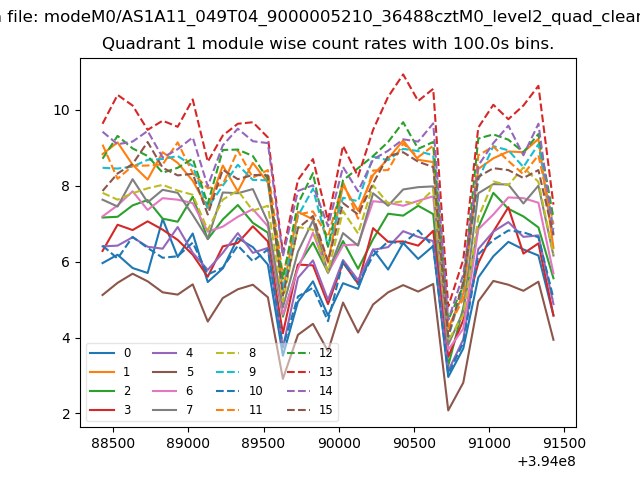
| Module-wise count rates for Quadrant A Data is divided into 100 sec bins |
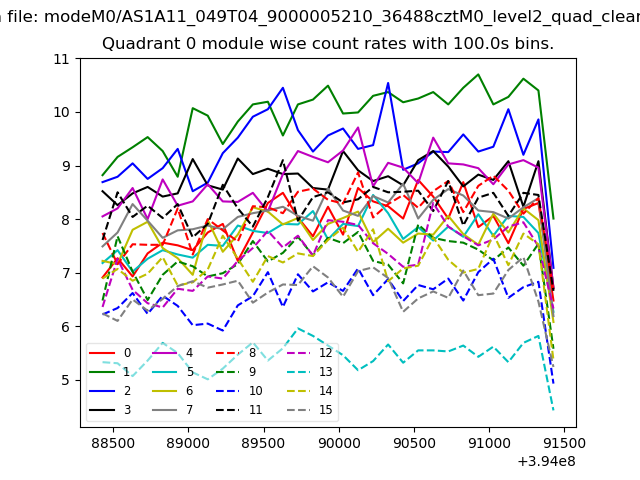 |
 |
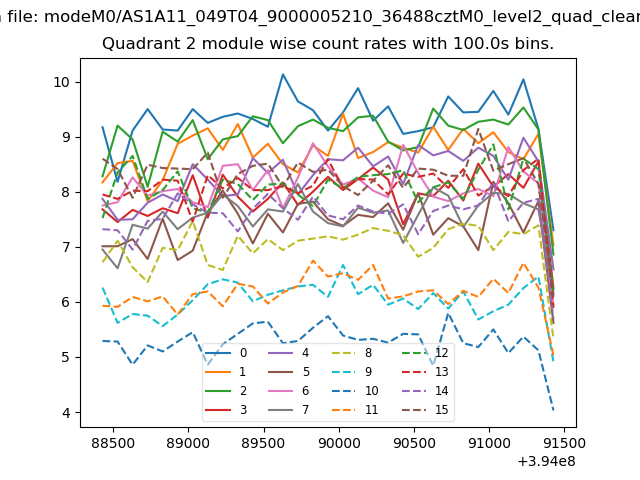
| Module-wise count rates for Quadrant B Data is divided into 100 sec bins |
 |
 |
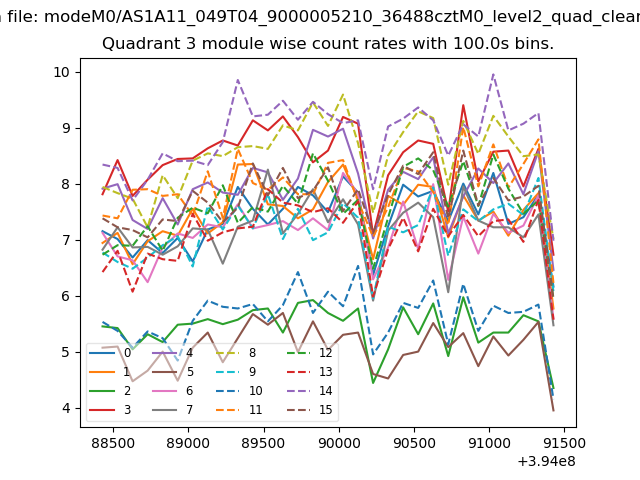
| Module-wise count rates for Quadrant C Data is divided into 100 sec bins |
 |
 |
| Module-wise count rates for Quadrant D Data is divided into 100 sec bins |
 |
 |
| Parameter | Plot |
|---|---|
| CZT HV Monitor | 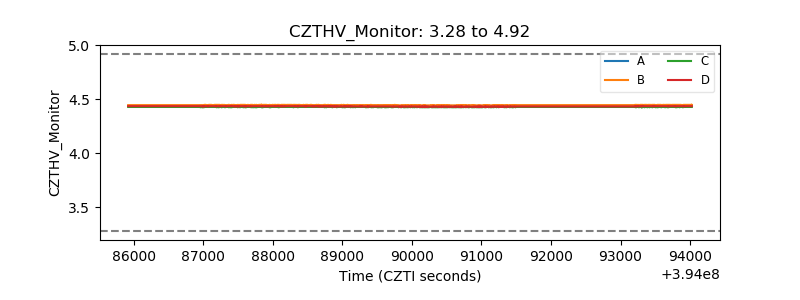 |
| D_VDD | 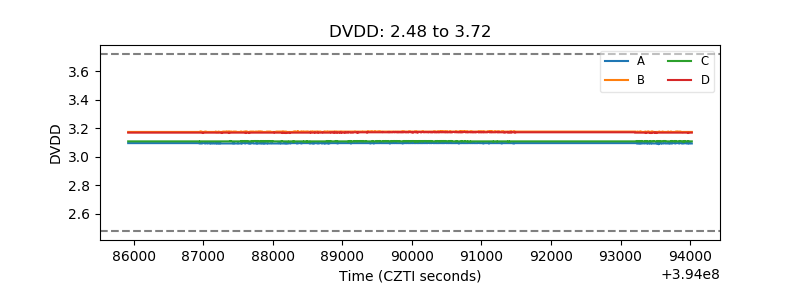 |
| Temperature 1 | 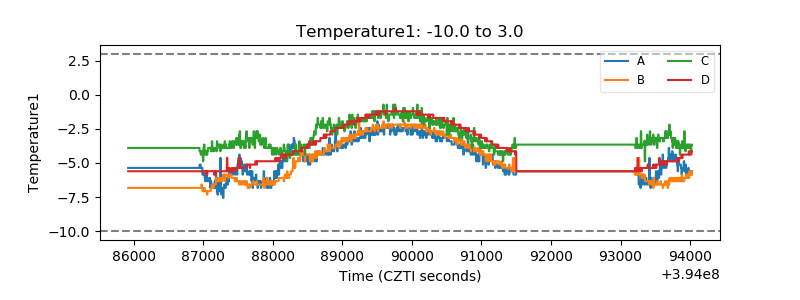 |
| Veto HV Monitor | 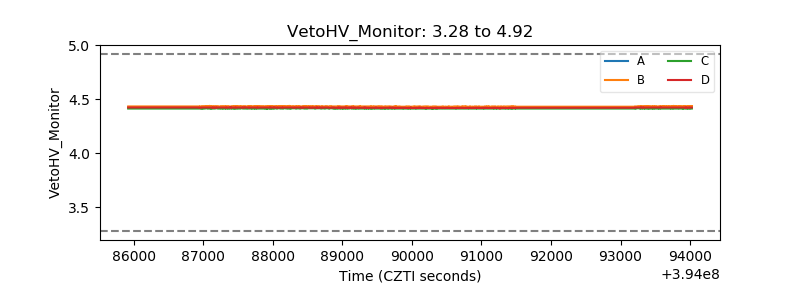 |
| Veto LLD | 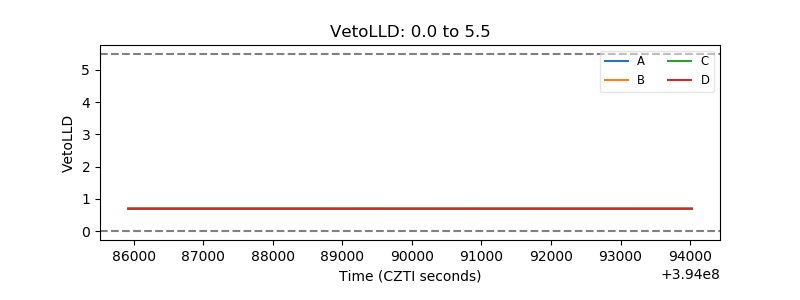 |
| Alpha Counter | 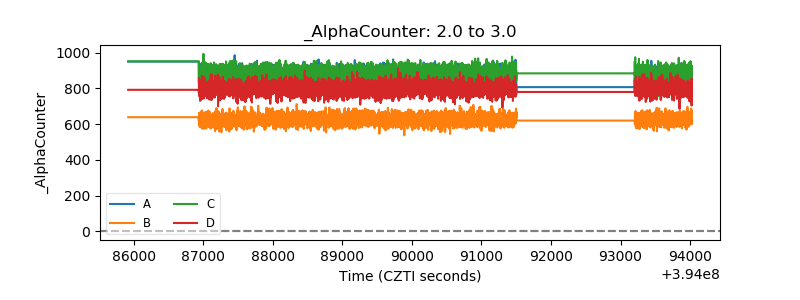 |
| _CPM_Rate | 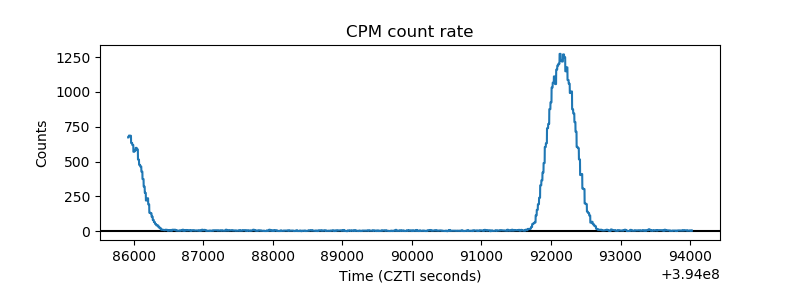 |
| CZT Counter | 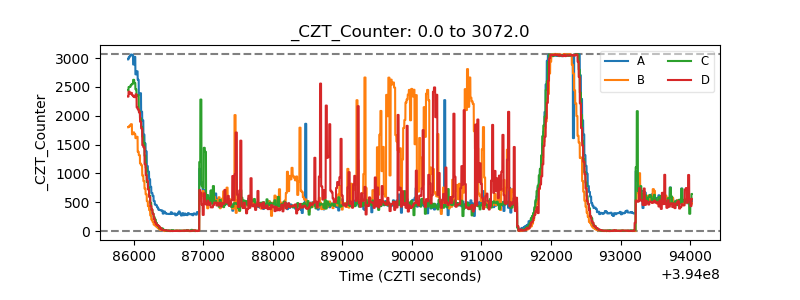 |
| +2.5 Volts monitor | 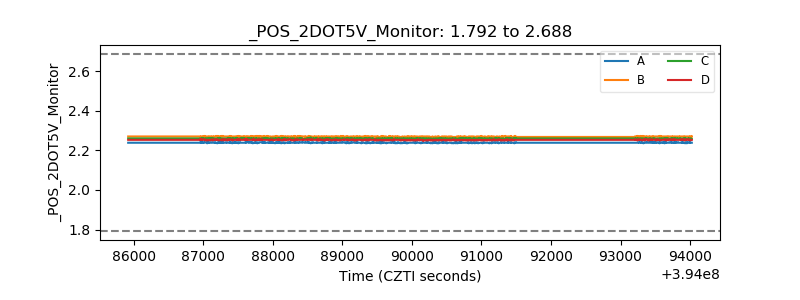 |
| +5 Volts monitor | 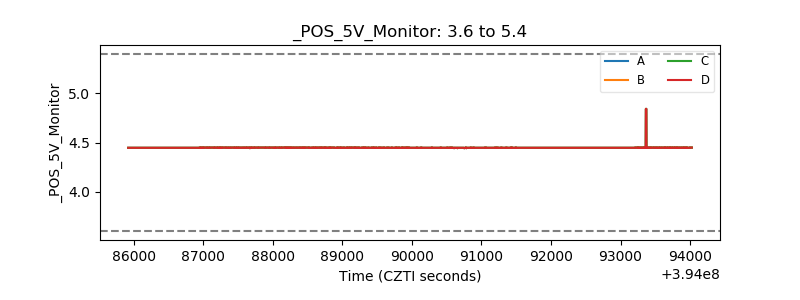 |
| _ROLL_ROT | 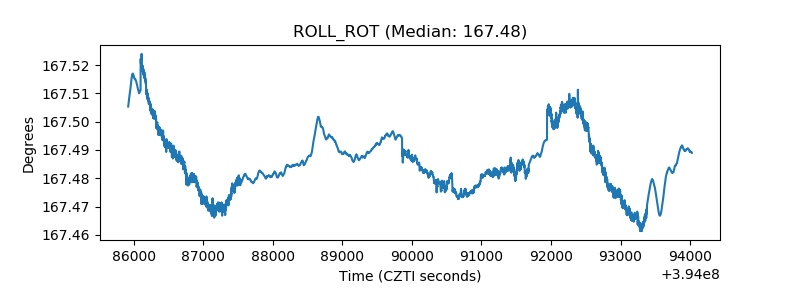 |
| _Roll_DEC | 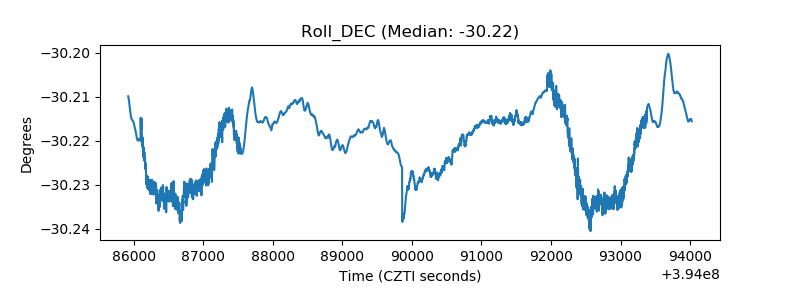 |
| _Roll_RA | 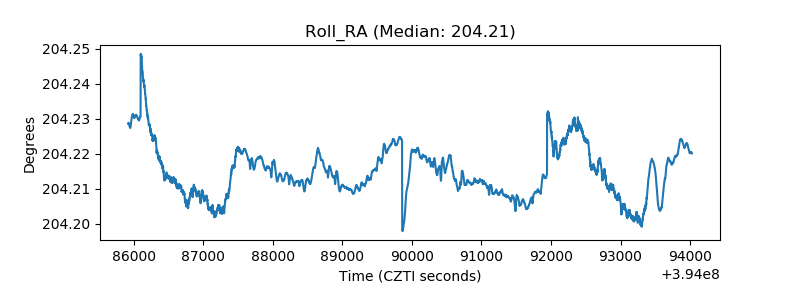 |
| Veto Counter | 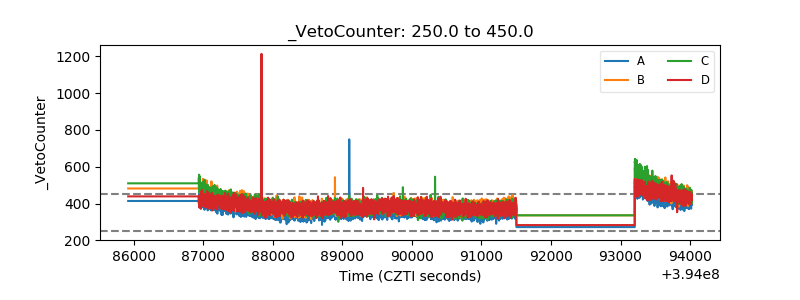 |