| Param | Original file | Final file |
|---|---|---|
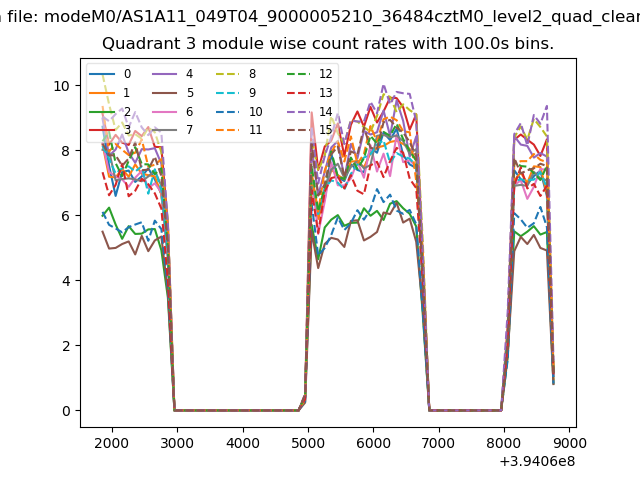
| Filename | modeM0/AS1A11_049T04_9000005210_36484cztM0_level2.evt | modeM0/AS1A11_049T04_9000005210_36484cztM0_level2_quad_clean.evt |
| Size (bytes) | 449,521,920 | 70,269,120 |
| Size | 428.7 MB | 67.0 MB |
| Events in quadrant A | 2,843,350 | 441,198 |
| Events in quadrant B | 3,840,131 | 429,257 |
| Events in quadrant C | 2,980,155 | 430,354 |
| Events in quadrant D | 3,546,812 | 412,026 |
| Mode M9 | |||
|---|---|---|---|
| Quadrant | BADHDUFLAG | Total packets | Discarded packets |
| A | 0 | 26 | 0 |
| B | 0 | 26 | 0 |
| C | 0 | 26 | 0 |
| D | 0 | 27 | 0 |
| Mode SS | |||
|---|---|---|---|
| Quadrant | BADHDUFLAG | Total packets | Discarded packets |
| A | 0 | 118 | 0 |
| B | 0 | 118 | 0 |
| C | 0 | 118 | 0 |
| D | 0 | 118 | 0 |
| Mode M0 | |||
|---|---|---|---|
| Quadrant | BADHDUFLAG | Total packets | Discarded packets |
| A | 0 | 12287 | 3 |
| B | 0 | 15441 | 2 |
| C | 0 | 12534 | 2 |
| D | 0 | 14781 | 2 |
| Quadrant | Total seconds | Saturated seconds | Saturation percentage |
|---|---|---|---|
| A | 5945 | 9 | 0.151388% |
| B | 5945 | 298 | 5.012616% |
| C | 5945 | 23 | 0.386880% |
| D | 5945 | 197 | 3.313709% |
Noise dominated data is calculated using 1-second bins in cleaned event files. If a bin has >2000 counts, and if more than 50% of those come from <1% of pixels, then it is considered to be noise-dominated and hence unusable.
| Quadrant | # 1 sec bins | Bins with >0 counts | Bins with >2000 counts | High rate bins dominated by noise | Noise dominated (total time) | Noise dominated (detector-on time) | Marked lightcurve |
|---|---|---|---|---|---|---|---|
| A | 7259 | 5946 | 1 | 1 | 0.01% | 0.02% | 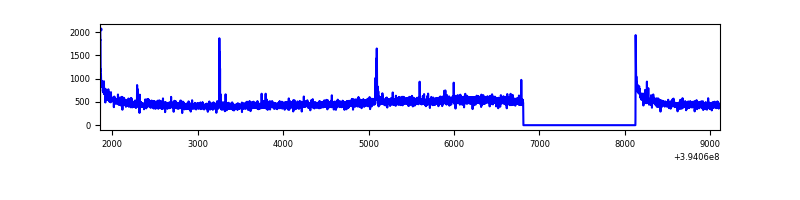 |
| B | 7259 | 5946 | 179 | 179 | 2.47% | 3.01% | 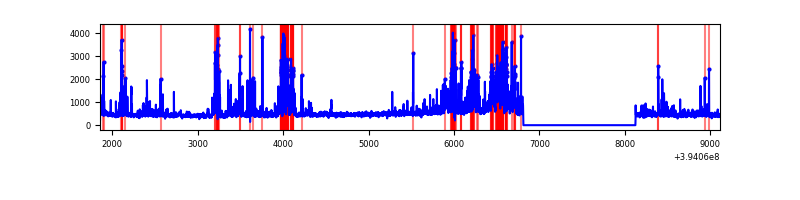 |
| C | 7259 | 5946 | 13 | 13 | 0.18% | 0.22% | 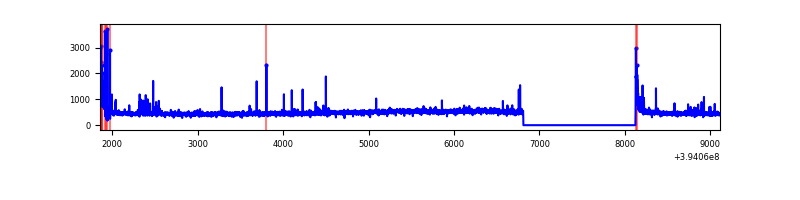 |
| D | 7259 | 5946 | 135 | 135 | 1.86% | 2.27% | 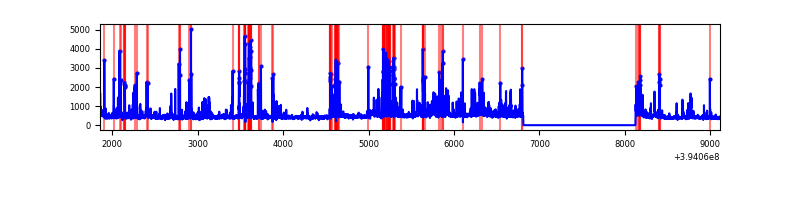 |
Top three noisy pixels from each quadrant. If the there are fewer than three noisy pixels in the level2.evt file, extra rows are filled as -1
| Pixel properties | Quadrant properties | ||||||
|---|---|---|---|---|---|---|---|
| Quadrant | DetID | PixID | Counts | Sigma | Mean | Median | Sigma |
| A | 10 | 83 | 203780 | 1469.29 | 674 | 659 | 138.2 |
| A | 9 | 143 | 27193 | 191.94 | 674 | 659 | 138.2 |
| A | 13 | 254 | 9600 | 64.68 | 674 | 659 | 138.2 |
| B | 5 | 172 | 703800 | 5556.51 | 654 | 636 | 126.5 |
| B | 5 | 255 | 315126 | 2485.15 | 654 | 636 | 126.5 |
| B | 4 | 171 | 112230 | 881.83 | 654 | 636 | 126.5 |
| C | 15 | 214 | 257862 | 1698.79 | 647 | 652 | 151.4 |
| C | 0 | 10 | 179000 | 1177.93 | 647 | 652 | 151.4 |
| C | 8 | 79 | 16223 | 102.84 | 647 | 652 | 151.4 |
| D | 13 | 249 | 541946 | 3447.55 | 642 | 625 | 157.0 |
| D | 10 | 118 | 100004 | 632.92 | 642 | 625 | 157.0 |
| D | 2 | 250 | 68948 | 435.13 | 642 | 625 | 157.0 |
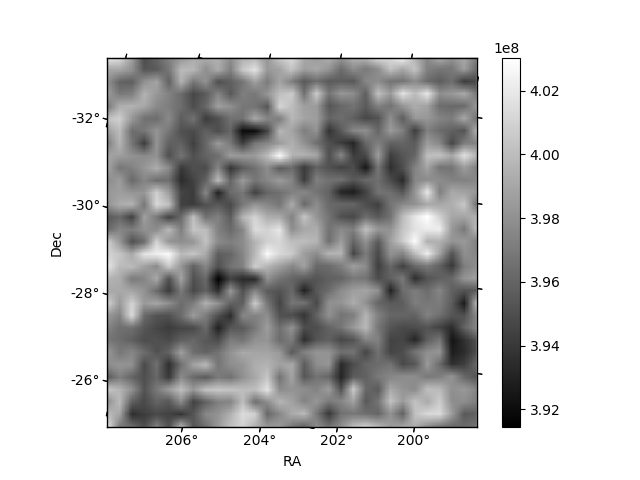
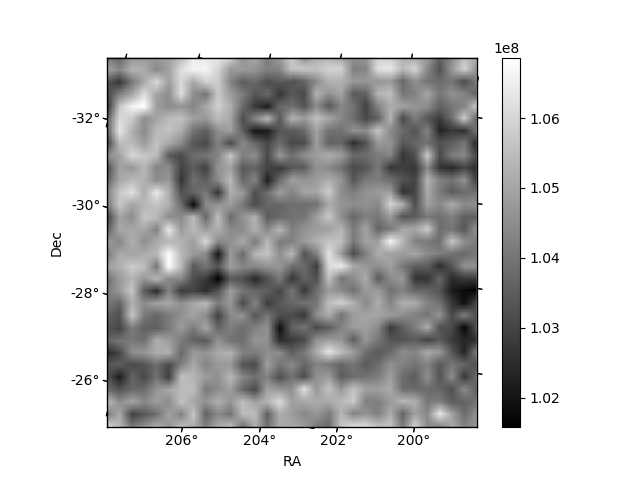
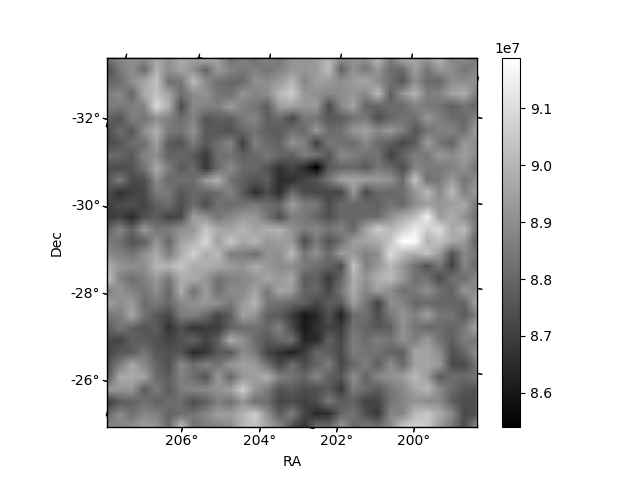
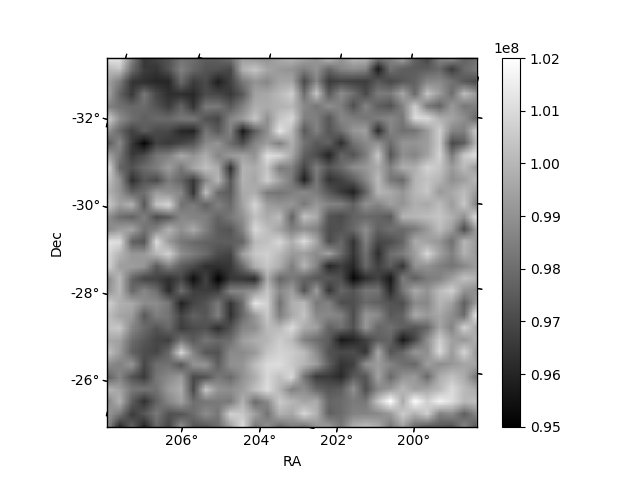
Histogram calculated using DETX and DETY for each event in the final _common_clean file
| Quadrant A | 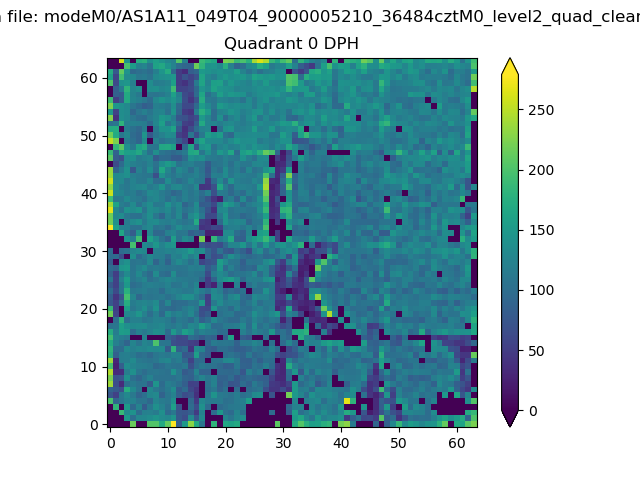 |
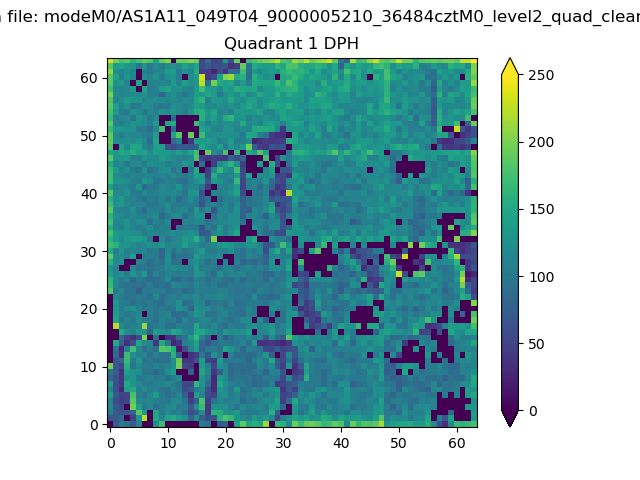 |
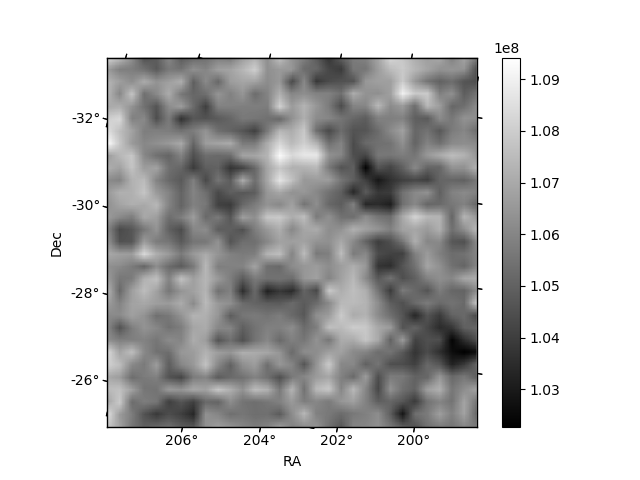
Quadrant B |
|---|---|---|---|
| Quadrant D | 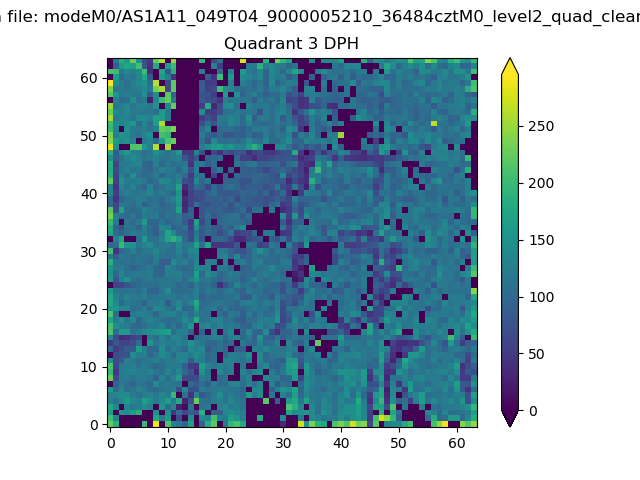 |
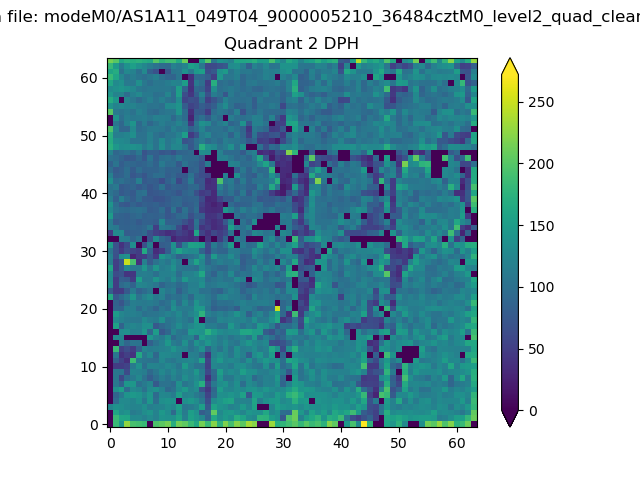 |
Quadrant C |
| Plot type | Count rate plots | Images |
|---|---|---|
| Comparison with Poisson distribution Blue bars denote a histogram of data divided into 1 sec bins. Red curve is a Poisson curve with rate = median count rate of data. |
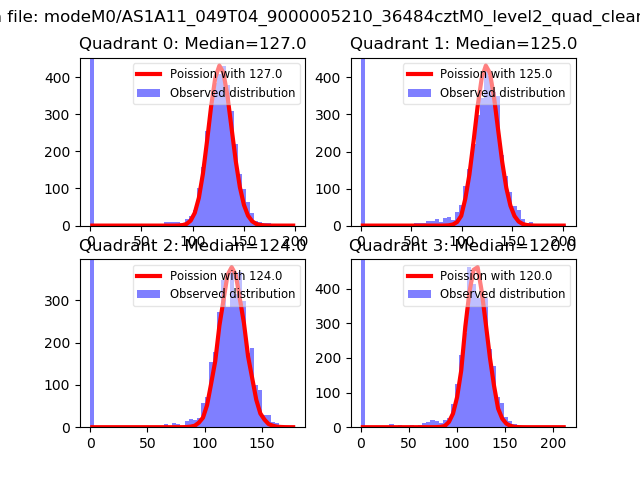 |
 |
| Quadrant-wise count rates Data is divided into 100 sec bins |
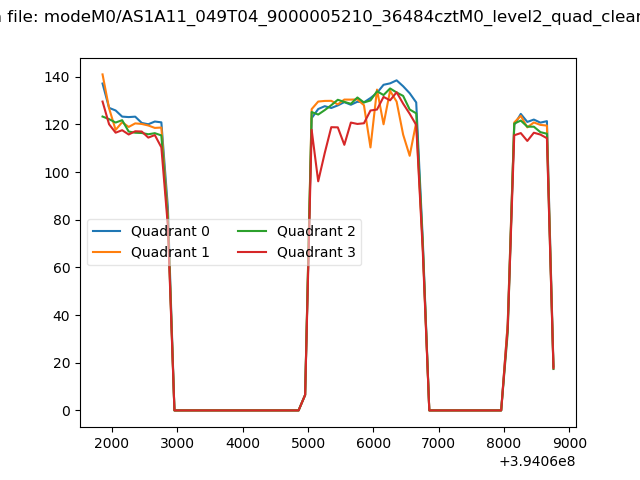 |
|
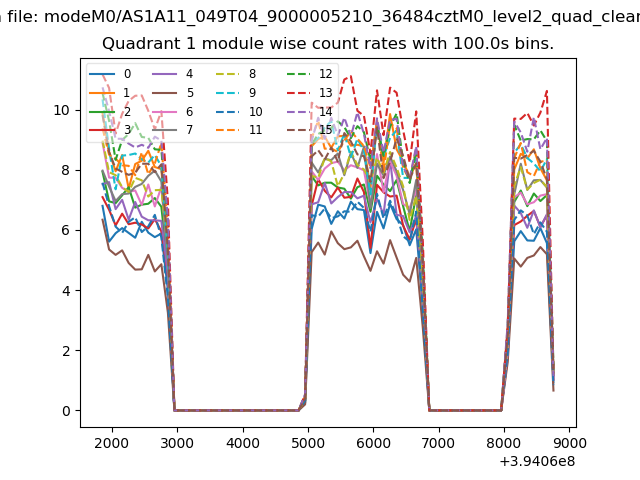
| Module-wise count rates for Quadrant A Data is divided into 100 sec bins |
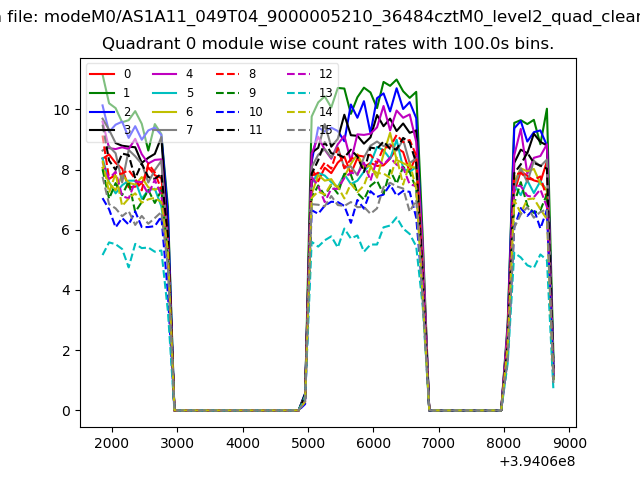 |
 |
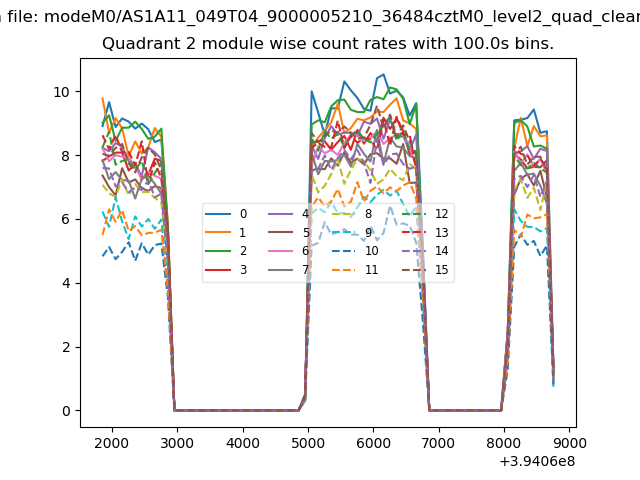
| Module-wise count rates for Quadrant B Data is divided into 100 sec bins |
 |
 |
| Module-wise count rates for Quadrant C Data is divided into 100 sec bins |
 |
 |
| Module-wise count rates for Quadrant D Data is divided into 100 sec bins |
 |
 |
| Parameter | Plot |
|---|---|
| CZT HV Monitor | 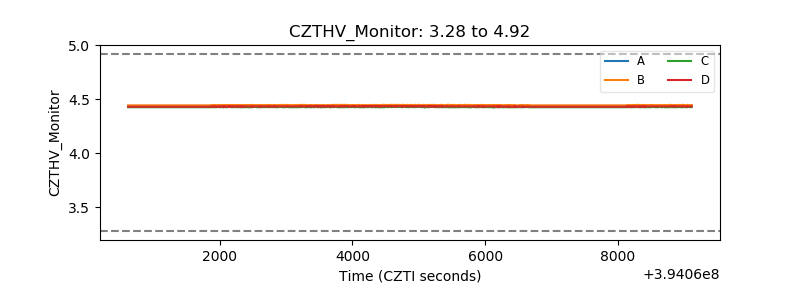 |
| D_VDD | 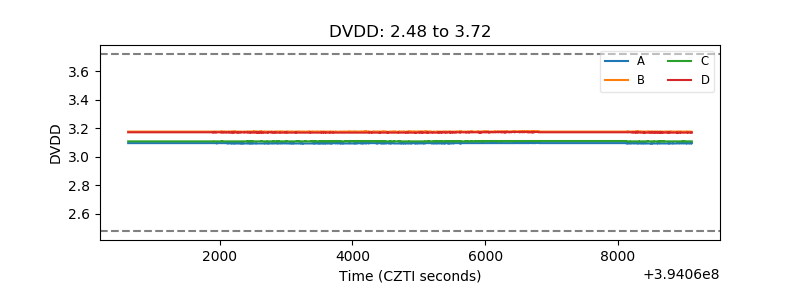 |
| Temperature 1 | 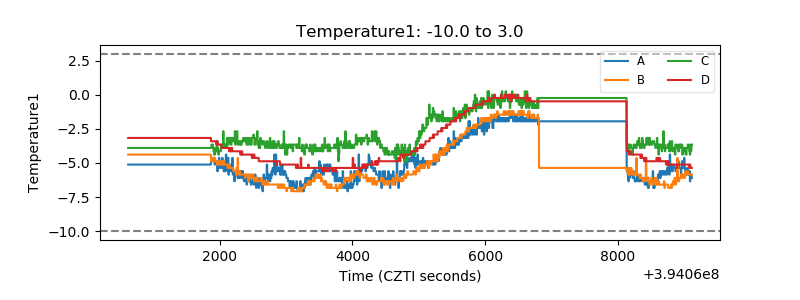 |
| Veto HV Monitor | 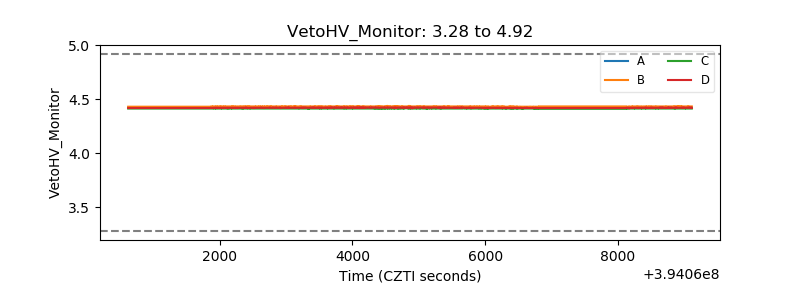 |
| Veto LLD | 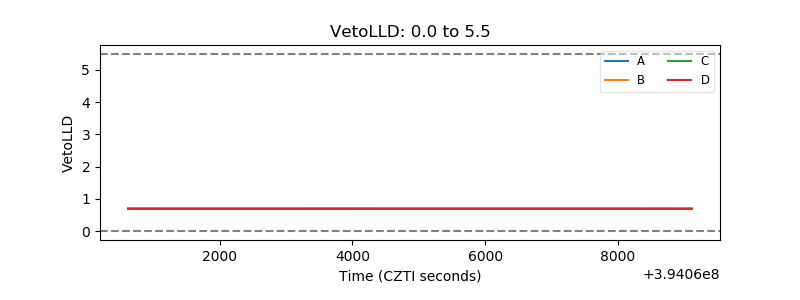 |
| Alpha Counter | 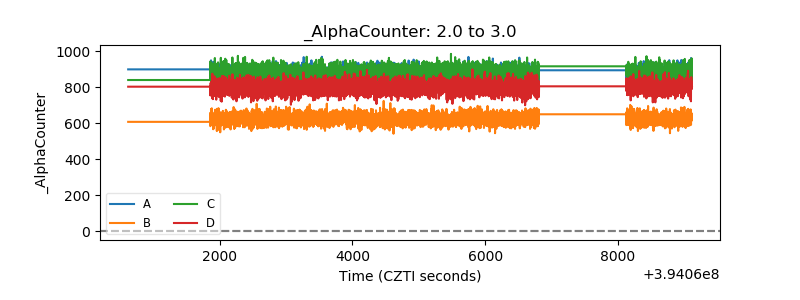 |
| _CPM_Rate | 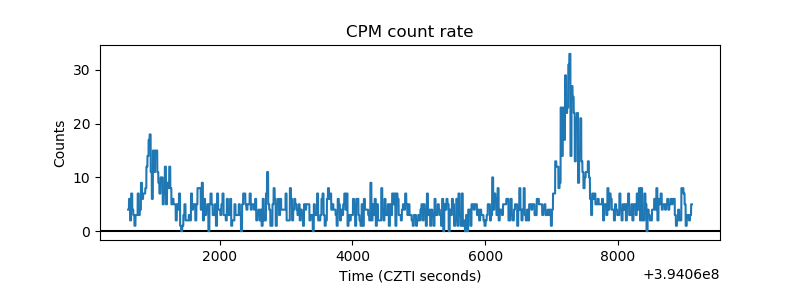 |
| CZT Counter | 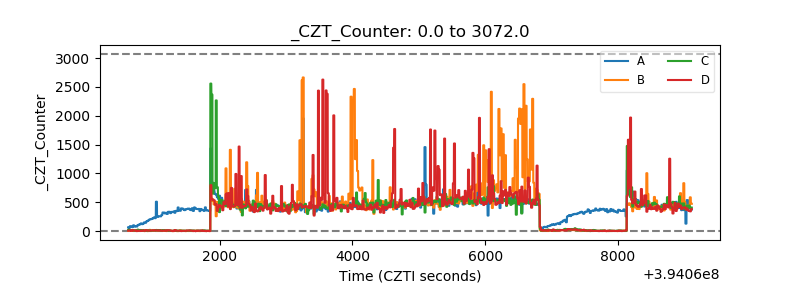 |
| +2.5 Volts monitor | 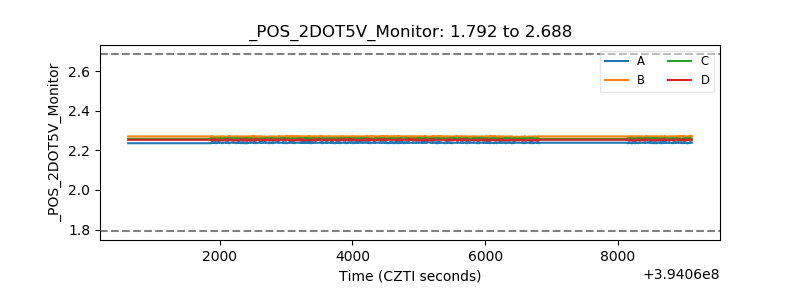 |
| +5 Volts monitor | 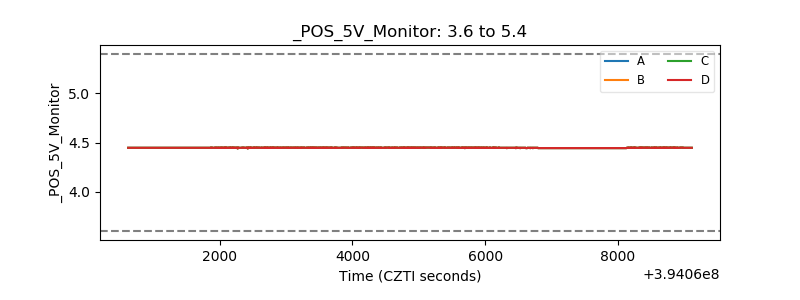 |
| _ROLL_ROT | 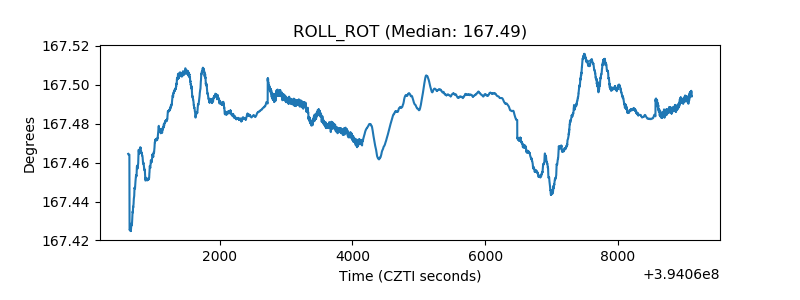 |
| _Roll_DEC | 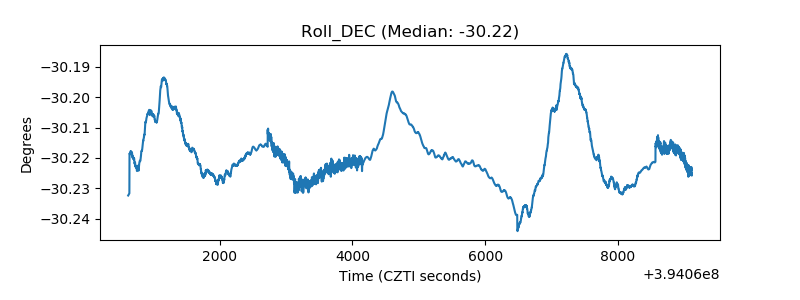 |
| _Roll_RA | 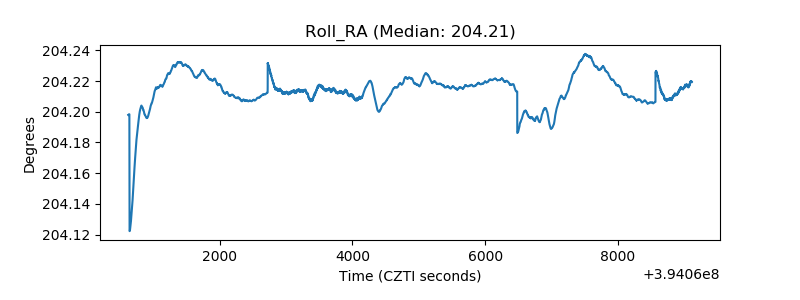 |
| Veto Counter | 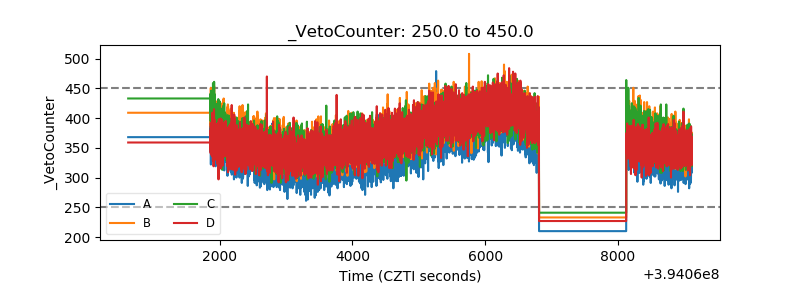 |