| Param | Original file | Final file |
|---|---|---|
| Filename | modeM0/AS1A11_049T04_9000005210_36483cztM0_level2.evt | modeM0/AS1A11_049T04_9000005210_36483cztM0_level2_quad_clean.evt |
| Size (bytes) | 349,070,400 | 57,830,400 |
| Size | 332.9 MB | 55.2 MB |
| Events in quadrant A | 2,327,623 | 358,890 |
| Events in quadrant B | 2,676,622 | 357,665 |
| Events in quadrant C | 2,442,010 | 348,518 |
| Events in quadrant D | 2,788,254 | 338,595 |
| Mode M9 | |||
|---|---|---|---|
| Quadrant | BADHDUFLAG | Total packets | Discarded packets |
| A | 0 | 14 | 0 |
| B | 0 | 14 | 0 |
| C | 0 | 14 | 0 |
| D | 0 | 14 | 0 |
| Mode SS | |||
|---|---|---|---|
| Quadrant | BADHDUFLAG | Total packets | Discarded packets |
| A | 0 | 100 | 0 |
| B | 0 | 100 | 0 |
| C | 0 | 100 | 0 |
| D | 0 | 100 | 0 |
| Mode M0 | |||
|---|---|---|---|
| Quadrant | BADHDUFLAG | Total packets | Discarded packets |
| A | 0 | 10150 | 2 |
| B | 0 | 11145 | 1 |
| C | 0 | 10345 | 1 |
| D | 0 | 11826 | 1 |
| Quadrant | Total seconds | Saturated seconds | Saturation percentage |
|---|---|---|---|
| A | 4952 | 8 | 0.161551% |
| B | 4952 | 47 | 0.949111% |
| C | 4952 | 18 | 0.363489% |
| D | 4952 | 112 | 2.261712% |
Noise dominated data is calculated using 1-second bins in cleaned event files. If a bin has >2000 counts, and if more than 50% of those come from <1% of pixels, then it is considered to be noise-dominated and hence unusable.
| Quadrant | # 1 sec bins | Bins with >0 counts | Bins with >2000 counts | High rate bins dominated by noise | Noise dominated (total time) | Noise dominated (detector-on time) | Marked lightcurve |
|---|---|---|---|---|---|---|---|
| A | 6295 | 4953 | 1 | 1 | 0.02% | 0.02% | 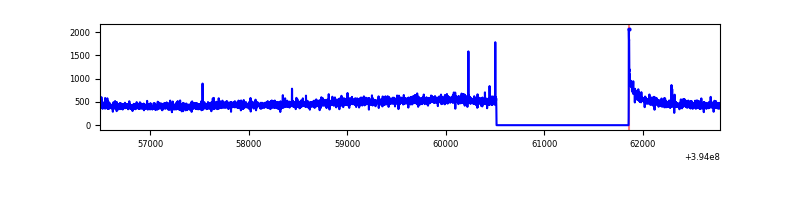 |
| B | 6295 | 4953 | 32 | 32 | 0.51% | 0.65% | 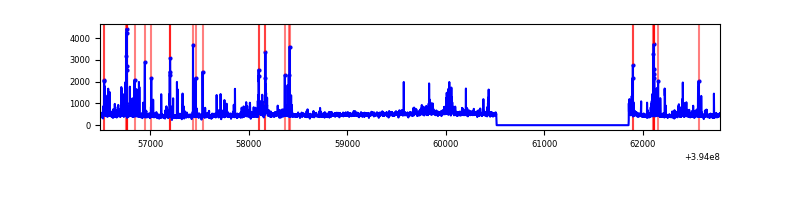 |
| C | 6295 | 4953 | 10 | 10 | 0.16% | 0.20% | 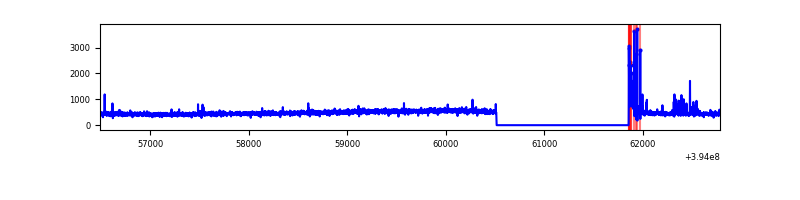 |
| D | 6295 | 4953 | 85 | 85 | 1.35% | 1.72% | 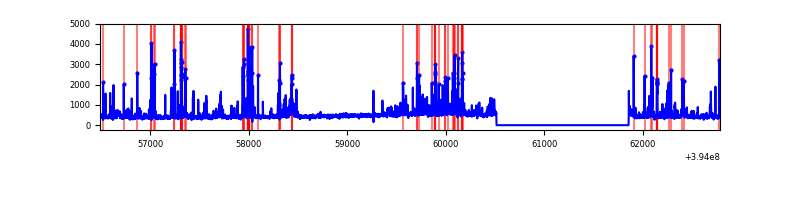 |
Top three noisy pixels from each quadrant. If the there are fewer than three noisy pixels in the level2.evt file, extra rows are filled as -1
| Pixel properties | Quadrant properties | ||||||
|---|---|---|---|---|---|---|---|
| Quadrant | DetID | PixID | Counts | Sigma | Mean | Median | Sigma |
| A | 10 | 83 | 132494 | 1148.4 | 564 | 552 | 114.9 |
| A | 9 | 143 | 10892 | 90.0 | 564 | 552 | 114.9 |
| A | 13 | 254 | 7571 | 61.09 | 564 | 552 | 114.9 |
| B | 5 | 255 | 321186 | 2968.2 | 556 | 541 | 108.0 |
| B | 5 | 172 | 94727 | 871.88 | 556 | 541 | 108.0 |
| B | 0 | 190 | 23857 | 215.84 | 556 | 541 | 108.0 |
| C | 15 | 214 | 208558 | 1640.86 | 542 | 546 | 126.8 |
| C | 0 | 10 | 94774 | 743.3 | 542 | 546 | 126.8 |
| C | 8 | 79 | 16084 | 122.57 | 542 | 546 | 126.8 |
| D | 13 | 249 | 362431 | 2739.44 | 540 | 525 | 132.1 |
| D | 2 | 250 | 86416 | 650.15 | 540 | 525 | 132.1 |
| D | 12 | 17 | 40784 | 304.74 | 540 | 525 | 132.1 |
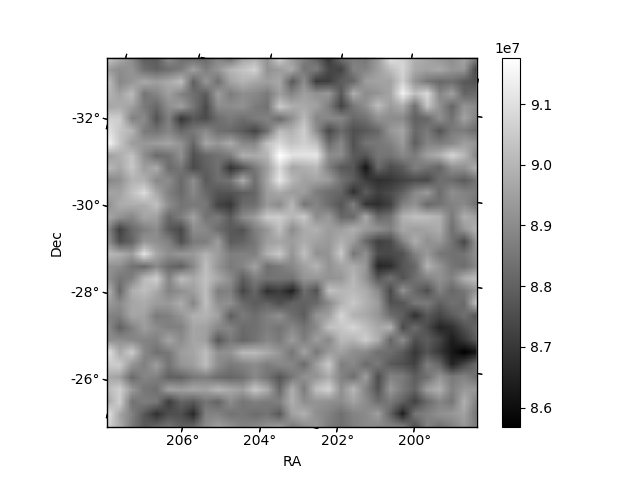
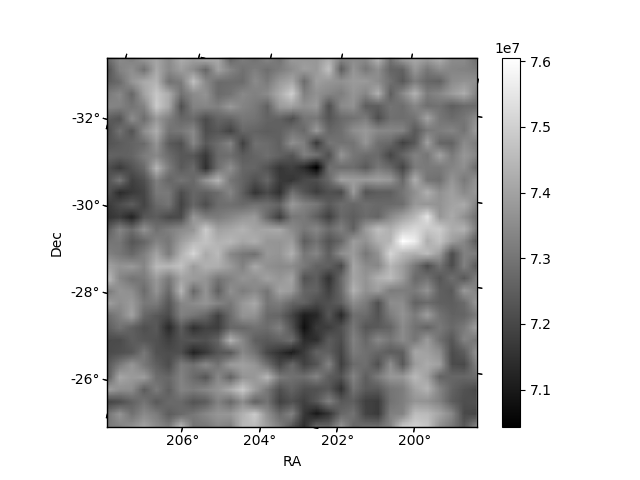
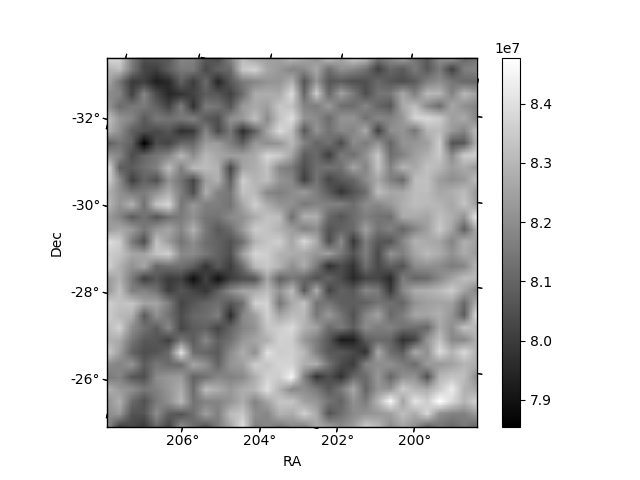
Histogram calculated using DETX and DETY for each event in the final _common_clean file
| Quadrant A | 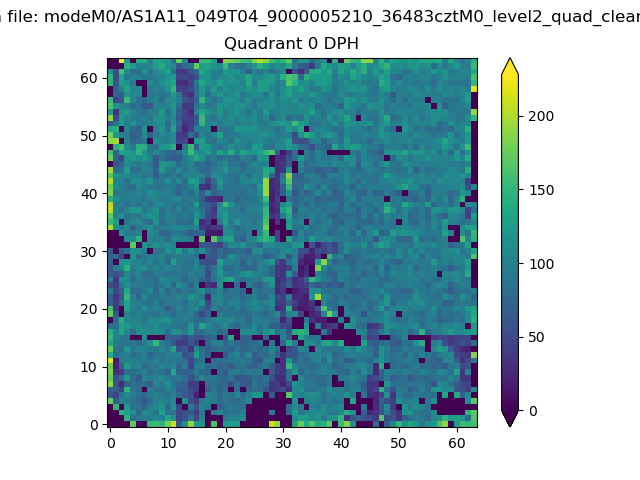 |
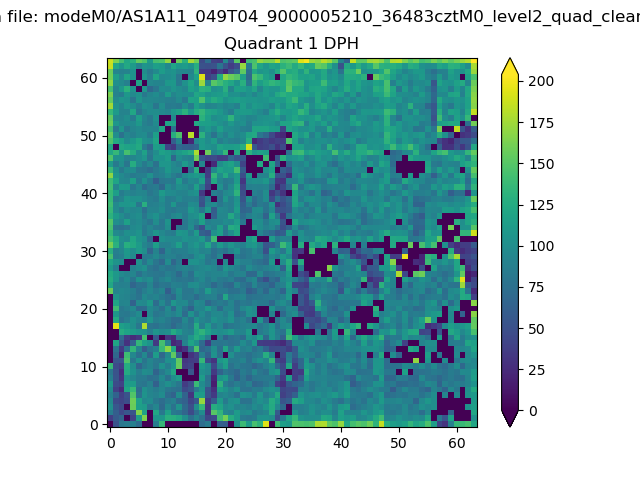 |
Quadrant B |
|---|---|---|---|
| Quadrant D | 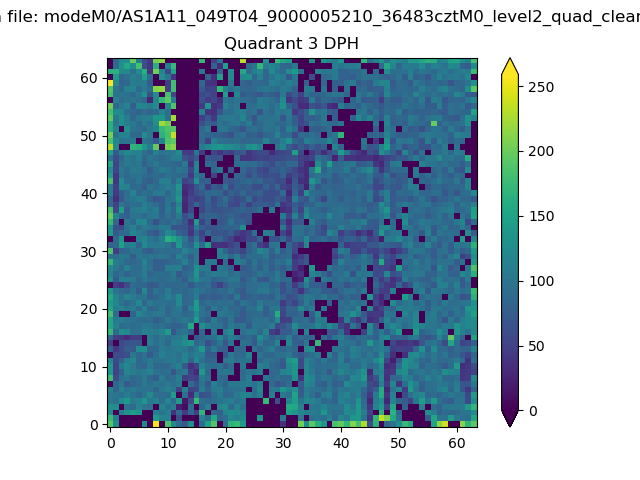 |
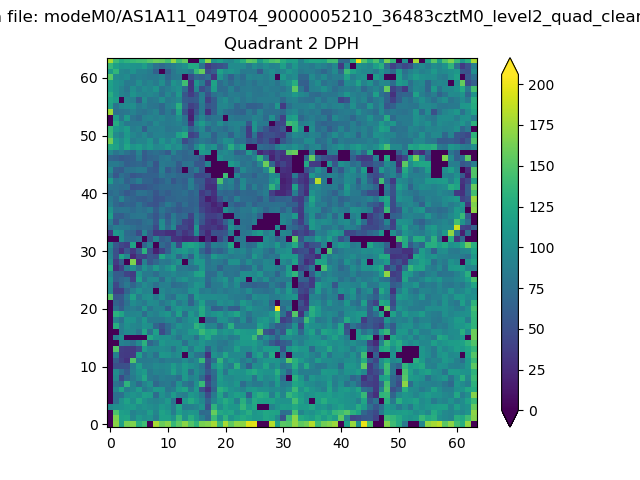 |
Quadrant C |
| Plot type | Count rate plots | Images |
|---|---|---|
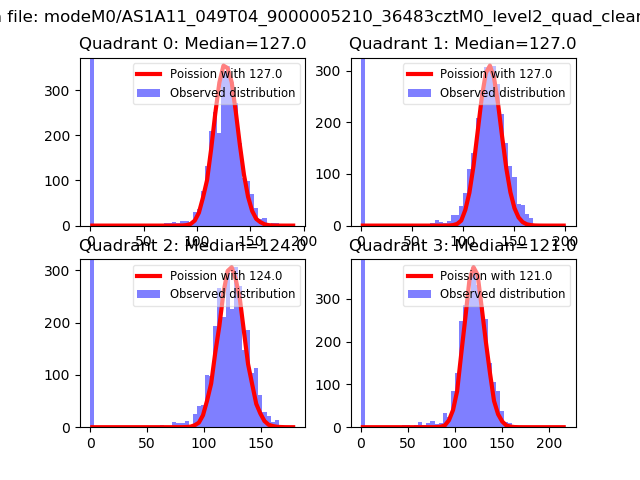
| Comparison with Poisson distribution Blue bars denote a histogram of data divided into 1 sec bins. Red curve is a Poisson curve with rate = median count rate of data. |
 |
 |
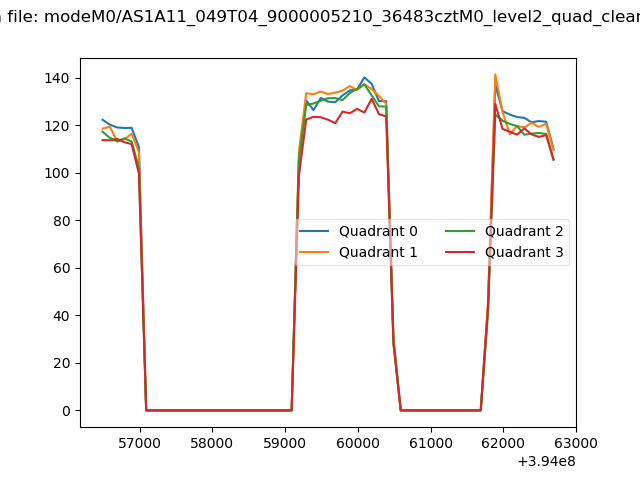
| Quadrant-wise count rates Data is divided into 100 sec bins |
 |
|
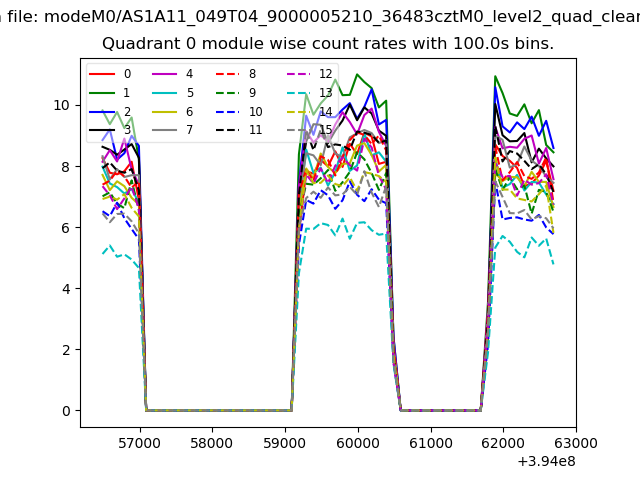
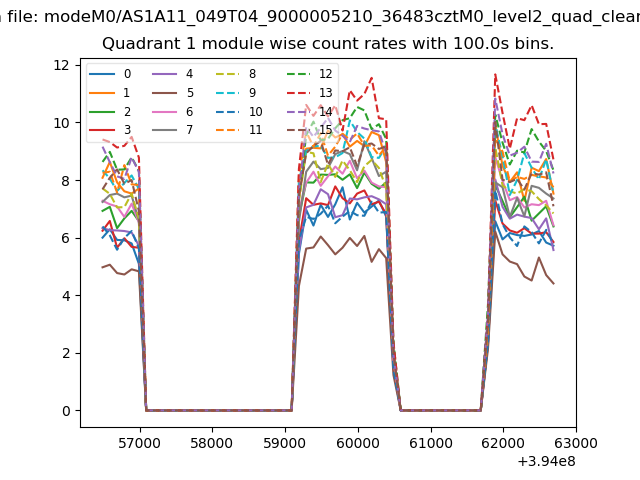
| Module-wise count rates for Quadrant A Data is divided into 100 sec bins |
 |
 |
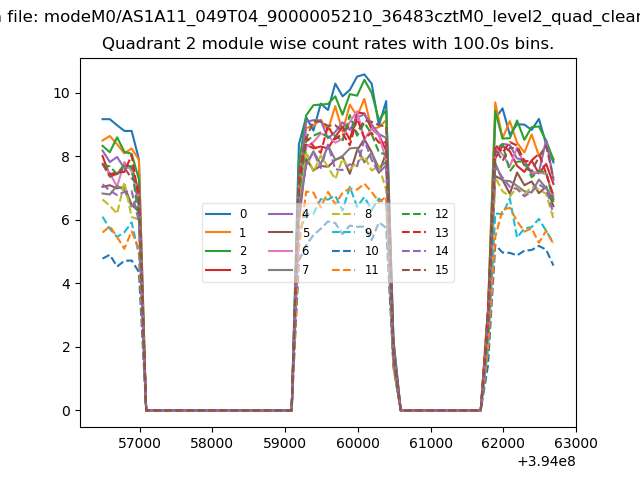
| Module-wise count rates for Quadrant B Data is divided into 100 sec bins |
 |
 |
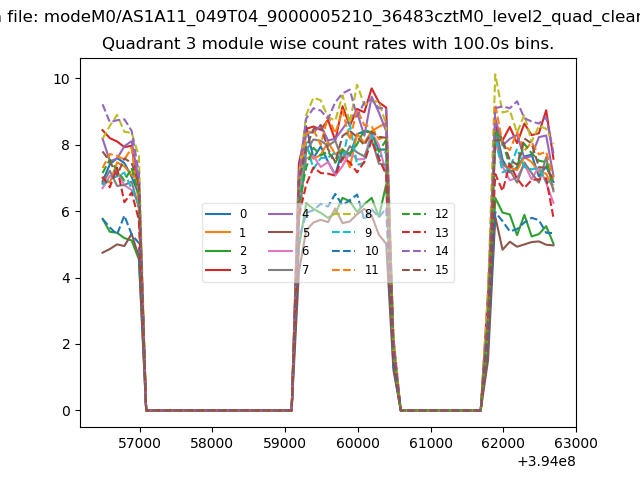
| Module-wise count rates for Quadrant C Data is divided into 100 sec bins |
 |
 |
| Module-wise count rates for Quadrant D Data is divided into 100 sec bins |
 |
 |
| Parameter | Plot |
|---|---|
| CZT HV Monitor | 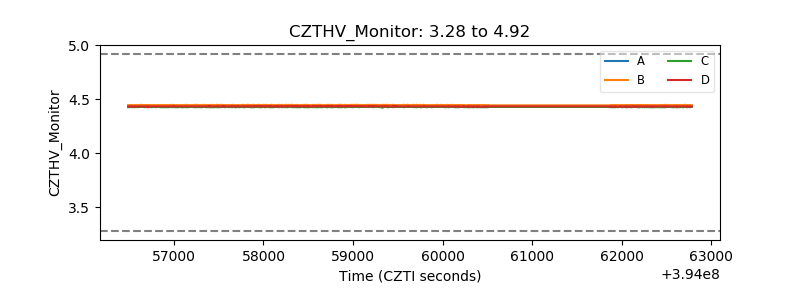 |
| D_VDD | 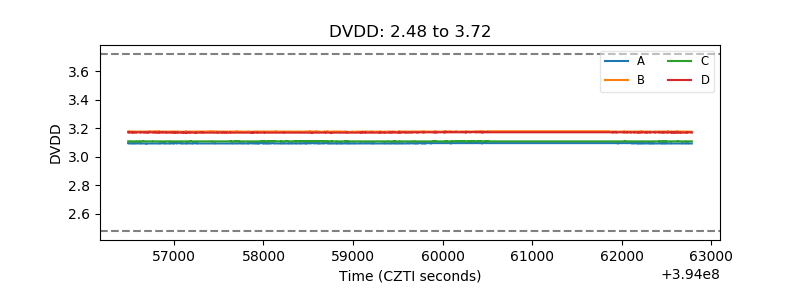 |
| Temperature 1 | 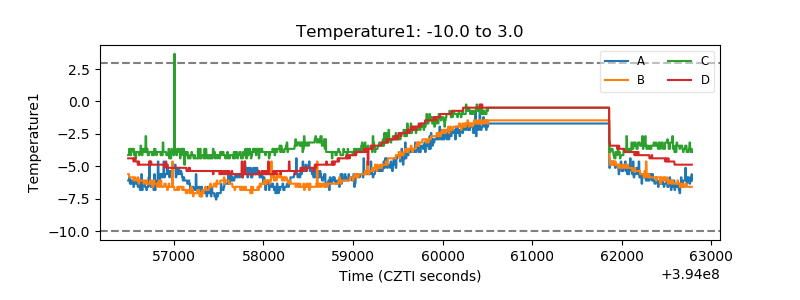 |
| Veto HV Monitor |  |
| Veto LLD | 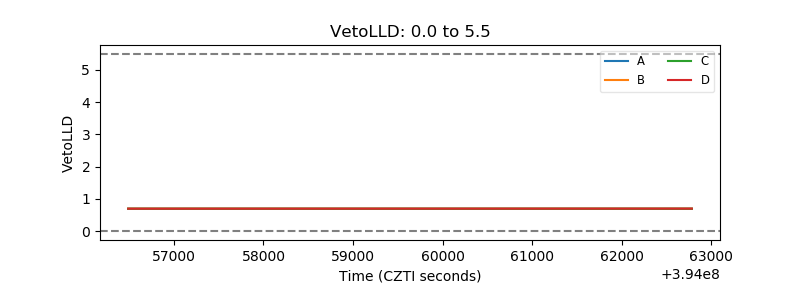 |
| Alpha Counter | 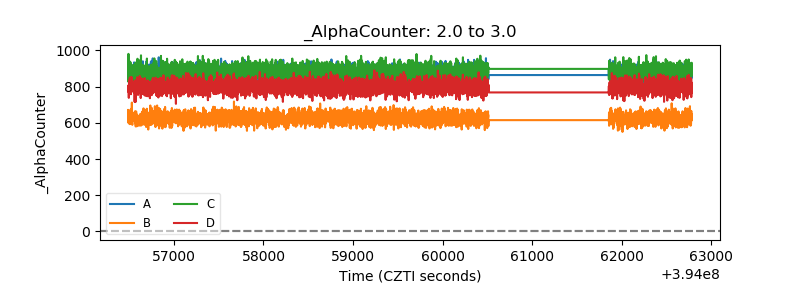 |
| _CPM_Rate | 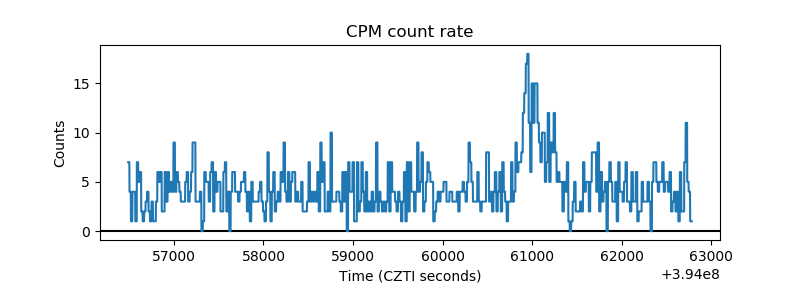 |
| CZT Counter | 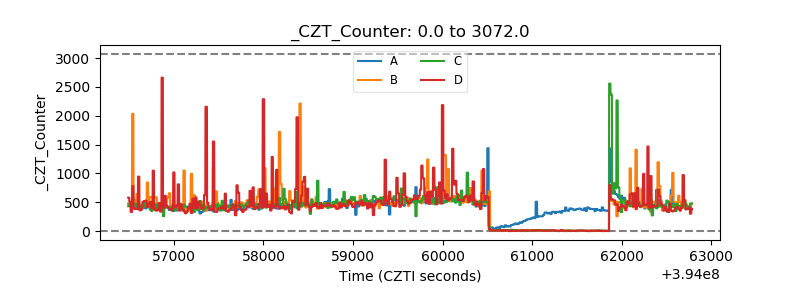 |
| +2.5 Volts monitor | 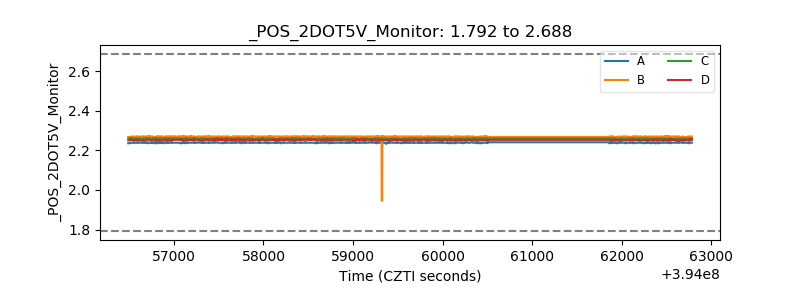 |
| +5 Volts monitor | 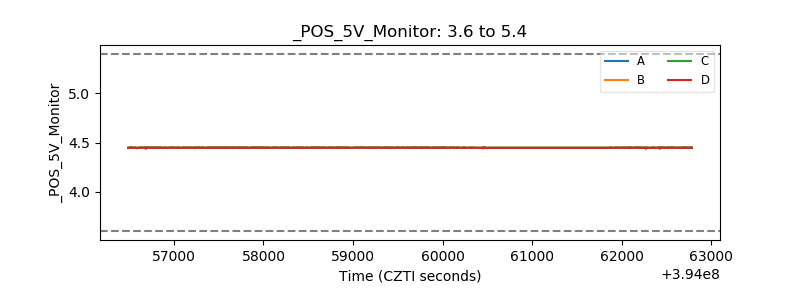 |
| _ROLL_ROT | 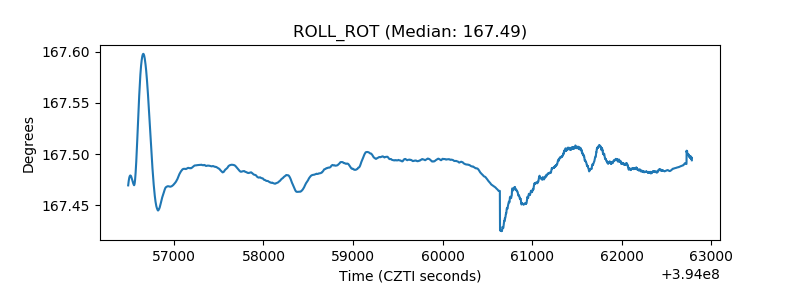 |
| _Roll_DEC | 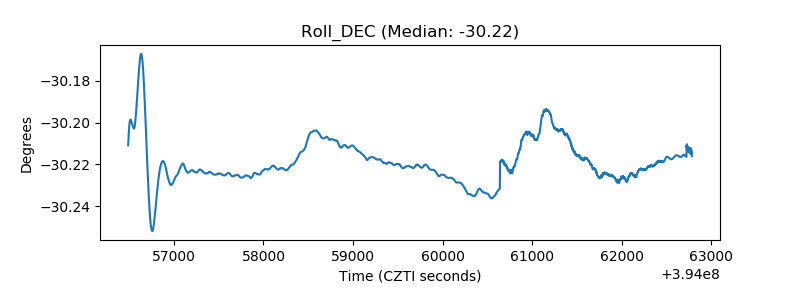 |
| _Roll_RA | 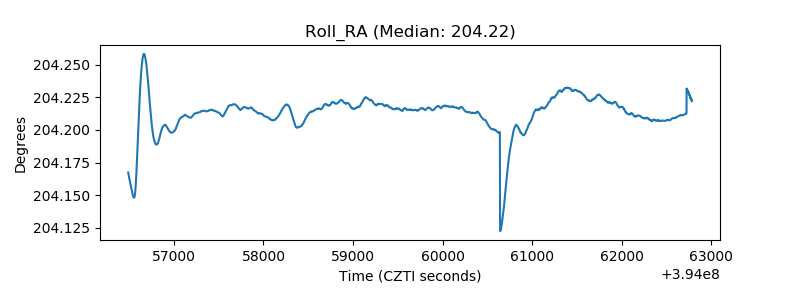 |
| Veto Counter | 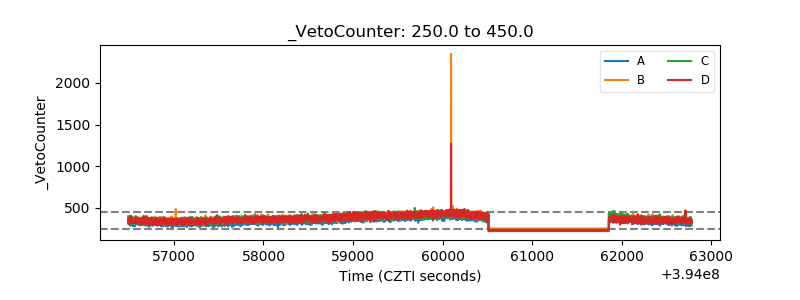 |