| Param | Original file | Final file |
|---|---|---|
| Filename | modeM0/AS1A11_049T04_9000005210cztM0_level2_bc.evt | modeM0/AS1A11_049T04_9000005210cztM0_level2_quad_clean.evt |
| Size (bytes) | 2,112,266,880 | 660,516,480 |
| Size | 2.0 GB | 629.9 MB |
| Events in quadrant A | 11,287,361 | 4,354,255 |
| Events in quadrant B | 17,440,663 | 4,180,407 |
| Events in quadrant C | 12,309,605 | 4,249,785 |
| Events in quadrant D | 19,717,949 | 3,981,430 |
| Mode M9 | |||
|---|---|---|---|
| Quadrant | BADHDUFLAG | Total packets | Discarded packets |
| A | 0 | 167 | 0 |
| B | 0 | 167 | 0 |
| C | 0 | 167 | 0 |
| D | 0 | 167 | 0 |
| Mode SS | |||
|---|---|---|---|
| Quadrant | BADHDUFLAG | Total packets | Discarded packets |
| A | 0 | 964 | 0 |
| B | 0 | 964 | 0 |
| C | 0 | 964 | 0 |
| D | 0 | 964 | 0 |
| Mode M0 | |||
|---|---|---|---|
| Quadrant | BADHDUFLAG | Total packets | Discarded packets |
| A | 0 | 98509 | 0 |
| B | 0 | 126618 | 0 |
| C | 0 | 100080 | 0 |
| D | 0 | 132896 | 0 |
| Quadrant | Total seconds | Saturated seconds | Saturation percentage |
|---|---|---|---|
| A | 47209 | 91 | 0.192760% |
| B | 47209 | 2740 | 5.803978% |
| C | 47209 | 317 | 0.671482% |
| D | 47209 | 2364 | 5.007520% |
Noise dominated data is calculated using 1-second bins in cleaned event files. If a bin has >2000 counts, and if more than 50% of those come from <1% of pixels, then it is considered to be noise-dominated and hence unusable.
| Quadrant | # 1 sec bins | Bins with >0 counts | Bins with >2000 counts | High rate bins dominated by noise | Noise dominated (total time) | Noise dominated (detector-on time) | Marked lightcurve |
|---|---|---|---|---|---|---|---|
| A | 63908 | 47219 | 9 | 9 | 0.01% | 0.02% | 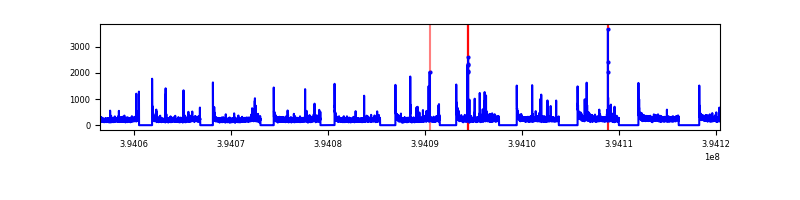 |
| B | 63908 | 47209 | 188 | 188 | 0.29% | 0.40% | 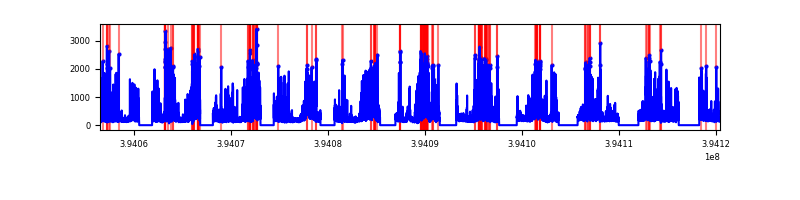 |
| C | 63908 | 47209 | 38 | 38 | 0.06% | 0.08% | 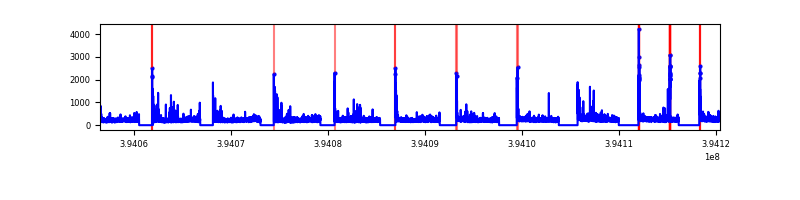 |
| D | 63908 | 47211 | 524 | 524 | 0.82% | 1.11% | 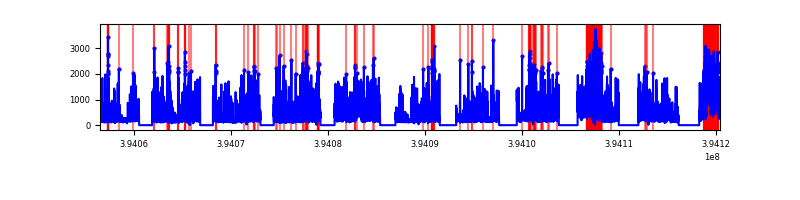 |
Top three noisy pixels from each quadrant. If the there are fewer than three noisy pixels in the level2.evt file, extra rows are filled as -1
| Pixel properties | Quadrant properties | ||||||
|---|---|---|---|---|---|---|---|
| Quadrant | DetID | PixID | Counts | Sigma | Mean | Median | Sigma |
| A | 10 | 83 | 1321410 | 2411.86 | 2478 | 2441 | 546.9 |
| A | 15 | 223 | 127115 | 227.98 | 2478 | 2441 | 546.9 |
| A | 13 | 6 | 104364 | 186.38 | 2478 | 2441 | 546.9 |
| B | 5 | 172 | 5527102 | 11576.46 | 2408 | 2360 | 477.2 |
| B | 5 | 255 | 1270694 | 2657.65 | 2408 | 2360 | 477.2 |
| B | 5 | 63 | 394216 | 821.09 | 2408 | 2360 | 477.2 |
| C | 15 | 214 | 1910554 | 3518.09 | 2376 | 2357 | 542.4 |
| C | 0 | 10 | 946649 | 1740.96 | 2376 | 2357 | 542.4 |
| C | 6 | 255 | 91679 | 164.68 | 2376 | 2357 | 542.4 |
| D | 12 | 227 | 3148325 | 5662.4 | 2374 | 2311 | 555.6 |
| D | 13 | 249 | 2056572 | 3697.39 | 2374 | 2311 | 555.6 |
| D | 2 | 250 | 1115991 | 2004.47 | 2374 | 2311 | 555.6 |
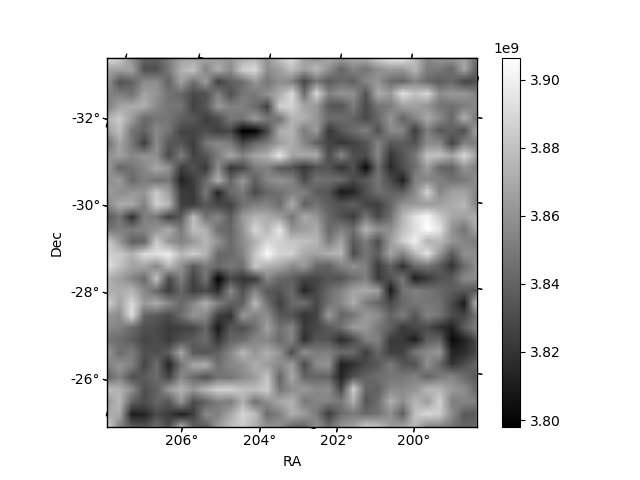
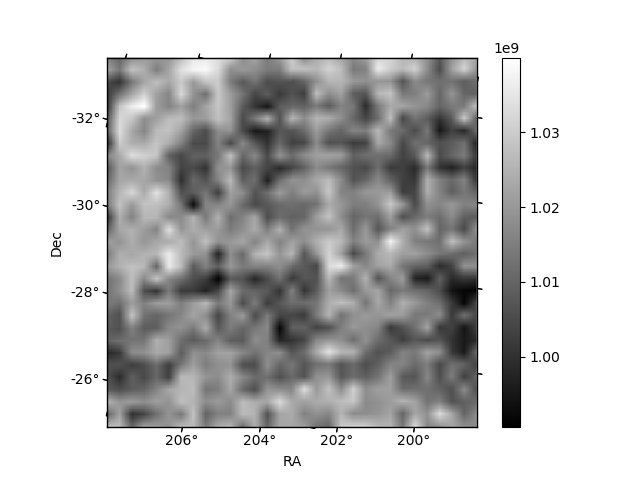
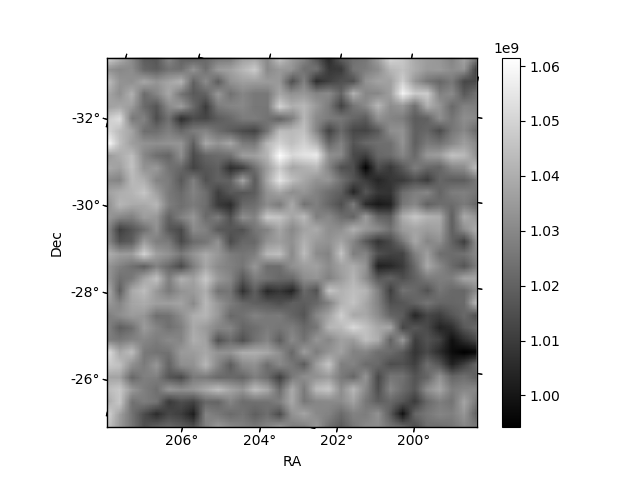
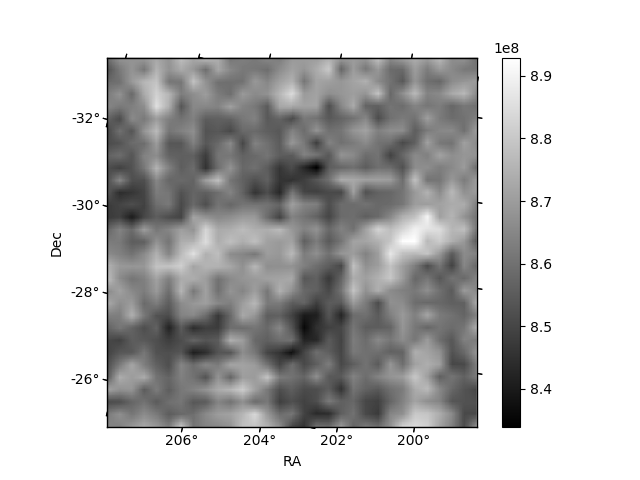
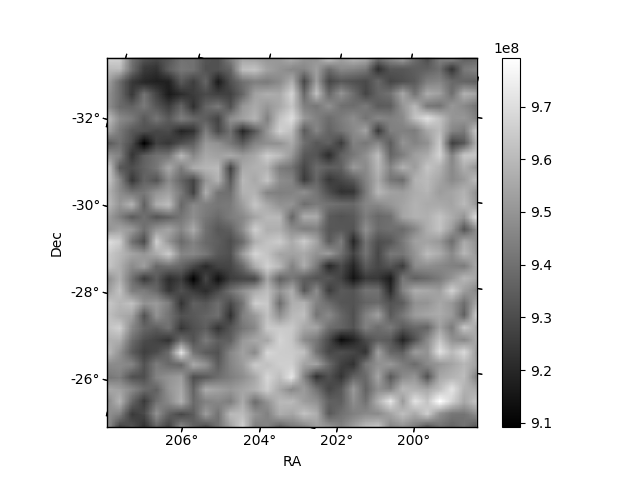
Histogram calculated using DETX and DETY for each event in the final _common_clean file
| Quadrant A | 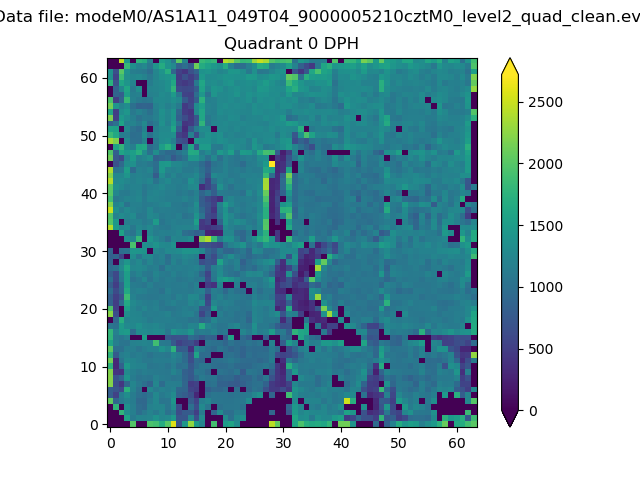 |
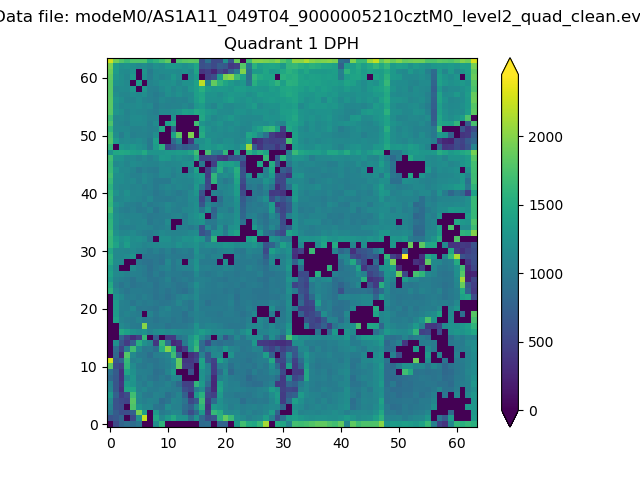 |
Quadrant B |
|---|---|---|---|
| Quadrant D | 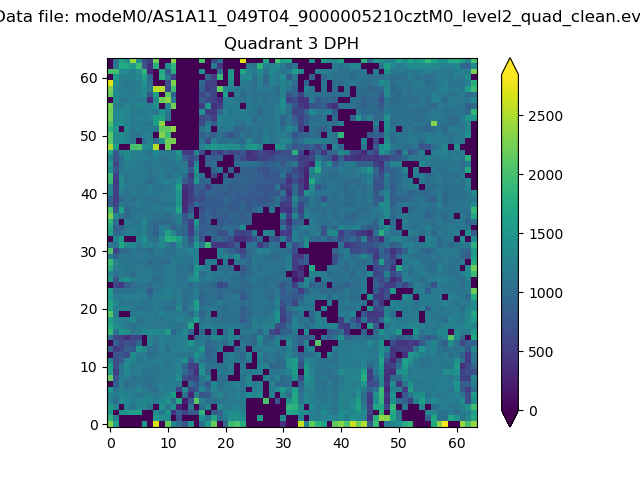 |
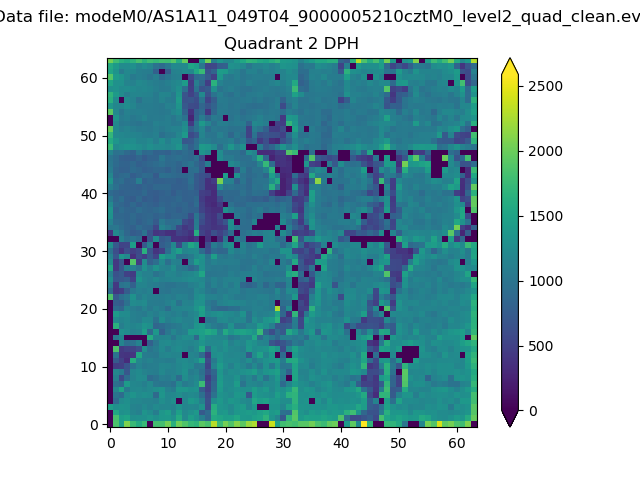 |
Quadrant C |
| Plot type | Count rate plots | Images |
|---|---|---|
| Comparison with Poisson distribution Blue bars denote a histogram of data divided into 1 sec bins. Red curve is a Poisson curve with rate = median count rate of data. |
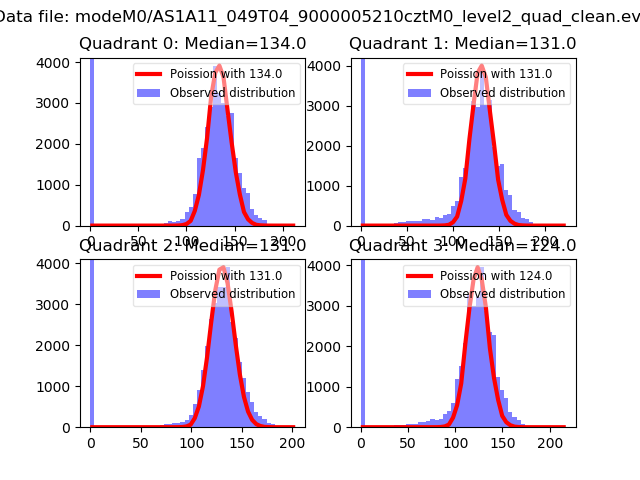 |
 |
| Quadrant-wise count rates Data is divided into 100 sec bins |
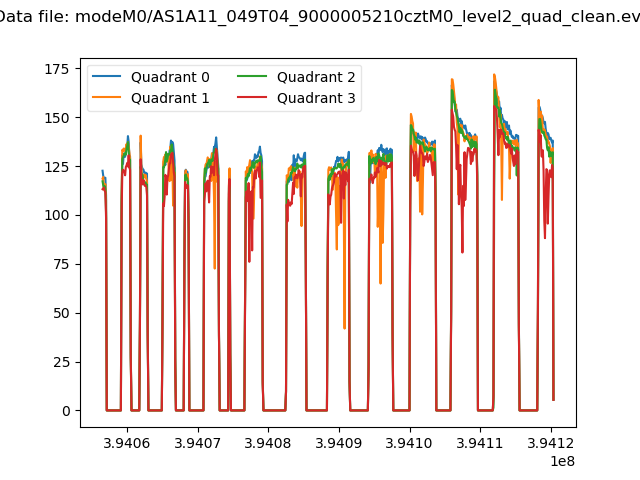 |
|
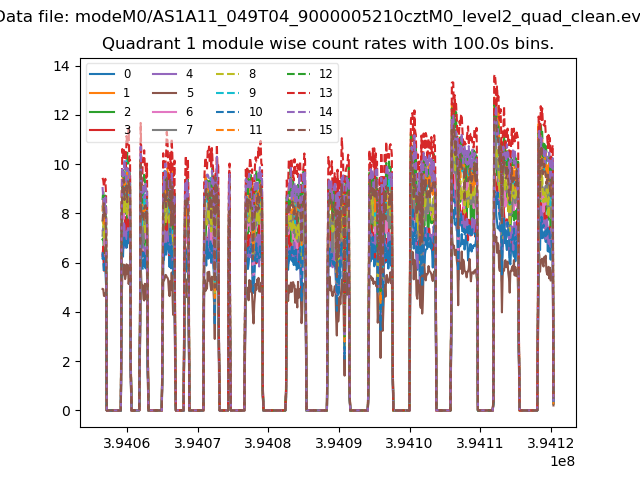
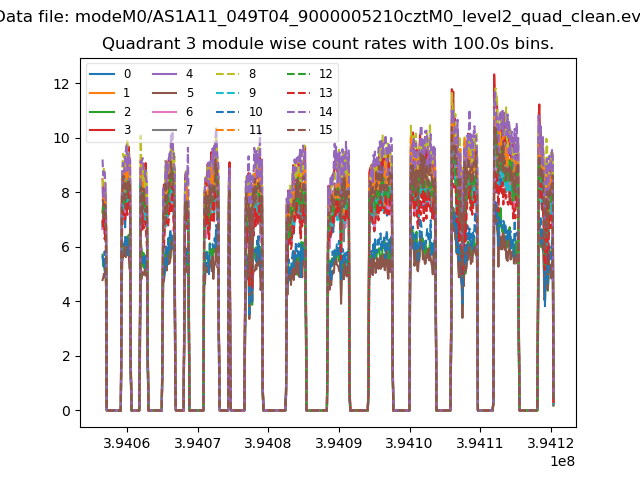
| Module-wise count rates for Quadrant A Data is divided into 100 sec bins |
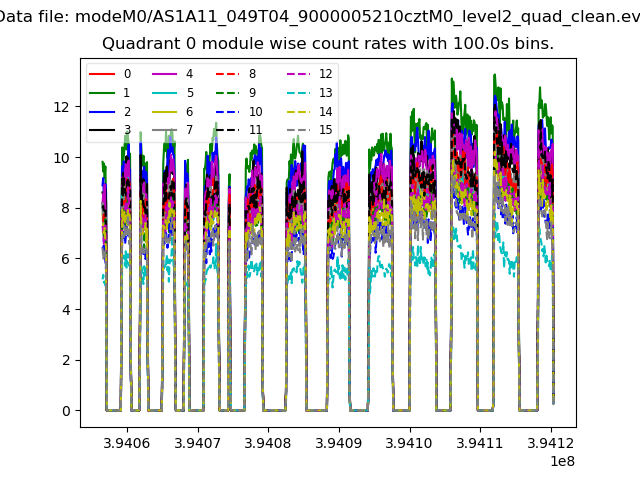 |
 |
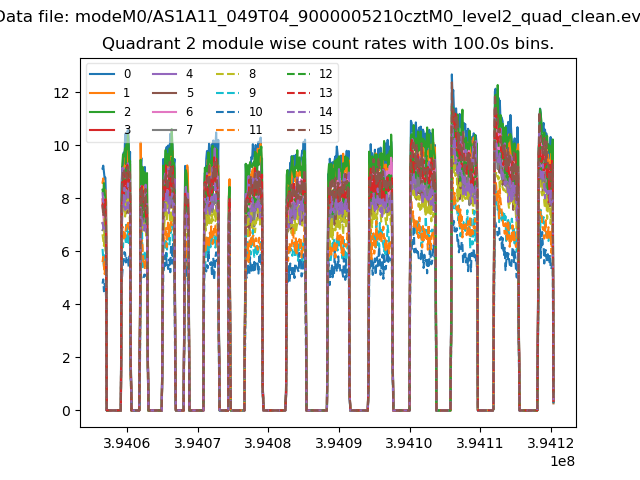
| Module-wise count rates for Quadrant B Data is divided into 100 sec bins |
 |
 |
| Module-wise count rates for Quadrant C Data is divided into 100 sec bins |
 |
 |
| Module-wise count rates for Quadrant D Data is divided into 100 sec bins |
 |
 |
| Parameter | Plot |
|---|---|
| CZT HV Monitor | 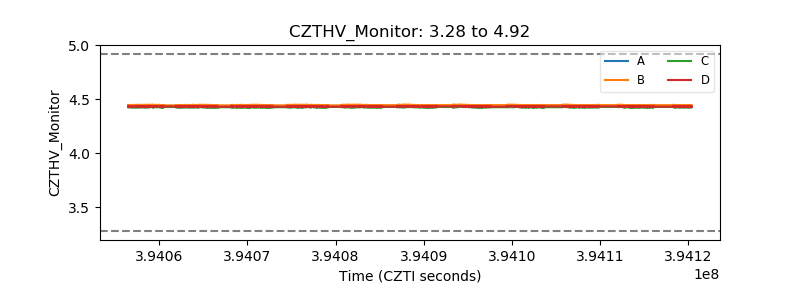 |
| D_VDD | 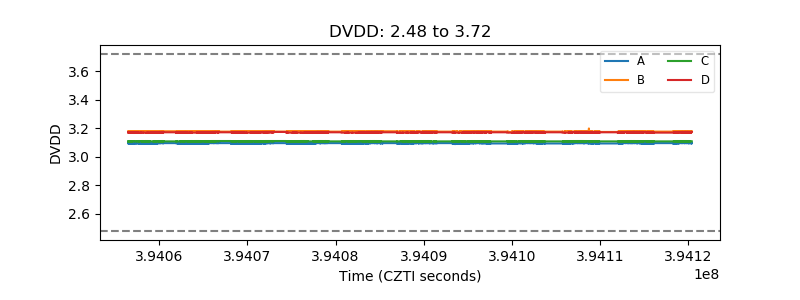 |
| Temperature 1 | 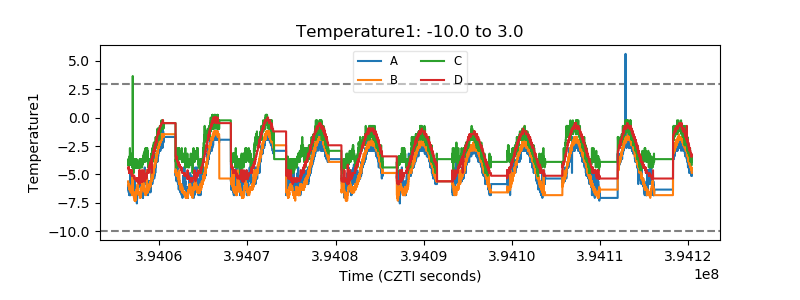 |
| Veto HV Monitor | 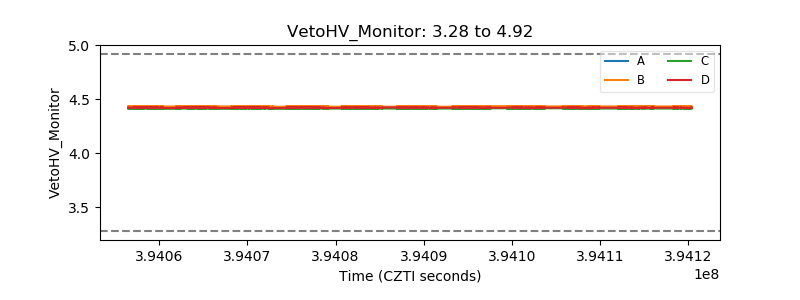 |
| Veto LLD | 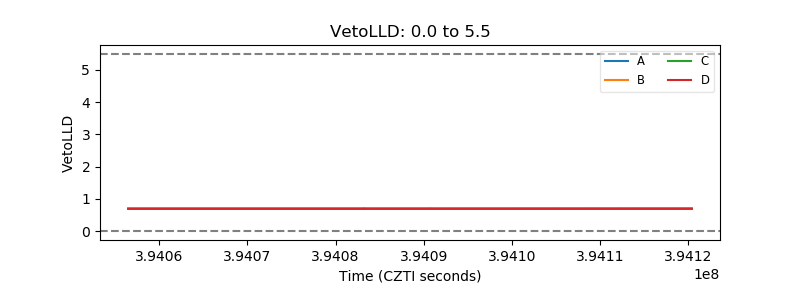 |
| Alpha Counter | 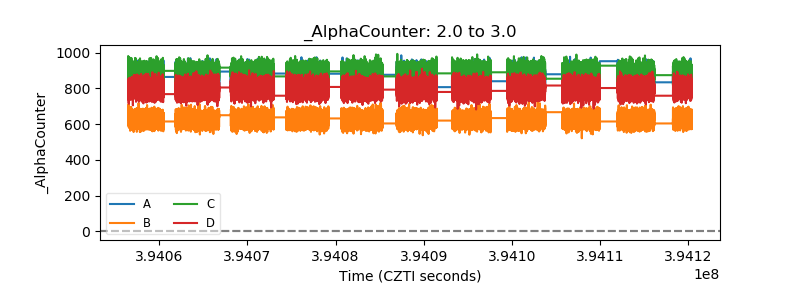 |
| _CPM_Rate | 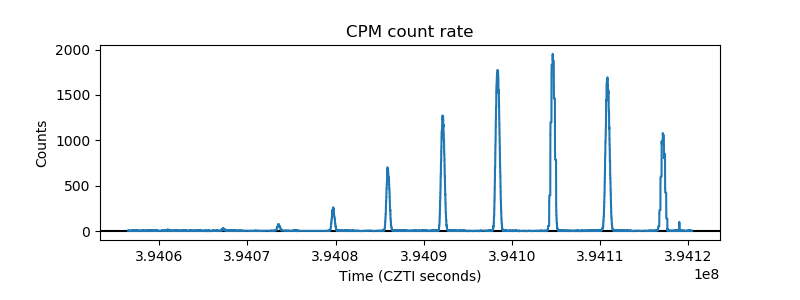 |
| CZT Counter | 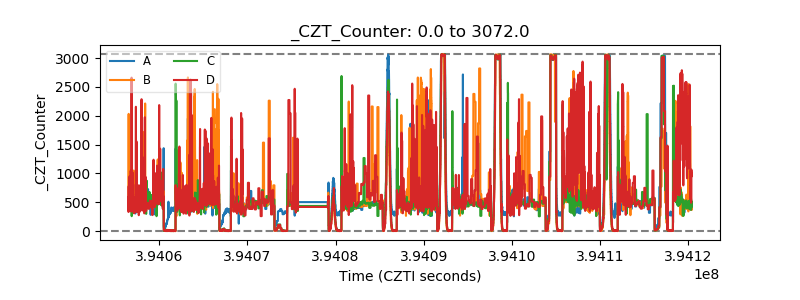 |
| +2.5 Volts monitor | 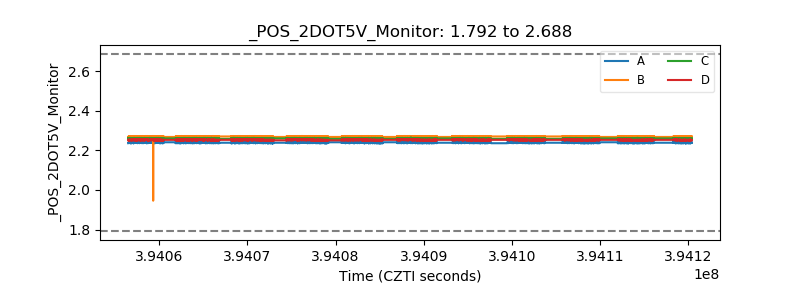 |
| +5 Volts monitor | 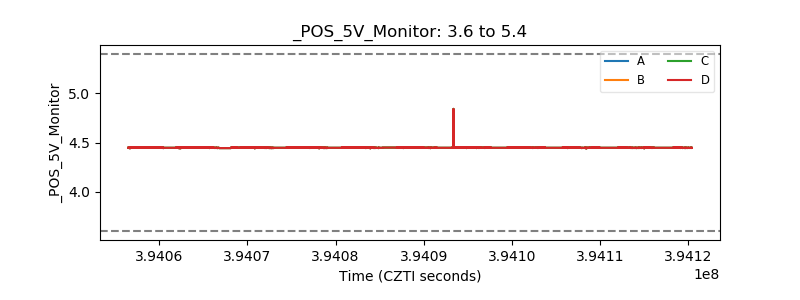 |
| _ROLL_ROT | 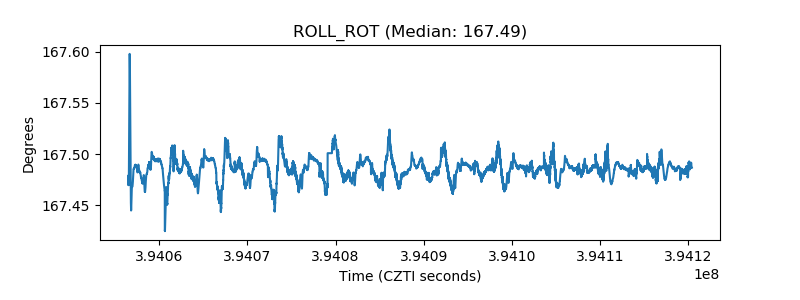 |
| _Roll_DEC | 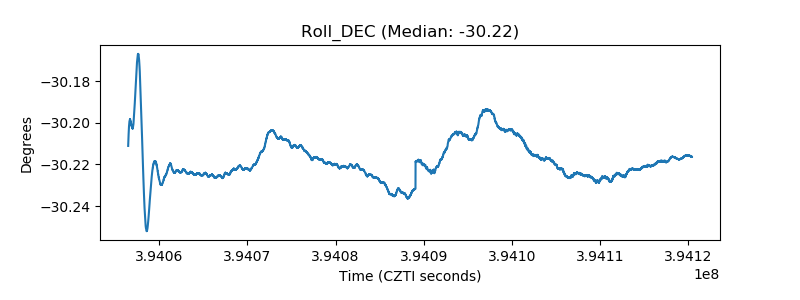 |
| _Roll_RA | 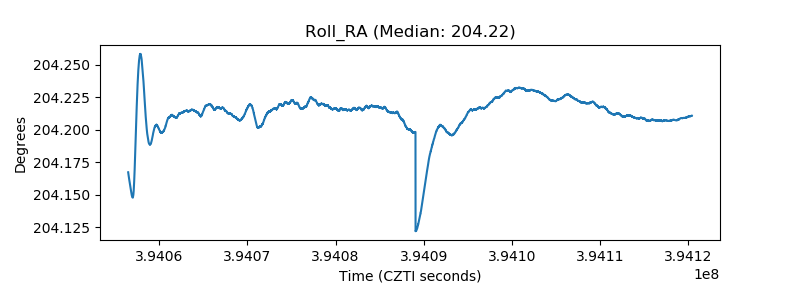 |
| Veto Counter | 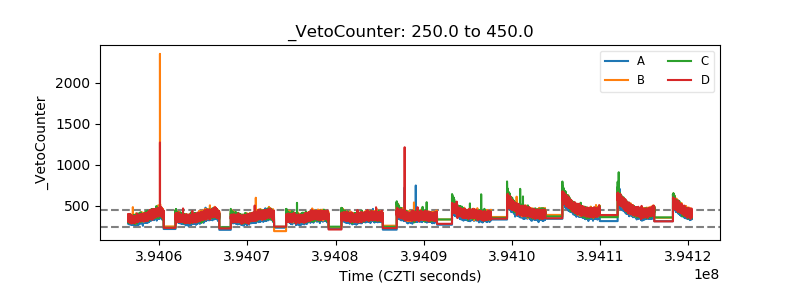 |